Environmental Declaration 2020 - Dentsply SIRONA at the Bensheim site
←
→
Page content transcription
If your browser does not render page correctly, please read the page content below
Dentsply SIRONA at the Bensheim site

Environmental Declaration 2020
Table of contents

1.     Dentsply Sirona at the Bensheim site .......................................................................................4
     1.1     Scope of the environmental management system .............................................................5
     1.2     Layout of the Bensheim site ..............................................................................................6
     1.3     Structure of Dentsply Sirona at the Bensheim site.............................................................7
     1.4     Activities and manufacturing procedures at the Bensheim site ..........................................7
2.     Integrated Management ...........................................................................................................8
     2.1     Executive management .....................................................................................................9
     2.2     EH&S Management Officer ...............................................................................................9
     2.3     Statutory officers ...............................................................................................................9
     2.4     Voluntary officers ..............................................................................................................9
     2.5     Employees and works council .........................................................................................10
     2.6     Continuous improvement ................................................................................................10
     2.7     Emergencies ...................................................................................................................10
     2.8     Context of the organization, interested parties, risks and opportunities ...........................11
3.     Environmental policy ..............................................................................................................13
4.     Environmental aspects ...........................................................................................................15
     4.1     Evaluation of the environmental aspects .........................................................................16
5.     Environmental targets and programs ......................................................................................18
     5.1     Environmental targets and programs 2017 - 2019 ...........................................................18
     5.2     Environmental targets and programs 2020 - 2022 ...........................................................20
6.     Important environmental dates and figures .............................................................................24
     6.1     Generation of energy, energy flow and energy consumption ...........................................24
     6.2     Raw materials and supplies.............................................................................................30
     6.3     Hazardous materials and substances harmful to water ...................................................30
     6.4     Emissions........................................................................................................................31
     6.5     On-site Waste .................................................................................................................33
7.     Signatures ..............................................................................................................................36
8.     Validation of the Environmental Declaration ...........................................................................37
9.     Terms .....................................................................................................................................38

                                                                                                                                  Page 2 of 38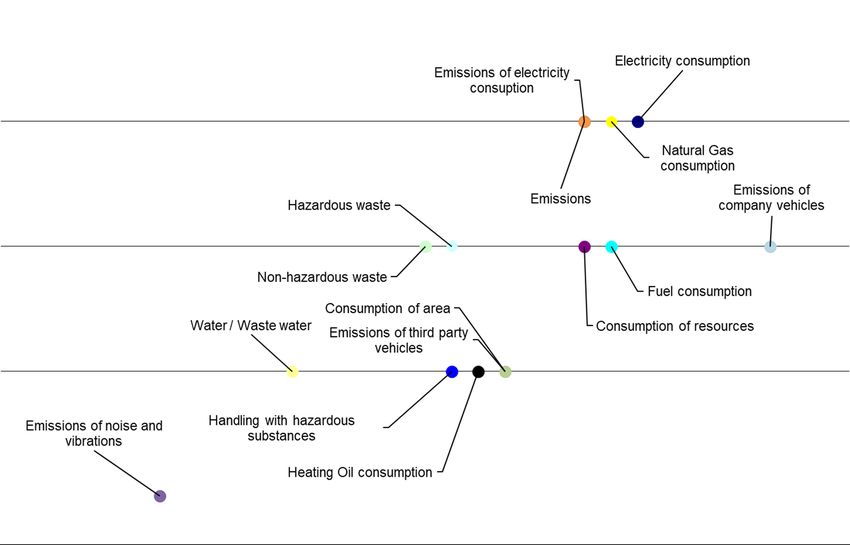
Preface

Dentsply Sirona is the world's largest manufacturer of dental products and technologies and supports
dentists and dental technicians in offering better, faster, and safer dental care.
In addition to quality assurance, employment and health protection, an executive management fo-
cused on the environment is a very important tool for Dentsply Sirona to safeguard the company's
future. The environmental management system at the Bensheim site has been certified in accord-
ance with EMAS since 1996.

EMAS stand for Eco-Management and Audit Scheme and is a European Union Regulation which is
also known as the EU eco audit. It is a common environmental management scheme for companies
that seek to improve their environmental performance, and which goes beyond the requirements of
the environmental management standard DIN EN ISO 14 001.
Sirona Dental Systems GmbH is a member of the Hessian Environmental Alliance which has the
objective to reinforce the economy’s responsibility for the benefit of the environment, the reduction
of bureaucracy and the set-up of an attractive environmental protection framework at the Hessen
business location. Participation in EMAS and membership in the Hessian Environmental Alliance are
an expression of the commitment to environmentally friendly activities and guarantee a functioning
environmental management system.
In addition, Dentsply Sirona committed to ambitious energy saving targets at its Bensheim location
by signing an environmental pact “Energy efficiency network Frankfurt Rhine-Main” with nine other
employers in the region in 2015.
With this environmental statement, Dentsply Sirona informs the interested community about envi-
ronmental protection activities at the Bensheim site. The relevant applicable Environmental Decla-
ration along with the employment protection and environmental protection certificates are available
online under:
https://corporate.dentsplysirona.com/en/about-dentsply-sirona/innovation/certifications/environ-
ment-health-safety.html
The Environmental Declaration is available to all employees via the Dentsply Sirona Community
intranet.

                                                                                         Page 3 of 38
1. Dentsply Sirona at the Bensheim site

       Treatment centers      Imaging systems       CAD/CAM systems               Instruments

Dental treatment centers (dentist chairs), imaging systems (X-ray devices), CAD/CAM systems (den-
tal equipment for computer-assisted dental reconstruction) and dental instruments are all developed
and produced at the Bensheim site.
The company premises 202,601 m² in size include the factory, office buildings and a logistics center.
The sealed area is 100,645 m². The entire natural area at the site is 2,285 m².
Bensheim is one of the largest production sites within the company’s group with approx. 2,200 em-
ployees. As a result of continuous investments and improvements the site has been sustained and
safeguarded over the long-term.
Dentsply Sirona has implemented a certified quality management system at its Bensheim site in
accordance with international regulatory requirements for medical products. This permits the com-
pany to place technologically high-quality and innovative products and services on the market.
Dentsply Sirona products can be found in all treatment areas and field of activity in modern dental
practices.
Dentsply Sirona's main headquarters are located in Charlotte, North Carolina, USA, while the inter-
national headquarters are located in Salzburg, Austria. The company's shares are listed on the US
technology exchange NASDAQ under the symbol XRAY.
Dentsply Sirona is a global team in which employees motivate each other to achieve top performance.
The company promotes these excellent achievements, lives personal responsibility and acts with
uncompromising integrity.

                                                                                         Page 4 of 38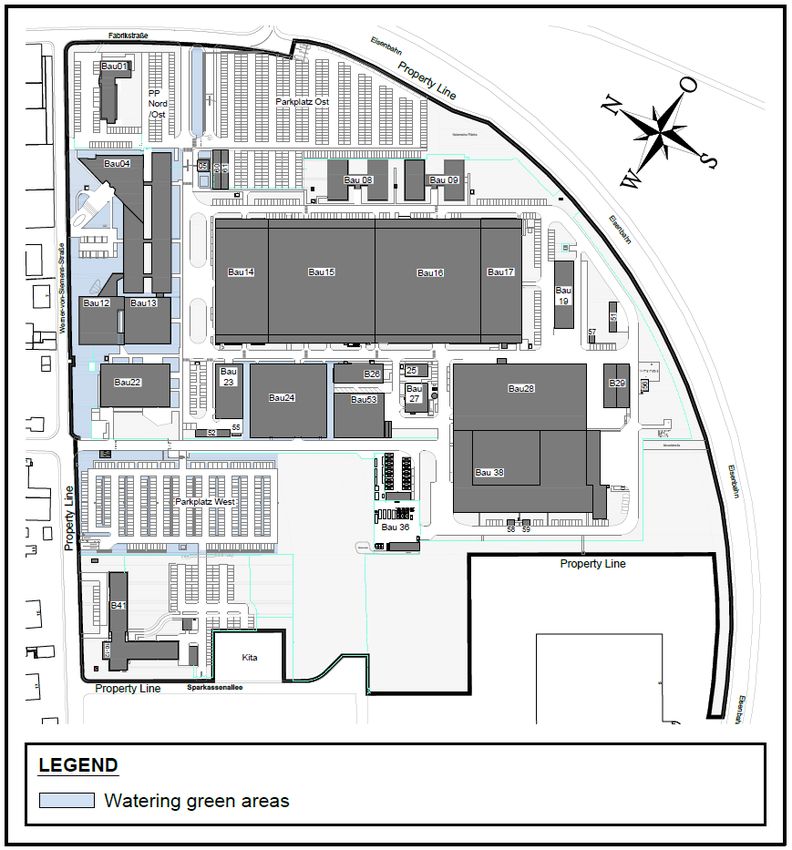
1.1 Scope of the environmental management system
The scope of the environmental management system of Dentsply Sirona is defined along the life
cycle of the products as follows:
Phases of life-cycle Environmental aspects
1 = Specification of products / purchase of raw materials
2 = Development / process-planning
Consumption of recources
Consumption of Energie
3 = Production
Hazardous substances
Consumption of area
4 = Transport / delivery
5 = Use by clients
6 = End of life and final elimination
Waste water
Emissions
Waste
Water
Noise
Phases of life-cycle
Production of raw materials and transport 2 3 1 - 1 1 1 2 -
Production of purchased parts and raw materials und supplies 2 3 1 1 - - - 1 -
1 Construction of production facilities / infrastructure 1 1 2 - - - 1 1 2
Generation of energy 3 3 1 1 - 2 2 3 -
Transport to the production facilities 2 1 2 1 - - - 2 3
Development 1 1 1 1 1 1 2 1 -
Process development / planning and procurement of production facilities 1 1 2 1 1 2 1 1 1
2 planning and procurement of infrastructure 1 1 2 - - - 1 1 2
Procurement of purchased parts and raw materials und supplies 1 2 1 2 - - 2 1 -
Life-cycle
Other transport operations (for example of waste) 1 - - 2 - - 2 1 -
Operation of production facilities 2 2 1 1 1 1 2 1 1
Inhouse transport 1 1 2 1 - - - 1 1
Entsorgung von Abfällen 2 1 1 2 - - 3 2 1
3
Disposal of waste 1 1 - 1 - - 1 - -
Operation of operational infrastructure 3 - - - 2 2 2 3 1
Storage 1 - 2 2 - - - 1 -
4 Transport 2 1 2 1 - - - 2 3
5 Use of the products 1 - - 1 1 1 1 - 1
Disposal at the end of the life cycle (product) 1 2 1 1 - - 2 1 1
6 Disposal of production facilities 1 2 2 1 - - 2 1 1
Disposal of operational infrastructure 1 2 2 2 - - 2 2 2
Relevance
- not relevant
1 low
2 middle
3 high
Scope of the EMS
Page 5 of 38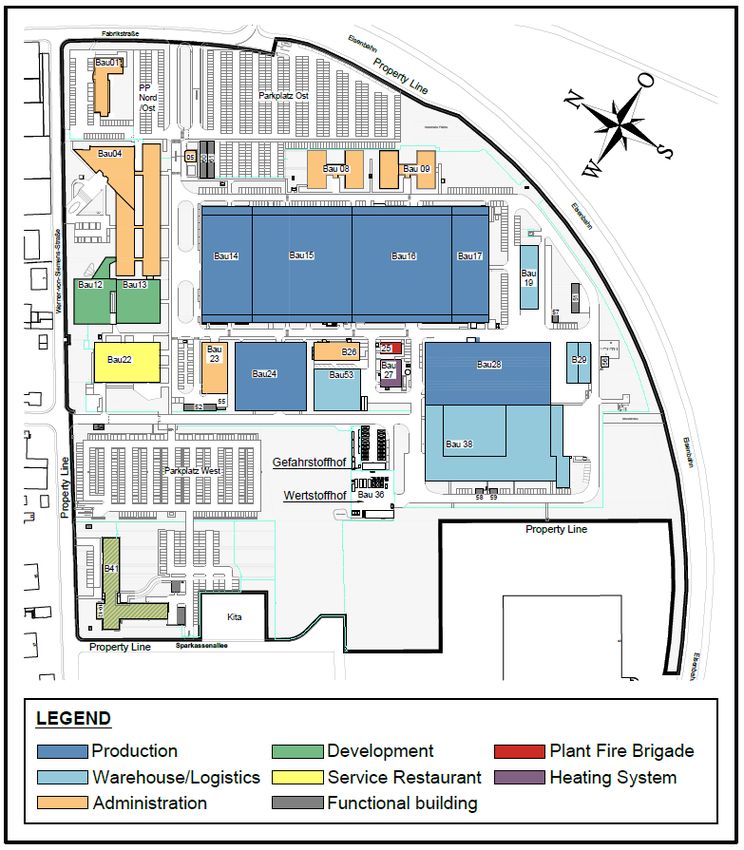
1.2 Layout of the Bensheim site
The site is located at the south industrial park in the western section of the City of Bensheim.
The linear distance to the next residential area is approx. 30 m.

                                                                                          Page 6 of 38
1.3 Structure of Dentsply Sirona at the Bensheim site
Dentsply Sirona Inc., based in Charlotte, North Carolina (USA), is the indirect parent company of the
following companies:
• Dentsply Sirona Deutschland GmbH includes the sale and distribution of dental products.
• Sirona Dental Services GmbH is the main legal entity of the companies listed below and essen-
     tially includes the Dental Academy (training center) along with further education facilities.
• Sirona Dental Systems GmbH is a subsidiary of Sirona Dental Services GmbH which comprises
     the R&D as well as the Sales Department for dental products.
• Sirona Technologie GmbH & Co. KG is a subsidiary of Sirona Dental Systems GmbH and pro-
     duces dental products on its behalf.
• Sirona Immobilien GmbH is also a subsidiary of Sirona Dental Systems GmbH.
• Sirona Verwaltungs GmbH is a subsidiary of Sirona Dental Systems GmbH and does not have
     active operations.
• Durango Bensheim GmbH & Co. KG is a subsidiary of Sirona Immobilien GmbH and was the
     owner of an administration building in Bensheim leased to other Group companies until
     28.12.2018. After the sale of this property to Sirona Immobilien GmbH, the Durango Bensheim
     GmbH & Co. KG is no longer operational.
• Durango Bensheim Verwaltungs GmbH is a subsidiary of Sirona Immobilien GmbH and does not
     have active operations.
The environmental aspects that are influenced by the operation of the environmental management
system are identified in the environmental aspect assessment.

1.4 Activities and manufacturing procedures at the Bensheim site
Activities and manufacturing proce- Environmental aspects
dures
Metal cutting and finishing,              Electricity consumption for processing machines
Parts manufacturing                       Use of substances harmful to water
                                          Use of hazardous materials
Final assembly / assembly of              Electricity consumption for lighting
subassemblies                             Production of compressed air
                                          Use of hazardous materials
Development of dental medical             Resource consumption
products                                  Material selection
Building maintenance / operation          Gas consumption for heating buildings, water,
                                          wastewater, electricity consumption for building, tech-
                                          nical facilities and lighting
Transport operations                      Traffic for material provision, transportation of goods and
                                          services
                                          Traffic volumes caused by employees
Administration                            Resource consumption

                                                                                         Page 7 of 38
2. Integrated Management

The environmental management system has been part of EH&S Management since 2017. EH&S
stands for the terms Environment, Health and Safety. The EH&S management system applies to the
companies listed in section 1.2. Within this environmental declaration, only the environment is taken
into consideration.

The EH&S-Management-Manual, processes and all work instructions are documented in the
Dentsply Sirona Community. All employees have access to this management system via the local
intranet.

                                                                                         Page 8 of 38
2.1 Executive management
Executive management's tasks are as follows:
• Securing the organization within the environmental field
• Provision of resources
• Definition of the environmental policy
• Assessment of the management system
• Approval of the environmental program
2.2 EH&S Management Officer
Executive management has appointed an EH&S Management Officer. This person is responsible
for maintaining and developing the EH&S Management System. The EH&S Management processes
are integrated into the site’s existing organizational structure.
Managing Director
Business divisions EH&S Management
Officer
The EH&S Management Officer's key tasks in environmental issues are as follows:
• Coordination and tracking all operational and product-related environmental protection activities
in accordance with the targets and actions set out in the environmental program
• Planning and leading the eco-audit
• Carrying out management reviews
• Planning internal training measures on environmental topics
• Compiling the Environmental Declaration
• Manage the documentation on the Environmental Management System
• Accepting, processing and evaluating proposed improvements from employees
2.3 Statutory officers
Next to the EH&S Management Officer the following officers stipulated by statute (by the authorities)
are also present at the Bensheim site:
• Hazardous goods officer
• Fire safety officer
• Radiation protection officer
2.4 Voluntary officers
The following officers are appointed voluntarily at the Bensheim site:
• Water protection officer
• Waste officer
Page 9 of 382.5 Employees and works council
Our integrated management system ensures that all employees and the works council cooperate in
environmental protection matters:
• Implementation of codes of conduct (work / operating instructions)
• Employee participation
• Training measures
• Suggestion system
2.6 Continuous improvement
Dentsply Sirona has undertaken to ensure continuous improvement for environmental protection at
the Bensheim site. Improvements to environmental protection are possible as part of our idea man-
agement.
• Audits
• Monitoring
• Corrective and preventive actions
• Management review
• Environmental programs
2.7 Emergencies
The Bensheim site has an emergency organization which ensures that all technical and organiza-
tional measures are implemented in the event of an emergency. The recognized factory fire service
is a crucial part of this emergency organization. Environmental accidents are some of the items
simulated and tested in fire exercises.
Emergency escape and rescue plans have been created. Fire extinguishing and evacuation exer-
cises take place regularly.
Page 10 of 382.8 Context of the organization, interested parties, risks and opportunities
The environmental, health and safety risks and opportunities are the result of the assessment of
environmental aspects, the binding obligations and the expectations of stockholders. The identified
risks and opportunities are considered of the setting of objectives and measures, emergencies as
well as the definition of operational procedures and control measures.
Opportunities can arise as a result of a situation favorable to achieving an intended result, for exam-
ple, a set of circumstances that allow the organization to attract customers, develop new products
and services, reduce waste or improve productivity. Actions to address opportunities can also include
consideration of associated risks. Risk is the effect of uncertainty and any such uncertainty can have
positive or negative effects. A positive deviation arising from a risk can provide an opportunity, but
not all positive effects of risk result in opportunities.
Theme, Environ- Interested Risks
Communication
mental status Parties Opportunities
Climate damaging Shareholders Risks: Global warming, re- How: Environmental declaration,
emissions, CO2 Executive Directors source consumption training, instruction
Employees Opportunities: Increase in the share When: On request, annually
Supervisory authority of renewable energies, savings po- Who: EH&S Management Of-
Local residents tential in consumption ficer, Supervisors
Public
Water consumption Executive Directors Risks: Reduction of groundwater How: Environmental declaration,
Wastewater Employees level, endangerment of the training, instruction
Supervisory authority wastewater treatment plant, con- When: On request, annually
Local residents sumption of resources Who: EH&S Management Of-
Public Opportunities: Savings potential in ficer, Supervisors
consumption
Waste Executive Directors Risks: Environmental damage po- How: Environmental declaration,
Employees tential, resource consumption training, instruction
Local residents Opportunities: Saving raw materials When: On request, annually
Public and resources, reducing environ- Who: EH&S Management Of-
mental hazards ficer, Supervisors
Raw materials and Executive Directors Risks: Resource consumption, envi- How: Environmental declaration,
supplies Employees ronmental and fire hazard (combus- training, instruction
Supervisory authority tible gases) When: On request, annually
Local residents
Opportunities: Saving of raw mate- Who: EH&S Management Of-
Public
rials, resources, reduction of environ- ficer, Supervisors
mental and fire hazard
Emissions of organic Supervisory authority Risks: Announcement when exceed- How: Solvent balance sheet
solvents ing the limit When: When exceeded the limit;
Opportunities: Use of solvent-free annually
cleaner, improve health protection, Who: Responsible person for the
reduce administrative work unit
Goods and services Executive Directors Risks: Emissions, traffic How: Traffic counting
Employees Opportunities: Reduction of emis- When: On request (last: 2019)
Local residents sions and traffic Who: Site Management
Public
Page 11 of 38Theme, Environ- Interested Risks
Communication
mental status Parties Opportunities
Noise Employees Risks: Hardness of hearing as an How: Instruction of Employees,
Local residents occupational disease, complaints feedback on complaints
Suppliers from local residents When: On request, annually
Contractors Opportunities: Sensitization of em- Who: Supervisors, EH&S Man-
Visitors ployees and contractors agement Officer, Executive Direc-
tors
Lighting Environmental Asso- Risks: Disruption of residents and How: Feedback on complaints
ciations fauna When: On request
Residents Opportunities: Agree with neigh- Who: EH&S Management Of-
Public bors and fauna ficer, Executive Directors
Traffic caused by Executive Directors Risks: Emissions, traffic, complaints How: Feedback on complaints
employees Employees from local residents When: On request
Local residents
Opportunities: Reduction of emis- Who: EH&S Management Of-
Public
sions and traffic, agree with neigh- ficer, Executive Directors
Supervisory authority
bors
Accidents with haz- Executive Directors Risks: Accident, environmental con- How: Report of the Dangerous
ardous substances Employees tamination Goods Officer, instruction
Supervisory authority Opportunities: Prevention of acci- When: On request, annually
Local residents dents Who: EH&S Management Of-
Public
ficer, Dangerous Goods Officer
Clients
Construction work Executive Directors Risks: Reduction of biodiversity How: Environmental declaration,
Local residents feedback to the complainant
Opportunities: Preservation of bio-
Supervisory authority
diversity When: On request, annually
Who: Executive Directors, BSM
Life cycle analysis of Executive Directors Risks: Compliance with legal re- How: Declaration of conformity
products Supervisory authority quirements, high environmental im- Assessment of relevant environ-
Clients pact potential mental aspects
Opportunities: Reduction of envi- When: At product development /
ronmental damage and emissions, modification, on request
saving of resources Who: DQA
Energy efficiency of Executive Directors Risks: Non-compliance with relevant How: Building permit
the infrastructure Supervisory authority environmental laws, resource con- When: On request
sumption
Who: Executive Directors, BSM
Opportunities: Saving resources,
reducing emissions
Behaviour of Executive Directors Risks: Emissions, traffic, potential How: Information
contractors Contractors for environmental damage, resource When: When ordering services
Supplier consumption from contractors
Opportunities: Reduction of emis- Who: Site Management
sions and traffic
Compliance with rel- Shareholders, Exec- Risks: Non-compliance with relevant How: Legal compliance audits
evant environ-mental utive Directors, Em- environmental laws When: Audits, Management-re-
laws ployees, temporary Opportunities: Good relationship view
workers, Clients, with the supervisory authority Who: Auditor, EH&S Manage-
Supervisory authority
ment Officer
Page 12 of 383. Environmental policy
The environmental policy is integrated in the EH&S policy:
Protecting the health of staff and ensuring their safety are legal obligations. Moreover, Dentsply
Sirona believes that this is the right course of action. The management's leadership and the staff's
commitment enable Dentsply Sirona to guarantee that its business processes are performed in a
safe manner. Furthermore, Dentsply Sirona continues to focus on minimizing its environmental im-
pact, wherever its business activities are carried out. It does this through efforts to support and en-
courage the reduction of material consumption and waste, to recycle materials and to save energy
and natural resources.
Our Mission
Empowering dental professionals to provide better, safer, faster dental care.
Our Vision
Delivering innovative dental solutions to improve oral health worldwide.
Our Values
Dentsply Sirona has a core set of values that we practice every day.
We are one global
team
We bring out the best We live and breathe
in our people high performance and
personal accountability
We act with We improve the prac- We demonstrate
uncompromising tice of dentistry with an passion for innovation
integrity unrelenting commit- and shape the
ment to customers dental industry
Our EH&S policy
We are well aware of our special duty to protect human health, nature and the climate. The im-
portance ascribed to the EH&S policy hinges on managers' attitudes to the environment, health and
safety. Within the scope of their responsibilities, managers can and must enforce and value safety.
To this end, they are supported by top management.
All our employees must recognize that they are themselves also responsible for environmental pro-
tection and their own health and safety.
Environmental protection, health and safety
are a joint task!
The authorities, employers' liability insurance associations, management, executives, occupational
safety experts, safety officers, the works committee and the company physician all work hand in
hand.
Page 13 of 38By setting goals for occupational safety and environmental protection, we are working continuously
to reduce pollution for both employees and the environment. Impacts on the health of staff and the
environment are assessed and taken into consideration in the earliest possible stages of planning
products, procedures and investments:
"Environmental protection and occupational safety at the right point in the prod-
uct engineering process represent a competitive advantage."
"Alongside the quality of products and economic success,
protection of the environment and human health are
equal-ranking corporate goals."
"In cases of doubt, the environment, health and safety are given priority."
We feel a sense of obligation to protect the environment and people.
We endeavor to improve our EH&S management system and EH&S performance on a continuous
basis. The requisite technical and organizational procedures are checked and developed regularly.
The system undergoes regular internal checks in the form of audits, testing and inspections.
We continually strive to bring our activities, products, services and production into line with EH&S
goals. Our suppliers, service providers and contractual partners are also involved in this process.
Our aims are to avoid work-related injuries and disease (preventatively), to create a people-friendly
working environment, to use natural resources sparingly, to reduce CO2 emissions and to save en-
ergy.
We undertake to satisfy the applicable legal requirements considering the best available technology,
occupational medicine, hygiene, the environment and proven industrial science principles. We are
committed to avoiding EH&S impacts, risks and damage even beyond those requirements, reducing
them to a minimum. Compliance with other legislation, ordinances and regulations is a matter of
course for us.
We notify interested members of the public about the company's environmental impact, our environ-
mental goals and programs as well as our environmental achievements. We provide customers with
information on how to use our products in an environmentally friendly manner.
Compliance with binding obligations is regularly assessed during reviews, hazard evaluations and
inspections. Necessary measures are implemented, and their effectiveness evaluated.
With the EH&S management manual and the EH&S management system, Dentsply Sirona guaran-
tees that its Bensheim site complies with the basic, latest principles of BG ETEM (the Employers'
Liability Insurance Association for Energy Textiles Electro and Media Production), the ILO-OSH Di-
rective, DIN EN ISO 14001 and the EMAS Regulation.
The top management ensures that the necessary means are available to realize the points listed in
the policy.
Page 14 of 384. Environmental aspects
Environmental aspects relate to those aspects of an organization's activities, products and services
which can have an impact on the environment. A distinction is made between direct and indirect
environmental aspects.
Emergency
Production*) Product*)
Environmental Environmental case*)
aspects effects direct signifi- direct signifi- direct signifi-
indirect cant indirect cant indirect cant
Global warming,
Electricity consumption direct yes indirect no n/a n/a
consumption of resources
Global warming,
Natural Gas consumption direct yes n/a n/a n/a n/a
consumption of resources
Global warming,
Heating Oil consumption direct yes n/a n/a n/a n/a
consumption of resources
Global warming,
Fuel consumption direct yes n/a n/a n/a n/a
consumption of resources
Environmental impairment,
Consumption of resources direct yes n/a n/a n/a n/a
consumption of resources
Loss of biodiversity,
Consumption of area direct yes n/a n/a n/a n/a
Sealing of surfaces
Handling with hazardous
substances Environmental damage direct yes indirect yes direct yes
Environmental impairment,
Hazardous waste direct yes indirect yes direct yes
consumption of resources
Environmental impairment,
Non- hazardous waste direct no indirect no direct yes
consumption of resources
Consumption of resources,
Water / wastewater direct yes indirect yes direct yes
wastewater
Generation of ozone, pollu-
Emissions direct yes n/a n/a direct yes
tion of the local environment
Emissions of electricity con- Global warming,
indirect yes n/a n/a n/a n/a
sumption consumption of resources
Emissions of company vehi-
Traffic, emissions, fine dust direct yes n/a n/a n/a n/a
cles
Emissions of other vehicles Traffic, emissions, fine dust indirect no n/a n/a n/a n/a
Emissions of noise Disruption of the neighbors,
direct yes indirect yes direct yes
and vibrations noise, hardness of hearing
*) Production: Environmental aspects from the production of products and services
Products: Environmental aspects through the products (use / disposal)
Emergency situations: Environmental aspects as a consequence of non-stipulated conditions / emergency situations
n/a = not applicable or out of scope
Page 15 of 38Direct environmental aspects can be controlled and influenced by the organization. By contrast, in-
direct environmental aspects cannot be controlled or influenced to their full extent by the organization.
Dentsply Sirona has determined all significant environmental aspects and categorized them accord-
ing to the following criteria (see table above):
• Environmental aspects of manufacturing products and services
• Environmental aspects through the products (use / disposal)
• Environmental aspects as a result of undetermined conditions and emergency situations.
4.1 Evaluation of the environmental aspects
Environmental aspects are assessed by the organization for environmental hazards and potential
for improvement in order to define environmental protection targets and programs. The hazard po-
tential is calculated by a mathematical process based on the pollution on the local, regional and
global environment, as well as the significance, quantity and costs involved. The company has set
limits that imply a need for action. The aspects shown in the following diagrams in the red shaded
area form the basis for potential environmental objectives and programmes.
4.1.1 Environmental aspects from the production of products and services
Room for improvement
Significance of environmental aspects
Page 16 of 384.1.2 Environmental aspects through the products (use / disposal)
Room for improvement
Significance of environmental aspects
4.1.3 Environmental aspects as a consequence of non-stipulated conditions / emer-
gency situations
Room for improvement
Significance of environmental aspects
Page 17 of 385. Environmental targets and programs
Environmental targets and programs are initiated on the basis of potential for improvement and the
importance of environmental aspects. The management is responsible for fulfilling the environmental
targets and programs. Implementation of the programs is monitored by the EH&S-Management-
Officer.
The implementation status is documented as follows:
●●● = objective achieved
●●○ = ongoing process / implementation on schedule
●○○ = objective predominantly achieved
○○○ = objective not achieved or abandoned
5.1 Environmental targets and programs 2017 - 2019
The environmental programme 2017 - 2019 has been completed. The following is an overview of
the environmental goals and the status of goal achievement.
Climate protection ●●●
Environmental Procurement of electricity from renewable sources. The Bensheim site has com-
target: mitted itself to a renewable electricity share of more than 40% for the next three
years. The aim is to support the national initiatives to increase the proportion of
regenerative electricity.
(German target value 40% - 45% by 2025).
Risks: Intensification of the greenhouse effect
Opportunities: Reduction of emissions, cost savings, sustainability
Actions: Consideration of the target value when purchasing electricity.
Responsible: Purchasing
Date: Ongoing
Status: Share 2017: 47.5%
Share 2018: 53.3%
Share 2019: 55.7%
Climate protection ●●●
Environmental Electricity savings of 204 MWh/year and reduction of CO2 emissions by 90 t/year
target: by optimizing the circulating cooling water system.
Risks: Intensification of the greenhouse effect
Opportunities: Reduction of emissions, cost savings, sustainability
Actions: Optimization of the closed-circuit cooling system.
Responsible: Site Management
Date: 2017
Status: Target achieved, completed
Page 18 of 38Consumption of resources ●●●
Environmental Reduction of printed pages by 10% by 2019 (excluding DSD).
target: (Reference value: In calendar year 2015: 3,496 sheets / employees)
Risks: Toner emissions, noise, resource consumption
Opportunities: Saving energy and resources, reducing emissions
Actions: Change of the standard printer setting at the user to duplex function.
Responsible: IT
Date: 2016
Status: 2017: 2.870 sheets; -17.9%
2018: 2.775 sheets; -20.6%
2019: 2.459 sheets; -29.7%
Waste prevention ●●●
Environmental The quantity of washing liquid to be disposed of waste code 12 03 01* should not
target: exceed the absolute value of 2015.
(Reference value: In calendar year 2015: 91.8 t)
Risks: Pollution
Opportunities: Saving energy and resources, reducing waste
Actions: Put the gasoline/oil separator (MA 28012051) back into operation.
Trial introduction and collection of washing liquid. Analysis to check the discharge
limits.
Operational conversion of the process of introduction and conversion.
Responsible: Site Management / Production
Date: 2016 / 2017
Status: 2017: 77.9 t
2018: 16.4 t
2019: 25.8 t
Page 19 of 385.2 Environmental targets and programs 2020 - 2022
Dentsply Sirona sets targets for reducing CO2 emissions at its Bensheim site.
Climate protection ●●○
Environmental Procurement of electricity from renewable sources. The Bensheim site has com-
target: mitted itself to a renewable electricity share of more than 45% for the next three
years. The aim is to support the national initiatives to increase the proportion of
regenerative electricity.
(German target value 40% - 45% by 2025).
Risks: Intensification of the greenhouse effect
Opportunities: Reduction of emissions, cost savings, sustainability
Actions: Consideration of the target value when purchasing electricity
Responsible: Purchasing
Date: Ongoing
Status: Open
Climate protection ○○○
Environmental Electricity savings of 436 MWh/year and reduction of CO2 emissions by 141 t/year
target: when operating the production machines.
This corresponds to a reduction in energy consumption during non-production
times (weekends, holidays and plant closures) of approx. 19%.
Risks: Intensification of the greenhouse effect
Opportunities: Reduction of emissions, cost savings, sustainability
Actions: Installation of the lowering mode for large production machines
Responsible: Site Management / Production
Date: Until 31th of December 2022
Status: Open
Climate protection ○○○
Environmental Electricity savings of 411 MWh/year and reduction of CO2 emissions by 133 t/year
target: by converting the lighting in production hall 14.
Reference value 2019: 549 MWh (reduction by approx. 75%)
Risks: Intensification of the greenhouse effect
Opportunities: Reduction of emissions, cost savings, sustainability
Actions: Conversion of the lighting to LED lighting with intelligent control
Responsible: Site Management
Date: Until 31th of December 2022
Status: Open
Page 20 of 38Climate protection ○○○
Environmental Electricity savings of 12 MWh/year and reduction of CO2 emissions by 4 t/year
target: through the conversion of the hot water supply in the changing rooms in Building
14 East and Building 14 West.
Reference value 2019: 16 MWh (reduction by approx. 75%)
Risks: Intensification of the greenhouse effect
Opportunities: Reduction of emissions, cost savings, sustainability
Actions: Conversion of hot water preparation to heat pump technology
Responsible: Site Management
Date: Until 31th of December 2022
Status: Open
Climate protection ○○○
Environmental Electricity savings of 90 MWh/year and reduction of CO2 emissions by 29 t/year
target: by optimizing compressed air consumption.
In calendar year Q2/2020, the electricity savings will be verified more precisely
(installation of measurement technology).
Risks: Intensification of the greenhouse effect
Opportunities: Reduction of emissions, cost savings, sustainability
Actions: Minimization of leakages. Optimization of compressor operation
Responsible: Site Management
Date: Until 31th of December 2022
Status: Open
Climate protection ○○○
Environmental Saving heating energy
target:
Risks: Intensification of the greenhouse effect
Opportunities: Reduction of emissions, cost savings, sustainability
Actions: Replacement of the shed roof glazing in the production hall building 16.
Heat transfer coefficient of the old glazing: 5.83 W/(m²K)
Heat transfer coefficient of the new glazing: 1.20 W/(m²K)
Responsible: Site Management
Date: Until 31th of December 2022
Status: Open
Page 21 of 38Further environmental targets are:
Climate protection ○○○
Environmental Improvement of energy monitoring
target:
Risks: Intensification of the greenhouse effect
Opportunities: Reduction of emissions, cost savings, sustainability
Actions: Expansion of the energy monitoring and building control system
Responsible: Site Management
Date: Until 31th of December 2022
Status: Open
Climate protection ○○○
Environmental Improvement of monitoring in the area of fleet management
target:
Risks: Intensification of the greenhouse effect
Opportunities: Reduction of emissions, cost savings, sustainability
Actions: Procurement of an evaluation tool to determine the fuel consumption and mileage
of company vehicles
Responsible: Site Management
Date: Until 31th of December 2022
Status: Open
Saving resources ○○○
Environmental Water saving in the sanitary rooms
target:
Risks: Resource consumption
Opportunities: Savings in raw materials, cost savings, sustainability
Actions: Conversion of the wash basin fittings to water-saving aerator controls
Responsible: Site Management
Date: Until 31th of December 2022
Status: Open
Page 22 of 38Saving resources ○○○
Environmental Substitution of crude oil as cooling lubricant in production to GTL oil.
target: Exchange volume: 39 m³
Risks: Resource consumption
Opportunities: Saving raw materials, reducing emissions, saving costs, sustainability, skin and
fire protection
Actions: Conversion from petroleum-based cooling lubricants in metal-cutting production
to cooling lubricants based on natural gas (GTL Gas to Liquid) produced during
petroleum extraction.
GTL oil is free of mineral oil, which is produced from waste products during oil
extraction. GTL oil is free of aromatics, nitrogen, heavy metals, sulfur, zinc and
chlorine compounds. In addition, GTL oil is expected to have a significantly longer
service life.
GTL oil also has fewer skin-damaging properties. The high flame point has a pos-
itive effect on fire protection for cooling lubricants that are not mixed with water.
Responsible: Site Management
Date: Until 31th of December 2022
Status: Open
Page 23 of 386. Important environmental dates and figures
The environmentally relevant data and figures presented below are put in relation to the number of
employees at the Bensheim site. Since 2017, the number of employees has increased significantly
(+30%). The following table shows the number of employees and also the development of the gross
floor area.
Year 2016 2017 2018 2019
Number of employees at the Bensheim site 1,637 1,693 2,027 2,197
Gross floor area at the Bensheim site [m²] 79,025 81,560 89,096 89,096
In 2019 numerous construction measures were realized:
• Work on the former bank building was completed
• In Building 14 all locker rooms and showers were renovated
• The control and regulation of the central heat generation were modernized
• A pressure maintenance system was installed in the district heating network
• Computer center 1 in Building 26 was rebuilt and extended
• The Dental Academy was renovated
• An EMC laboratory was set up in Building 13
• A climatic chamber for x-ray equipment was built in Building12 and the 3rd floor was converted
for the customer service center
• The sanitary rooms in the 1st floor of Building 14 and Building 15 were dismantled
6.1 Generation of energy, energy flow and energy consumption
The used energy sources are electricity, natural gas, light fuel oil, diesel and petrol. Natural gas is
used for heating; light fuel oil is only used in emergencies when an adequate supply of natural gas
is not possible or to operate the emergency power generators. The prescribed monthly test runs of
the emergency power generators cause a fuel oil consumption of approx. 1.8 m³/year. In relation to
the total energy consumption this is negligible (share < 1‰). Diesel and petrol are used as fuels for
company vehicles.
6.1.1 Energy, total consumption
Year 2016 2017 2018 2019
Natural gas [MWh] 6,535 6,179 5,912 6,215
Electricity [MWh] 12,873 13,112 13,459 13,146
Fuels for company vehicles [MWh] -* -* -* 7,625
Energy, total consumption [MWh] 19,408 19,291 19,371 26,986
Energy, total consumption [MWh] / employee 11.86 11.39 9.56 12.28
*No data on fuel consumption is available.
The significant increase in total energy consumption by almost 40% between 2018 and 2019 results
from the fact that from 2019 onwards the fuel consumption of company vehicles will be considered.
Employee-related energy consumption increased by 28.5% for the same reason. Excluding fuel con-
sumption, energy consumption at the site remained almost constant between 2018 and 2019
(-0.05%), and employee-related energy consumption fell by 7.8% during this period.
Page 24 of 38Energy consumption
30000
25000
20000
MWh
15000
10000
5000
0
2016 2017 2018 2019
Natural gas Electricity Fuels for company vehicles Total amount of energy
6.1.2 Generation of energy
On the roof of building 41 a photovoltaic system with an area of 240 m² and a capacity of 29.4 kWp
is installed. The photovoltaic system was taken over in July 2018 by Dentsply Sirona.
Year 2016 2017 2018 2019
Generation of energy (photovoltaic system) [kWh] - - 13,500 33,652
6.1.3 Energy flow
The percentage energy distribution of the location is stated below:
Page 25 of 386.1.4 Electricity consumption
Year 2016 2017 2018 2019
Electricity consumption [MWh] 12,873 13,112 13,459 13,146
Electricity consumption [MWh / employee] 7.86 7.74 6.64 5.98
Proportion of renewable energies [%] 46.5 47.5 53.3 55.7
CO2 Emissions [g/kWh] 409 371 319 323
Electricity consumption
14000 10
9
12000
8
MWh / employee
10000 7
6
MWh
8000
5
6000 4
4000 3
2
2000
1
0 0
2016 2017 2018 2019
Electricity consumption [MWh] Electricity consumption [MWh / employee]
Electricity consumption has recently fallen by 2.3% between 2018 and 2019. Electricity consumption
in relation to the number of employees fell significantly by 9.9% in the same period. The percentage
electricity distribution of the location can be allocated to consumers as follows:
Page 26 of 386.1.5 Natural gas consumption
Year 2016 2017 2018 2019
Natural gas consumption [MWh] 6,535 6,179 5,912 6,215
Natural gas consumption weather-adjusted [MWh] 6,430 6,254 6,569 6,504
Natural gas [MWh / employee] 3.99 3.65 2.92 2.83
Natural gas weather-adjusted [MWh/ employee] 3.93 3.69 3.24 2.96
Natural gas [kWh / m² gross floor area (GFA)] 82.69 75.76 66.35 69.75
Natural gas weather-adjusted [kWh / m² GFA] 81.37 76.68 73.73 73.00
Natural gas consumption
7000 5
6000
4
MWh / employee
5000
4000 3
MWh
3000 2
2000
1
1000
0 0
2016 2017 2018 2019
Natural gas consumption [MWh] Natural gas [MWh / employee]
Natural gas consumption, weather adjusted
7000 5
6000
4
MWh / employee
5000
3
MWh
4000
3000 2
2000
1
1000
0 0
2016 2017 2018 2019
Natural gas consumption [MWh] Natural gas [MWh / employee]
Gas consumption rose in absolute terms between 2018 and 2019 (5.1%), weather-adjusted it fell
slightly (-1.0%). In terms of employees, natural gas consumption fell by 3.0%; weather-adjusted it
even fell by 8.6%.
Page 27 of 386.1.6 Fuel consumption by company vehicles
Year 2016 2017 2018 2019
Number of company vehicles - - - 374
Average fuel consumption [l/100 km] - - - 4.88
Total fuel consumption [l] - - - 789,136
Ø annual mileage / vehicle [km] - - - 43,334
6.1.7 Water consumption / wastewater volumes
Dentsply SIRONA at the Bensheim site obtains its water from the public mains of the City of Bens-
heim. Water is used primarily as drinking water, for sanitary purposes for employees (wastewater),
for watering the green areas, in the production areas and for carrying our construction measures.
Aside from a 300 m³ water tank for supplying the sprinkler system (fire protection) there is also a
well for extinguishing water available on the company premises. The largest quantity of extinguishing
water required is drawn from the City mains as needed.
Year 2016 2017 2018 2019
Water consumption [m³] 18,743 19,574 22,517 21,298
Water consumption in m³ per employee 11.45 11.56 11.11 9.69
Fluctuations in water consumption are essentially caused by volumes needed for watering the green
areas, the number of employees at the site and ongoing construction measures.
Water consumption
24000 16
20000 14
Water consumption [m³]
Water consumption
12
per employee [m³]
16000 10
12000 8
8000 6
4
4000 2
0 0
2016 2017 2018 2019
Water consumption [m³] Water consumption per employee [m³]
Page 28 of 38Irrigation share of water consumption
3500
3000
2500
2000
m³
1500
1000
500
0
consumption without watering 2017 watering 2017
consumption without watering 2018 watering 2018
consumption without watering 2019 watering 2019
All sanitary wastewater along with the wastewater from draining the roads and parking lots goes to
the sewerage system. The wastewater accumulated from the canteen is routed via a fat separator,
oil-containing wash water is routed via gasoline/oil separator to the sewerage system. The relevant
regulations are complied with.
Page 29 of 386.2 Raw materials and supplies
Minimizing material consumption while fulfilling customer requests at the same time is an important
objective. Aside from the positive environmental impact this also has favorable economic effects, as
costs are generally reduced at the same time.
Material in the production process (in tons) 2016 2017 2018 2019
(not including pre-assembled components/trade goods)
Metals Tons per year
Aluminum 4.96 5.79 6.90 6.63
Brass 19.36 11.68 17.30 14.63
Steel 64.80 76.22 85.30 84.69
Titanium 2.69 2.12 2.20 2.03
Auxiliary materials and supplies Tons per year
Oil-based cooling lubricants (cutting oil) 13.95 17.77 23.74 25.67
Water-miscible cooling lubricant (emulsion) 1.46 1.45 1.74 1.58
Transformer oil* 28.60 29.04 18.61 28.77
Other oils 4.33 3.27 4.18 3.37
Solvents 4.39 4.13 4.03 3.17
Technical gases Tons per year
Argon 22.47 7.50 15.70 11.89
Nitrogen 9.04 7.29 6.60 6.50
Hydrogen 1.42 1.42 1.47 1.42
Total 177.47 167.68 187.77 190.35
Material usage [tons per employee] 0.11 0.10 0.09 0.09
* Only used as a thermal oil for sealing x-ray tube assemblies
Paper consumption (sheets per year) 2016 2017 2018 2019
printed pages 5,027,250 4,858,250 4,695,750 4,226,600
Number of employees at the Bensheim site* 1,637 1,693 1,692 1,719
Material consumption [sheet / employee] 3,071 2,870 2,775 2,459
* Employees of the Dentsply Sirona Deutschland GmbH are not included.
6.3 Hazardous materials and substances harmful to water
All hazardous materials are recorded in a Hazardous Materials Directory. The controlled introduction
of hazardous materials is regulated by a release and approval process. The Bensheim site is a
specialized company in accordance with the requirements under the German Water Management
Act. The processes for handling substances harmful to water are governed in work and operating
instructions. The entrepreneurial obligations for which the managers are responsible in this context
are assigned to them in writing.
Page 30 of 386.4 Emissions
6.4.1 Calculation of emissions for the heating system
Year 2016 2017 2018 2019
CO [t] 0.92 0.80 0.77 0.81
CO2 [t] 1,520 1,438 1,375 1,446
CO2 weather adjusted [t] 1,496 1,455 1,528 1,513
NOX [t] 1.31 1.24 1.18 1.24
SO2 [t] 0.09 0.09 0.08 0.09
Fine dust [t] 0.04 0.03 0.03 0.03
CO2 [t / employee] 0.93 0.85 0.68 0.66
CO2 weather adjusted [t / employee] 0.91 0.86 0.75 0.69
CO2 emission from the heating system rose by 5.1% between 2018 and 2019. Adjusted for weather
conditions, it fells by 1.0% in the same period. In relation to the number of employees, CO2 emission
from the heating system fell between 2018 and 2019 by 3.0% (weather adjusted by 8.7%).
6.4.2 Calculation of CO2 emissions from electricity generation
The emissions from electricity consumption are accumulated at the energy supply company's rele-
vant power plant. The CO2 ratios stated below were calculated for our site.
Year 2016 2017 2018 2019
CO2 [t] 5,265 4,864 4,293 4,246
CO2 [t / employee] 3.22 2.87 2.12 1.93
In relation to the number of employees, CO2 emissions from power generation fell by 8.8% between
2018 and 2019.
6.4.3 Calculation of CO2 emissions from company vehicles
Year 2016 2017 2018 2019
Ø CO2 / vehicle [g/km]* - - - 159
CO2 [t] - - - 2,574
*CO2 emission was calculated using WLTP value
6.4.4 Total CO2 emissions (heating, electricity, company cars)
Year 2016 2017 2018 2019
CO2 total [t] 6,785 6,302 5,669 8,266
CO2 total weather adjusted [t] 6,854 6,360 5,748 8,333
CO2 total [t / employee] 4.14 3.72 2.80 3.76
CO2 total weather adjusted [t / employee] 4.19 3.76 2.84 3.79
Page 31 of 38Total CO2 emissions rose by 45.8% between 2018 and 2019 (43.1% when adjusted for weather
conditions). This is due to the fact that CO2 emissions from company vehicles were only included in
total emissions from 2019 onwards. Excluding company vehicles, CO2 emissions have fallen by 0.4%
(1.1% when adjusted for weather conditions).
In relation to the number of employees, CO2 emissions rose by 34.5% (32.1% when adjusted for
weather conditions) between 2018 and 2019. Excluding CO2 emissions from company vehicles, CO2
emissions have fallen by 7.4% (8.7% when adjusted for weather conditions).
CO2 emissions
9000
8000
7000
6000
CO2 [t]
5000
4000
3000
2000
1000
0
2016 2017 2018 2019
CO2 total
CO2 total, weather adjusted
CO2 total without vehicles
CO2 total without vehicles, weather adjusted
CO2 emssions in relation to employees
5
4
CO2 / employees [t]
3
2
1
0
2016 2017 2018 2019
CO2 total [t / employee]
CO2 total, weather adjusted [t / employee]
CO2 without vehicles [t / employee]
CO2 without vehicles, weather adjusted [t / employee]
Page 32 of 386.4.5 Noise emissions
The noise emissions into neighboring residential areas are well below official requirements. Noise
emissions only arise at the company premises from:
• Intra-company traffic from battery-operated ground conveyors and stackers
• Ventilation systems
• Trucks (deliveries and removals)
• Employee traffic
6.4.6 Emissions of volatile organic compounds
Sirona Dental Systems GmbH and Sirona Technologie GmbH & Co. KG operate cleaning and de-
greasing systems using solvents. Slightly volatile organic solvents are in use. No solvents are used
at the site based on fully fluorinated hydrocarbons or that feature carcinogenic, mutagenic or repro-
toxic properties.
Company Solvent consumption 2019
Sirona Technologie GmbH & Co. KG 2,244 kg / year
Sirona Dental Systems GmbH 634 kg / year
Total 2,878 kg / year
The systems at Sirona Technologie GmbH & Co. KG have been reported to the supervisory authority
in accordance with 31. Federal Immission Protection Act. A solvent log report must be prepared for
these systems. This log report states that the emissions of slightly volatile organic solvents amount
to 0.07%. The permissible limit is 20%.
6.4.7 Emissions from greenhouse gases
Emissions of the greenhouse gases N2O, NF3, CH4, H-FKW, FKW, PFC, and SF6 are not assessed
as relevant. Refrigeration systems in place at the Bensheim site are operated using a closed cooling
circuit. The refrigeration systems are checked for tightness regularly in accordance with the statutory
regulations.
6.5 On-site Waste
A distinction is made between hazardous and non-hazardous waste. These are in turn classified in
each case as waste for recycling and waste for disposal. Separation of waste is continuously moni-
tored in order to achieve a high recycling rate for the waste.
Electrical devices of customers are not included in the following overviews. The operating instruc-
tions provide the customer with the information required for the disposal of old equipment. The return
and recycling are carried out by a contractor.
Page 33 of 38Statistics on waste quantities
Year 2016 2017 2018 2019
Total waste quantity [t] 2,519 2,066 1,814 1,658
Hazardous waste [t] 211 282 221 178
Non-hazardous waste [t] 2,308 1,785 1,593 1,480
Hazardous waste [t / employee] 0.13 0.17 0.11 0.08
Waste for recycling [t] 2,434 1,969 1,769 1,621
Waste for disposal [t] 85 97 45 38
Recycling rate 96.6% 95.3% 97.5% 97.7%
Adjusted statistics on waste quantities*
Year 2016 2017 2018 2019
Total waste quantity [t] 1,036 1,052 1,019 950
Hazardous waste [t] 183 191 143 136
Non-hazardous waste [t] 852 861 876 813
Hazardous waste [t / employee] 0.11 0.11 0.07 0.06
Waste for recycling [t] 954 969 998 920
Waste for disposal [t] 82 83 21 30
Recycling rate 92.1% 92.1% 98.0% 96.9%
*without construction activities, company canteen, landscape conservation policy, occupational doctor service
Recycling rate* 2019
Waste for recycling Waste for disposal
Page 34 of 38Statistics on waste quantities (total quantities)
3000 2,00
1,80
2500 1,60
[t / employee]
2000 1,40
1,20
[t]
1500 1,00
0,80
1000 0,60
500 0,40
0,20
0 0,00
2016 2017 2018 2019
Waste for recycling [t] Waste for disposal [t] Total waste quantity [t / employee]
Statistics on waste quantities (adjusted)
3000 2,00
1,80
2500 1,60
[t / employee]
2000 1,40
1,20
[t]
1500 1,00
0,80
1000 0,60
500 0,40
0,20
0 0,00
2016 2017 2018 2019
Waste for recycling [t] Waste for disposal [t] Total waste quantity [t / employee]
The fluctuations in waste quantities are mainly due to construction activities. The volume of waste
excluding construction activities, company restaurant, landscaping and occupational health service
fell by 6.8% between 2018 and 2019. The recycling rate has remained over 90% in recent years.
Page 35 of 38ll Dentsolv-
5 Sirono
7. Signatures
Dentsply Sirona carries out an annual eco-audit at the Bensheim site.
The results are used in the Environmental Declaration.
The Environmental Declaration is submitted to a certified environmental expert for validation
each year.
m, Fe 19,2020
;,v
M Thorsten Schröder
Manag EH&S Management Officer
;.v.
Arjan Roy Thorsten Schröder
(Executive Management2) EH&S Management Officer
1
For the legal entities listed below: Sirona Dental Services GmbH
Sirona Dental Systems GmbH
Sirona Technologie GmbH & Co. KG
Sirona lmmobilien GmbH
Sirona Venivaltungs GmbH
Durango Bensheim GmbH & Co. KG
Durango Bensheim Verwaltungs GmbH
2 For the legal entities listed below: Dentsply Sirona Deutschland GmbH
The EH&S Management Officer
Thorsten Schröder
Fabrikstraße 31
64625 Bensheim
Tel.: +a9 (0)6251 16-2288
E-mail : Thorsten. Sch roeder@dentsplysirona.com
is your contact.
Page 36 of 38\D' Sirono
Dentsply
8. Validation of the Environmental Declaration
The Environmental Expert Mr. Frank Meckel
Hansastraße 3
35764 Sinn
Certification no: DE-V-0235
hereby confirms that the organization Dentsply Sirona at the Bensheim site, consisting of
Dentsply Sirona Deutschland GmbH
Sirona Dental Services GmbH
Sirona Dental Systems GmbH
Sirona Technologie GmbH & Co. KG
Sirona lmmobilien GmbH
Sirona Venrualtungs GmbH
Durango Bensheim GmbH & Co. KG
Durango Bensheim Verwaltungs GmbH
Fabrikstraße 31
64625 Bensheim
fulfills all of the requirements of Regulation (EC) No 122112009 of the European Parliament and of
the Council of November 25,2009 on the voluntary participation by organizations in a Community
eco-management and audit scheme (EMAS) and Regulation (EU) No 201711505 amending Annexes
l, ll and lll to Regulation (EC) No 122112009 of Augustz9,2017 and Regulation (EU) No 201812026
amending Annexes lV to Regulation (EC) No 122112009 of December 19, 201 8.
The signing of this Declaration is a confirmation that
1. the expert evaluation and validation have been completed in full compliance with the require-
ments of Regulation (EC) No 122112009,
2. the results of the expert evaluation and validation confirm that there is no evidence of a failure to
comply with the applicable environmental regulations,
3. the sates and statements in the Environmental Declaration for the site provide a reliable, credible,
and truthful picture of all of the organization's activities within the area stated in the Environmental
Declaration.
The Environmental Declaration is declared to be valid
***
\e
_J\,
l-{ l^l
Bensheim, February 19, 2020
EMAS VERIFIED
ENVIRONHENTAL
HANAGEMENT
DE-115-00m3
Meckel
The next consolidated Environmental Decl will be submitted for validation in February 2023.
An updated environmental declaration be prepared and validated in 2021 and 2022.
Page 37 of 38You can also read