Shape induced segregation and anomalous particle transport under spherical confinement
←
→
Page content transcription
If your browser does not render page correctly, please read the page content below
Shape induced segregation and anomalous particle transport under
                                                spherical confinement
                                                            Abhinendra Singh,1, 2, a) Jiyuan Li,1, a) Xikai Jiang,3, 1 Juan P. Hernández-Ortiz,4, 5 Heinrich M. Jaeger,2, 6 and
                                                            Juan J. de Pablo1, 7
                                                            1) Pritzker School of Molecular Engineering, University of Chicago, Chicago, Illinois 60637,
                                                            USA
                                                            2) James Franck Institute, University of Chicago, Chicago, Illinois 60637, USA
                                                            3) State Key Laboratory of Nonlinear Mechanics, Institute of Mechanics, Chinese Academy of Sciences, Beijing 100190,
                                                            China
                                                            4) Department of Materials and Nanotechnology, Universidad Nacional de Colombia–Medellín, Medellín, Colombia,
                                                            050034
                                                            5) Colombia/Wisconsin One-Health Consortium, Universidad Nacional de Colombia–Medellín, Medellín, Colombia,
                                                            050034b)
arXiv:2002.01880v1 [cond-mat.soft] 5 Feb 2020

                                                            6) Department of Physics, The University of Chicago, Chicago, Illinois 60637, USA
                                                            7) Materials Science Division, Argonne National Laboratory, Lemont, Illinois 60439, USAc)

                                                            (Dated: 6 February 2020)
                                                            Colloid or nanoparticle mobility under confinement is of central importance to a wide range of physical and biological
                                                            processes. Here, we introduce a minimal model of particles in a hydrodynamic continuum to examine how particle
                                                            shape and concentration affect the transport of particles in spherical confinement. Specifically, an immersed boundary–
                                                            General geometry Ewald-like approach is adopted to simulate the dynamics of spheres and cylinders under the influence
                                                            of short- and long-range fluctuating hydrodynamic interactions with appropriate non-slip conditions at the confining
                                                            walls. An efficient O(N) parallel finite element algorithm is used, thereby allowing simulations at high concentrations,
                                                            while a Chebyshev polynomial approximation is implemented in order to satisfy the fluctuation–dissipation theorem. A
                                                            concentration–dependent anomalous diffusion is observed for suspended particles. It is found that introducing cylinders
                                                            in a background of spheres, i.e. particles with a simple degree of anisotropy, has a pronounced influence on the structure
                                                            and dynamics of the particles. First, increasing the fraction of cylinders induces a particle segregation effect, where
                                                            spheres are pushed towards the wall and cylinders remain near the center of the cavity. This segregation leads to a lower
                                                            mobility for the spheres relative to that encountered in a system of pure spheres at the same volume fraction. Second,
                                                            the diffusive-to-anomalous transition and the degree of anomaly – quantified by the power law exponent in the mean
                                                            square displacement vs. time relation – both increase as the fraction of cylinders becomes larger. These findings are of
                                                            relevance for studies of diffusion in the cytoplasm, where proteins exhibit a distribution of size and shapes that could
                                                            lead to some of the effects identified in the simulations reported here.

                                                I.   INTRODUCTION                                                       evidence of hindered diffusion, in agreement with experimen-
                                                                                                                        tal results. Majority of previous studies, however, have failed
                                                   Colloidal and nanoparticle diffusion in confined environ-            to consider hydrodynamic interactions between particles or
                                                ments arises in a wide range of scientific and engineering              between particles and the confining walls. Some exceptions
                                                systems, including living cells, mesoporous materials, or mi-           are provided by the work of Ando et al.20 and Chow et al.21 ,
                                                crofluidic devices 1–5 . It is also of interest for energy gen-         who included hydrodynamic interactions between particles,
                                                eration processes that rely on salinity or electrostatic gradi-         but did not enforce the no-slip boundary condition at the
                                                ents in pores6–9 . In the particular case of the cytoplasm, the         walls. More recently, Stokesian dynamics (SD) simulations
                                                diffusion of biomolecules underpins a variety of intracellular          of spheres by Aponte-Rivera et al.22,23 considered both far–
                                                metabolic, translational and locomotion processes, to name a            and near–field (lubrication) hydrodynamic interactions (HI)
                                                few.10–14 . Interestingly, particle diffusion in these confined         between particles and walls. The authors demonstrated that
                                                systems is often found to be severely hindered and anoma-               HI have a pronounced influence on the local structure and the
                                                lous15–17 . The mechanisms behind those observations, how-              short–time and long–time diffusive behavior of particle sus-
                                                ever, remain poorly understood.                                         pensions. The framework employed by these authors relied
                                                   Several literature studies have examined particle mobility in        on SD, and was restricted to a homogeneous system of spher-
                                                living cells18,19 by relying on Brownian dynamics (BD) simu-            ical particles23 .
                                                lations. In such studies, biological macromolecules have been              Recently, we have introduced an efficient computational
                                                represented as spheres, and numerical simulations have found            approach in order to overcome some of the limitations of
                                                                                                                        other available numerical approaches for hydrodynamic inter-
                                                                                                                        actions. In particular, this approach can be easily extended
                                                                                                                        to particles of arbitrary shape dispersed in a confined geome-
                                                a) equal contribution                                                   try also of arbitrary shape24–26 . An Immersed–Boundary (IB)
                                                b) Electronic mail: jphernandezo@unal.edu.co                            method is used to represent the suspended finite–sized par-
                                                c) Electronic mail: depablo@uchicago.edu
                                                                                                                        ticles. A parallel Finite Element General geometry Ewald-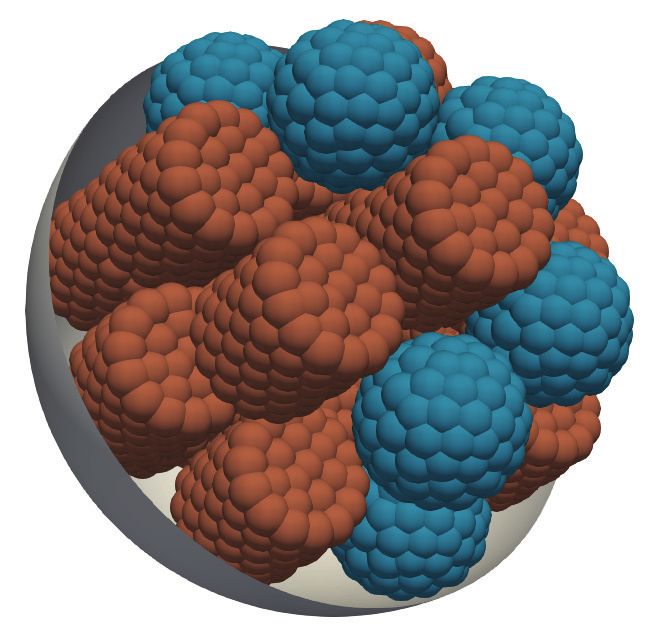
2

like method (pFE-GgEm)24 is used to calculate the confined          force/torque containing configuration terms, FEV represents
Green’s functions, which relies on a Chebyshev polynomial           force/torque excluded volume contributions and Fext includes
approximation to satisfy the fluctuation-dissipation theorem.       any external force/torque.
In recent work26 , we relied on this approach to compare the           Evolution of the suspended particles, using Eqn. (1), is
structure of pure spherical and pure cylindrical particles con-     achieved using the grand mobility or resistance tensors that
fined in a spherical cavity. It was found that cylindrical par-     relate the hydrodynamic force/torque with the translational
ticles diffuse slower as compared to spherical particles of the     and rotational velocities of the particles33–35 . Approaches like
same volume and at the same volume fraction, and that for           SD36–38 and boundary integral methods (BIM)33,39 are used
cylinders the transition from the diffusive to the sub-diffusive    extensively to solve the “mobility problem". The regularized
regime occurs at a lower volume fraction.                           Stokeslets40 , the accelerated BIM41 and the Immersed Bound-
   The studies mentioned above focused on pure spheres or           ary (IB)42–46 provide examples of numerical methods devel-
cylinders confined in a spherical cavity. The more relevant         oped to improve computational efficiency by simplifying or
case of mixtures of spheres and cylinders was not considered.       avoiding the calculation of the single- and double-layer hy-
Indeed, in applications (e.g. cytoplasm or colloidal suspen-        drodynamic potentials of suspended particles. On the case
sions) one rarely deals with systems of pure mono-disperse          of the Immersed Boundary (IB) approach, the surfaces of
spheres, and it is therefore of interest to consider how mix-       the suspended solids are represented by a distribution of dis-
tures behave relative to their pure counterparts. Note that lim-    crete force densities on a surface mesh (NIB immersed bound-
ited experimental evidence with mixtures of particles of dif-       ary nodes) that, together with a surface force description and
ferent sizes and shapes indicates that cells exhibit preferential   Stokes equations, leads to the evolution of the suspended par-
accumulation of some particles near the nucleus27,28 . In those     ticles. This is the approach that we use in this work.
cases, size based segregation was explained on the basis of            The probability distribution function for the surface mesh
a “sieving effect” that has been advanced in the dry granu-         positions in a Lagrangian frame of reference evolves accord-
lar segregation literature29,30 . An explanation for shape-based    ing to a convection-diffusion equation of the Fokker-Planck
segregation was not proposed in that work. Other experimen-         type47 . We assume a continuous probability density and use
tal work, including a study of centrifugation of colloidal rods     the Chapman-Kolmogorov equation white noise to obtain an
and spheres31 , and a study in which milli–meter sized glass        equivalent stochastic differential equation for the motion of
beads and rods were subject to strong vibration32 , have also       the mesh points48
reported segregation effects based on particle shape, and pro-
                                                                                                                  √

posed that hydrodynamic forces based on the different shapes                                        ∂
                                                                             dR = U0 + M · F +         · D dt + 2B · dW,          (2)
contribute to that segregation.                                                                    ∂R
   Our particular goal here is to provide a standard against
which past and future observations of segregation and diffu-        where U0 denotes a 3(N × NIB ) vector of the unperturbed
sion can be compared by simulating mixtures of particles of         fluid velocity generated by external pressure differences or
equal volume but having a spherical or a cylindrical aspect         shear at the mesh point positions; M is the mobility tensor
                                                                    that includes the Stokes’ drag and the pair-wise Stokeslets
ratio hc /rc = 2. By doing so, we seek to rationalize past re-
                                                                    accounting for the hydrodynamic interactions between mesh
ports with new evidence for size-based segregation and mobil-
                                                                    points; D = kB T M is the (3N × NIB ) × (3N × NIB ) diffusion
ity gradients in systems where dimensions and interactions are
                                                                    tensor; F is a 3(N × NIB ) vector of the non-Brownian and non-
perfectly controlled, thereby eliminating or avoiding some of
                                                                    hydrodynamic forces; kB is the Boltzmann constant; T is the
the complexity that arises in laboratory experiments. The out-
                                                                    temperature; M · F is a convection term that represents the
line of this paper is as follows: in Section II we describe our
                                                                    bead velocities arising from hydrodynamic interactions; the
numerical setup and methodology. Our results on the struc-
                                                                    divergence of the diffusion tensor, ∂ /∂ R · D, is the first diffu-
ture and dynamics of mixtures of spheres and cylinders are
                                                                    sive term resulting from the configuration-dependent mobility
presented in Section III. We conclude the manuscript with a
discussion of our findings in Section IV, along with a possible     of the confined mesh points; dW is a random vector, the com-
outlook for future studies.                                         ponents of which are obtained from a real-valued Gaussian
                                                                    distribution with zero mean and variance dt, and it is cou-
                                                                    pled to the diffusion tensor through the fluctuation-dissipation
II.   MODEL AND METHOD                                              theorem, D = B · BT ; and finally, the second diffusive term,
                                                                    √
                                                                       2B · dW, represents the Brownian displacement that results
                                                                    from collisions between mesh points and the surrounding (im-
   The system considered here consists of N semi–rigid par-
                                                                    plicit) solvent.
ticles embedded in a viscous fluid of viscosity η that are en-
                                                                       The main challenge in simulating a stochastic process using
closed in a spherical cavity of radius R. The equations of mo-
                                                                    Eqn. (2) is the fact that the mobility tensor, M, cannot be con-
tion under the condition of zero Reynolds number and zero
                                                                    structed explicitly under confinement for arbitrary geometries.
Stokes number are given by
                                                                    This implies that the fluctuating velocity, U, the divergence of
               FH + FB + FC + FEV + Fext = 0 ,               (1)    the diffusion tensor, ∇ · D, and the diffusion tensor decompo-
                                                                    sition, B, must be implemented in a way such that the scheme
where FH is the 6N vector containing the hydrodynamic               is matrix-free. To address this issue, we have developed an
force/torque, FB is the Brownian force/torque, FC is the            efficient O(N) numerical algorithm, parallel Finite Element -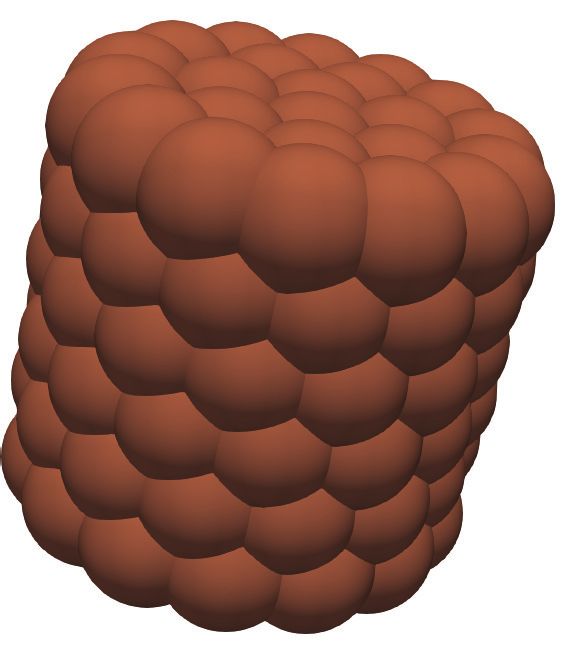
3
General Geometry Ewald-like Method (pFE-GgEm)24 . The ψ = NC/NT = 25% IB-sphere
algorithm uses (i) the General geometry Ewald-like method
(GgEm)49 for a matrix-free product of the mobility tensor rS
with any vector, M · F; (ii) a mid-point algorithm, proposed
by Fixman50 , that avoids the explicit calculation of ∇ · D; and
(iii) a Chebyshev polynomial approximation for the B · dW
product that uses GgEm to avoid the explicit calculation of D. a
The algorithm is able to handle arbitrarily shaped confining
walls.
Each particle is represented by a discretized surface, whose NIB-S = 88
details are available in Ref.26 . Using the Immersed Bound- Spherical
ary (IB) method51 , the force distributions at these particles ψ = NC/NT = 75% Cavity
are discretized as distributions of regularized point-forces. In rC IB-cylinder
particular,
NIB
f
ρIB (x) = ∑ fCν δIB (x − xν ), (3) a
ν=1
hC
where fCν represents the constitutive force acting on ν-th sur-
face node (point force with an excluded volume of radius a), 2R DoFFEM = 2x10⁵ NIB-C = 88
NIB represents the number of surface nodes that are used to
represent the suspended finite-size particles, δIB is the modi-
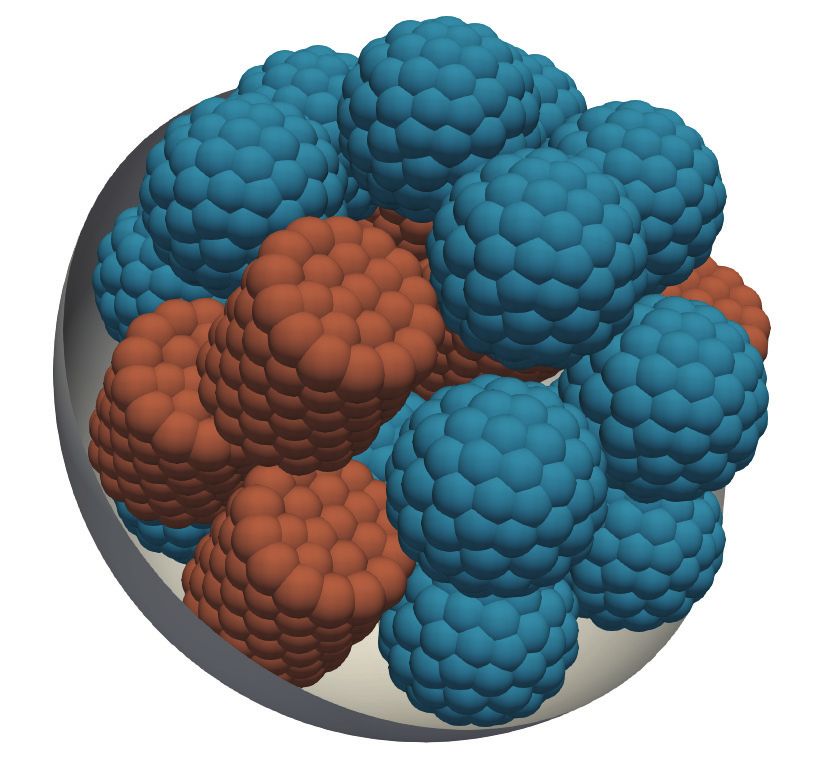
fied Gaussian regularization function. The regularization pa- FIG. 1. Snapshots of the spherical cavity of radius R containing
rameter ξIB in δIB is related to the characteristic length h for spherical and cylindrical particles with φHI = 0.2 for fraction of
the node spacing on the particle surface, i.e. ξIB ∼ h−1 ∼ a−1 . cylinders ψ = NC /NT being 0.25 and 0.75. The spherical particles
By doing this, we ensure that the regularized force on each radius is rS , while the size of the cylindrical particles is determined
node is spread over the length scale of the associated surface by rC and hC . The surface of the particles is given by a collection of
discrete nodes that are connected to six neighbors, similar to bound-
elements to prevent fluid from "penetrating" the particles.
ary element discretizations, and with a characteristic node separation
−1
The volume of spheres and cylinders is the same. Each of a ∼ h ∼ ξIB . A repulsive Lennard-Jones excluded volume is in-
surface node is linked to the neighboring node as well as to cluded on each surface node, shown schematically in the particles’
the center-of-mass point of the particle using an elastic spring cross section by the black circles. The characteristic size of the re-
pulsion is given by σ = 2.2a.
with stiffness k. A spring network is formed for every particle,
which results in an internal nodal force that resists deforma-
tion and maintains its shape. At the same time, a repulsive
Lennard-Jones (LJ) potential is used for particle-particle and III. RESULTS
particle-wall excluded volume interactions. The ratio between
mesh and particle size controls the number of surface nodes We consider different particle mixtures of spheres and
on each particle. Increasing the number of nodes improves cylinders suspended in a Newtonian viscous fluid within a
accuracy but also increases the computational cost. In a pre- spherical cavity of radius R = 15. The spherical particle
vious study26 , we showed that a spring stiffness k = 200 is has a radius rs = 3, leading to a hydrodynamic volume of
sufficient to simulate “semi-rigid" particles, where despite the VHI = 4/3πrs3 . The cylinders have an aspect ratio of 2, i.e.,
high concentration of particles, excluded volume interactions hc = 2rc , where rc = 2.62 is the radius and hc is the height.
do not alter the particle shape. In addition, we found that par- Figure 1 shows several details of our simulations and repre-
ticle discretization at the level of NIB = 20 is enough to avoid sentative snapshots for φ = 0.2 with different cylinder frac-
fluid penetration, satisfy Stokes’ law and provide the correct tions.
diffusional behavior. In this work, however, we use spheres
and cylinders discretized with NIB = 88 to ensure extremely In our semi-rigid particle model, there are two ways to
high accuracy. define the particle concentration in a cavity of volume V .
A hydrodynamic volume fraction can be defined as φHI =
In what follows, the characteristic units are: a for length, NT VHI /V ; a second one is based on the excluded volume,
a2 ζ /kB T for time, kB T for the energy and kB T /a for the force. φEV = NT VEV /V , where for spheres and cylinders we have
ζ , the node friction coefficient is related to the fluid viscosity VEV = 4/3π(rS + a)3 and VEV = π(rC + a)2 (hC + 2a), respec-
η and a through Stokes’ law, i.e., ζ = 6πηa, and the unit tively. In the remainder of the article, we will use the hydro-
diffusivity, D0 , is defined as the diffusivity of a sphere in an dynamic volume fraction φHI (referred to as φ in the rest of
infinite fluid with viscosity η, i.e., D0 = kB T /6πηa. the paper) to denote the concentration of the particles. In this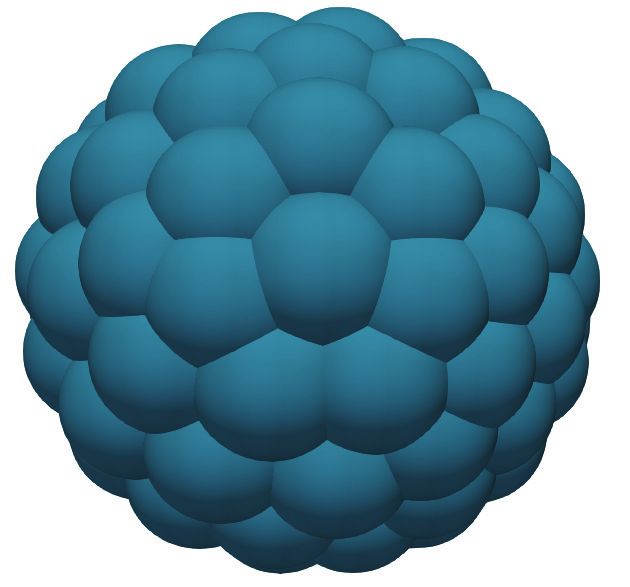
4

                         φ = 5%                       φ = 10%                         φ = 15%                        φ = 20%
       A 1.0
                                                             ψ = 25%                   ψ = 25%
                  0.8   ψ = 0%
                                                                                       ψ = 50%
     nT/max(nT)

                  0.6                                        ψ = 75%                   ψ = 75%
                  0.4
                  0.2
                          ψ = 100%
        0.0
      B 1.0
                  0.8     ψ                                                                                                     ψ
     nS/nT

                  0.6                                                                                           ψ
                  0.4
                  0.2
        0.0
      C 1.0
              0.8
     nC/nT

              0.6
              0.4                                                                                               ψ               ψ
              0.2             ψ
              0.0
                 0       4           8   12          4           8     12           4           8     12            4           8     12
                             r (a)                       r (a)                          r (a)                           r (a)

FIG. 2. Particle number density in the mixture of spherical and cylindrical particles within a spherical cavity of radius R = 15 as a function
of radial distance. The radii of spheres and cylinders are rS = 3 and rC = 2.62, respectively. The cylinder has an aspect ratio of 2, i.e.,
hC = 2rC = 5.24. (A): Number density of all particles scaled with the maximum density nT /max(nT ) for particle concentrations φ = 5%,
10%, 15%, and 20% (from left to right). For each particle concentration, different fractions of cylinders ψ are displayed along with the pure
sphere (0%) and pure cylinder (100%) cases. (B): Relative number density of only spherical particles scaled with the total density nS /nT for
various particle concentrations φ = 5%, 10%, 15%, and 20% (from left to right). (C): Relative number density of only cylindrical particles
scaled with the total density nC /nT for various particle concentrations φ = 5%, 10%, 15%, and 20% (from left to right).

work, we explore φ = [5%, 10%, 15%, 20%]; this would cor-                them by nT , nS , and nC , respectively.
respond to φEV = [12%, 24%, 36%, 48%].
                                                                            Figure 2 displays the number density for particles within
                                                                         the cavity for various particle concentrations φ and different
                                                                         fractions of cylinders for each φ . Figure 2A shows the num-
A.     Structure of sphere and cylinder mixture.                         ber density for all particles nT (r) within the cavity for various
                                                                         particle concentrations φ and different fractions of cylinders
   We begin by analyzing the structure of mixtures through               ψ. Cases with ψ = 0% and 100% cylinders refer to packings
the local particle number density. To calculate it, the spheri-          with pure spheres and cylinders, respectively. The density of
cal cavity is discretized into m evenly-spaced spherical shells          particles is scaled with the maximum number density for each
along the radial direction, leading to a shell radius of the i-th        case. A common observation is that the scaled density pro-
shell that is given by bi = (i + 0.5)R/m. The particle number            files exihibit a peak close to the wall, decreases in the bulk
density is then given by n(ri ) = hN(ri )/Vi i, where N(ri ) is the      and then increases at the center of the cavity. For low con-
number of particles in the i − th shell with volume Vi , and is          centration, φ = 5%, the peak in scaled number density near
at a distance ri from the center of the cavity; hi represents the        the wall is independent of ψ, while it decreases with ψ in
ensemble average over time. We calculate the number density              the bulk. At particle concentration φ = 10%, the scaled den-
for all particles, only spheres, and only cylinders, and denote          sity shows a peak at the center, decreasing with increasing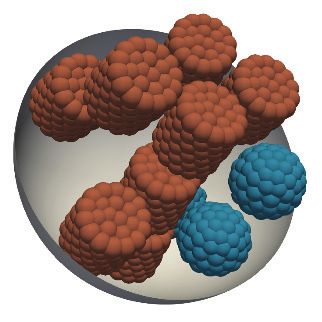
5

r and increasing again near the wall. A similar observation               1.00
can also be drawn for the case of φ = 15%. Note that for                                     ψ = 25% A                                  B
the two cases (φ = 10, 15%) the scaled density at the center                                 ψ = 50%
is higher than that near the wall. Another common feature of              0.50               ψ = 75%
                                                                                             ψ = 100%

                                                                      λ
these two cases is that the difference between the two scaled
densities decreases with increasing ψ, implying that the addi-                                                                         λ=0
                                                                          0.00
tion of cylinders enhances the heterogeneity in the local den-
sity. At the highest concentration considered here φ = 20%,                       φ = 5%                           φ = 10%
we observe a layered structure with two distinct peaks at r = 3         -0.50
and 10, along with a depletion zone in the regions r < 2 and             1.00                     λ = 1.0
                                                                                  φ = 15%                   C      φ = 20%              D
5 < r < 7. The peak position of the layered structure for the
pure cylinder case is slightly different compared to other frac-          0.50
tions, and the difference between the two peaks decreases with

                                                                      λ
increasing ψ.
   To further understand the local particle density, we analyze           0.00
the relative density of spheres and cylinders. Figure 2 (mid-
dle row) displays the number density of spheres relative to the                             λ = -0.5
                                                                        -0.50
total density as a function of r for various values of φ and ψ               0          4              8    12 0       4           8    12
= 25, 50, and 75% for each case. We observe that the scaled                                 r (a)                          r (a)
sphere density relative to the total number density nS /nT is
highest close to the wall and decreases with increasing frac-       FIG. 3. Orientational order parameter λ of cylindrical particles
tion of cylinders. nS /nT decreases with increasing fraction of     within a spherical cavity of R = 15 as a function of radial distance for
cylinders in the bulk and is always greater than zero for low       particle concentration φ = (A) 5%, (B) 10%, (C) 15%, and (D) 20%.
particle concentrations φ = 5% and 10%. nS /nT becomes zero         The radius of cylinders are rC = 2.62 and the height hC = 2rC = 5.24.
for higher particle concentrations φ = 15% and 20% at large
cylinder fraction (75%); only cylinders are found in this range
of r, as confirmed by nC /nT being equal to 1, as shown in
Fig. 2 (bottom row). These two observations demonstrate that        λ is zero close to center and is negative with increasing r,
only cylinders are present in the interior of the cavity and that   reaching a minimum and increasing further with r to reach a
spheres are close to the wall. Another point to note is that the    maximum value of 0.5; λ then decreases with r reaching -0.5
numerical values of the scaled densities for ψ = 25% and 50%        close to the wall. For the highest concentration, we find that
in the bulk are more "separated" compared to the differences        λ = −1/2 at both the center and close to the wall, and we
between ψ = 50% and 75%.                                            also find a depletion zone with no particles for r < 2. For this
   These results serve to establish the equilibrium segregation     concentration, we find another ordered state with λ ∼ 1 in the
of spheres to the walls induced by a subtle difference in parti-    region 7 < r < 10. The ordered morphology arises from segre-
cle shape but for the same particle volume. As a side note, we      gation in the cavity. At the highest volume fraction φ = 20%,
mention here that the difference in particle volume may not be      the cylinders display ordered morphologies, i.e., perpendicu-
the only reason for the observed segregation in experiments28 .     lar to the radial direction very close to the wall and parallel
                                                                    to the radial direction for 7 < r < 10. With increasing ψ, the
   Next, we analyze the orientational order parameter for dif-      cylinders push the spheres to the wall in order to minimize
ferent particle concentrations and cylinder fractions. The ori-     free volume and gain orientational order.
entational order parameter is defined as λ = 21 h3 cos2 θ − 1i,
where cos θ = m · n/(||m|| · ||n||), m is the vector parallel to       Excluded volume potential calculations yield 10.88kB T for
the centerline of the cylinder and n is the vector connect-         a single sphere, 2.3kB T for a cylinder oriented perpendicular
ing the cavity center and the cylinder’s center-of-mass. A          to the cavity wall, and 1.01kB T for a cylinder oriented paral-
parameter λ is often used in liquid crystalline systems to          lel to the cavity wall. These numbers imply that the cylinder
quantify the nematic ordering52,53 ; λ = 0 corresponds to a         oriented parallel to the cavity wall (λ = −0.5) would be the
random/disordered configuration, whereas λ is unity for or-         most preferable configuration, which explains λ = −0.5 irre-
dered morphologies, with the cylinder axis being coaxial with       spective of the volume fraction φ and fraction of cylinders ψ.
the radial direction of the spherical cavity (radial phase), and    At low volume fractions, both the spheres and cylinders are
λ = −1/2 when all cylinders are aligned transversal to the ra-      found in the bulk with cylinders oriented parallel to the cavity
dial direction (concentric phase). Figure 3 displays λ for var-     wall. However, as the volume fraction increases, cooperative
ious particle concentrations with different fractions of cylin-     effects related to the ordering of cylinders in the bulk lead the
ders. A common observation is that, very close to the wall, the     spheres to segregate to the cavity wall. Also note that, even
order parameter is λ = −1/2 irrespective of the volume frac-        though we demonstrate the layering of particles in the den-
tion, indicating a concentric phase close to the wall. We also      sity profiles and structure in the orientational order parameter,
find that λ fluctuates around zero in the bulk for low volume       the system is not crystalline; instead, it is still fluid-like, and
fractions, i.e, φ = 5%, 10%, indicating a disordered configu-       particles diffuse throughout the system, as discussed in the
ration of cylinders. For moderate concentrations, φ = 15%,          following section.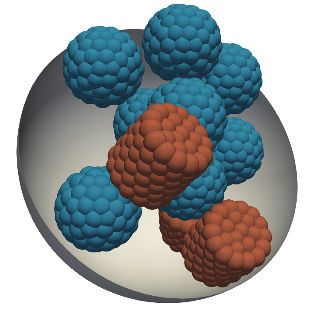
6

           0.7                               0.7                            the Einstein–Stokes relation56
           0.6                               0.6                                               h∆x2R (t)i(ri ) = 2MR (ri )t,                (4)
  MR/M00

                                    MT/M00
           0.5                               0.5
                                                                                                h∆x2T (t)i(ri ) = 4MT (ri )t,               (5)
           0.4                               0.4
           0.3                               0.3             φ = 5%         for short–time t → 0; ∆x = x(t + dt) − x(t), ∆xR = ∆x · x/|x|,
                 ψ = 0%                                      φ = 10%        ∆xT = ∆x − ∆xR denote the radial and tangential displace-
           0.2                               0.2
                                                                            ments, respectively. MR (ri ) and MT (ri ) correspond to the in-
           0.7   ψ = 25%                     0.7             φ = 15%        stantaneous radial and tangential mobilities at radial location
           0.6                                               φ = 20%        ri in an infinitesimal time interval dt. Instantaneous radial and
                                             0.6
  MR/M00

                                    MT/M00
           0.5                               0.5                            tangential mobilities are averaged in each shell during a sim-
           0.4                                                              ulation, and then over 10 independent realizations.
                                             0.4
                                                                               Figure 4 displays both the radial MR and tangential MT
           0.3                               0.3                            components of mobility within the cavity for mixtures of
           0.2                               0.2                            spherical and cylindrical particles as a function of radial dis-
                                                                            tance for various particle concentrations. Note that the two
           0.7   ψ = 50%                     0.7
                                                                            components are normalized by the mobility of a spherical par-
           0.6                               0.6                            ticle at infinite dilution M00 . A few observations can be drawn:
                                    MT/M00
  MR/M00

           0.5                               0.5                            mobilities along both directions are not constant along the ra-
           0.4                               0.4                            dial direction; instead, the particles diffuse fastest at the cavity
           0.3                               0.3                            center and slowest at the cavity wall. Second, both MR and
                                             0.2                            MT decrease with increasing particle concentration due to en-
           0.2
                                                                            hanced many–body hydrodynamic interactions with φ . Next,
           0.7   ψ = 75%                     0.7                            the peaks and trough in mobility appear at the same radial po-
           0.6                               0.6                            sition, corresponding to the local particle density as shown in
                                    MT/M00
  MR/M00

           0.5                               0.5                            Fig. 2, thereby revealing a correlation between structure and
                                                                            dynamics. This becomes particularly apparent for the case of
           0.4                               0.4
                                                                            φ = 20%, where a layered structure for both MR and MT cor-
           0.3                               0.3                            responds to a similar density profile as observed in Fig. 2, e.g.,
           0.2                               0.2                            the dip in mobility at 2 < r < 7 corresponds to the peak in ρ in
                                                                            the same radial range. Both MR and MT display the expected
           0.7   ψ = 100%                    0.7                            decrease with increasing φ close to the wall for all cylinder
           0.6                               0.6                            fractions. For φ = 5 and 10%, we observe an expected de-
                                    MT/M00
  MR/M00

           0.5                               0.5                            crease in mobility with φ in the bulk as well. In contrast, for
           0.4                               0.4                            higher particle concentrations (φ = 15%), the mobility does
           0.3                               0.3                            not exhibit a decrease with φ in the bulk, and mobility for
                                                                            φ = 20% at radial location r ∼ 5 becomes equal or even larger
           0.2                               0.2
                                                                            than that for φ = 15%. Taken together, these observations
             0     4           8   12              0   4           8   12   reveal that a structural inhomogeneity leads to unexpected in-
                       r (a)                               r (a)
                                                                            homogeneities in the corresponding mobility.
FIG. 4. Radial mobility MR (left) and tangential mobility MT (right)
for mixture of cylindrical particles with rC = 2.62 and hC = 2rC =
5.24, and spherical with rS = 3 confined in a spherical cavity of R =       C.   Long time mobility of the particles.
15 for various particle concentrations, φ , and different fraction of
cylinders ψ. Both components of mobility are normalized by the                 The displacement of a Brownian particle in a confined
mobility of spherical particles in the bulk at infinite dilution M00 for    system is hindered, and thus the mean square displacement
t → 0. The error bars represent the statistical error.                      (MSD) over time is lower than that observed in a bulk sys-
                                                                            tem21,23 . Our recent work on pure suspensions26 showed that
                                                                            a change in shape from spherical to cylindrical at constant vol-
                                                                            ume fraction leads to slower particle diffusion. The question
B.     Local mobility of the particles in the cavity.                       that arises here is: how does the fraction of cylinders in a mix-
                                                                            ture affect long-time dynamics?
                                                                               Fig. 5A shows the average MSDs for mixtures at different
   As mentioned earlier, recent experiments54–57 and simu-                  particle concentrations. The MSD of each system is calculated
lations22,23 suggest that confinement can lead to anisotropic               from ten independent simulations in which the particles dif-
self–diffusion, which is not the case for unconfined suspen-                fuse for more than 300 particle diffusion times within the cav-
sions. To examine this, mobilities (short-time diffusivity) in              ity. A couple of observations can be drawn. First, the MSDs
both the radial and tangential directions are calculated using              grow linearly as short times, t → 0, and reach a plateau in the
7
3
10 1.0 1.0
A
ψ = 25% 0.8
0.8
M0/M00
Mα/Mα0
2
10 ψ = 75%
0.6
0.6 0.4
1 0.2
10
MSD (a2)
0.4 B C
1.0 3.0
0
α D E
10 Mαt
transition time
0.9
2.0
0.8
α
-1 transition time φ = 5%
10 0.7 φ = 10% 1.0
M0 t 0.6 φ = 15%
-2 φ = 20%
10 -2 -1 0 1 2 3
0.5 0.0
0 25 50 75 100 0 25 50 75 100
10 10 10 10 10 10 ψ ψ
t (a2ζ/kBT)
FIG. 5. (A) Mean square displacement as a function of time for mixture of spherical and cylindrical particles that are confined in a spherical
cavity with R = 15 for various particle concentrations φ with varying fraction of cylinders. Solid and dashed lines are the results for ψ = 25,
and 75 % fraction of cylinders. (B) short time mobility scaled with the mobility of spherical particles in bulk at infinite dilution M00 plotted
against ψ, (C) sub-diffusive (at intermediate time) mobility scaled with the mobility of spherical particles in bulk at infinite dilution M00 plotted
against ψ, (D) sub-diffusive exponent α plotted against ψ, and (E) time scale to make transition between diffusive to sub–diffusive behavior
plotted as a function of fraction of cylinders for various values of φ .
long time limit, t → ∞. Second, at intermediate times, particle diate time sub–diffusive regime, is displayed in Fig. 5E. We
motion becomes sub–diffusive for systems with φ ≥ 10%. observe that for φ = 0.1 the transition time decreases strongly
To analyze the diffusion behavior in detail we express the with the cylinder fraction and becomes nearly independent of
MSD as the generalized Stokes-Einstein relation cylinder fraction for higher particle concentrations.
2 To explain the smooth to rigid transition as observed in
R(t) − R(0) = Mit i , (6) both M0 /M00 and Mα /M00 , we refer to the scaled density pro-
files with increasing ψ. We observe that the scaled densities
where R is the 3N p particle coordinate vector, Mi is the gen-
nT /max(nT ) for ψ = 0 and 25% are similar but then drop
eralized particle mobility coefficient and i is the power law
drastically for ψ ≥ 50%, which affects the mobility in both
exponent that characterizes whether the particle motion is
the diffusive and sub–diffusive cases. On the other hand, for
sub–diffusive (α < 1), diffusive (α = 1) or super-diffusive
the transition time between the diffusive to the sub–diffusive
(α > 1). For the case of (α = 1), the mobility M0 is the dif-
regime (i.e. roughly the time needed for particles to diffuse a
fusion coefficient.
distance nearly equal to the radius), collisions between parti-
Figure 5B–E displays our findings for the mean square dis-
cles slow down their motion, leading to sub–diffusive behav-
placement. Short time mobility (Fig. 5B) and sub–diffusive
ior. It follows that the transition time would decrease with
mobility (Fig. 5C) decrease with increasing cylinder fraction
increasing particle concentration φ . Further, at low φ , chang-
ψ and particle concentration φ . The dependence of M0 /M00
ing shape from spheres (ψ = 0) to (ψ = 100%) to cylinders,
and Mα /M00 on particle concentration φ is monotonic; how-
due their larger aspect ratio the latter should feel each other at
ever, the dependence on cylinder fraction is weak at smaller
shorter–time scales, compared to what is seen for spheres, and
cylinder fraction ψ and becomes strong beyond 50%, showing
hence yield a transition time that decreases with ψ. At larger
a smooth to "rigid" transition at ψ = 50%. Note that for the
φ , the system is so dense that even for different packings, i.e.,
case of φ = 5%, sub–diffusion is not observed at any cylinder
sphere–sphere, sphere–cylinder and cylinder–cylinder cases,
fraction ψ. On the other hand, the sub–diffusive–exponent
the particle interaction time scales become similar.
α (Fig. 5D) that characterizes the strength of sub–diffusive
behavior decreases with both φ and ψ. In the case of short–
time and sub–diffusive mobilities M0 /M00 and Mα /M00 , the
dependence on ψ is monotonic; however, the correlation gets IV. CONCLUSIONS
less pronounced with increasing particle concentration. Fi-
nally, the transition time, defined as the time at which the sys- We have studied the structure and dynamics of mixtures
tem transitions from the short–time diffusive to the interme- of finite size in mixtures of spherical and cylindrical parti-8
cles confined in a spherical cavity. An Immersed Boundary- 5 J. D. Seymour, J. P. Gage, S. L. Codd, and R. Gerlach, “Anomalous fluid
General geometry Ewald-like Method (IB-GgEm) approach transport in porous media induced by biofilm growth,” Physical Review
was used in the corresponding calculations, thereby taking Letters 93, 198103 (2004).
6 J. Gao, W. Guo, D. Feng, H. Wang, D. Zhao, and L. Jiang, “High-
into account hydrodynamic interactions between particles and performance ionic diode membrane for salinity gradient power generation,”
between particles and confining walls. By systematically Journal of the American Chemical Society 136, 12265–12272 (2014).
7 Z. Zhang, X. Sui, P. Li, G. Xie, X.-Y. Kong, K. Xiao, L. Gao, L. Wen,
varying the cylinder fraction at different particle concentra-
tions, it was found that particle shape has a pronounced ef- and L. Jiang, “Ultrathin and ion-selective janus membranes for high-
performance osmotic energy conversion,” Journal of the American Chemi-
fect on both the structure and dynamics of confined Brown- cal Society 139, 8905–8914 (2017).
ian suspensions. Our results suggest that introducing non– 8 S. B. Darling, “Perspective: Interfacial materials at the interface of energy
spherical particles affects the local structure and local dynam- and water,” Journal of Applied Physics 124, 030901 (2018).
9 R. Z. Waldman, H.-C. Yang, D. J. Mandia, P. F. Nealey, J. W. Elam, and
ics and global dynamics in different ways. At a local level,
particles are found to segregate based on shape, with cylin- S. B. Darling, “Janus membranes via diffusion-controlled atomic layer de-
position,” Advanced Materials Interfaces 5, 1800658 (2018).
ders adopting conformations with high orientational order. At 10 A. Minton, “Ap minton, biopolymers 20, 2093 (1981).” Biopolymers 20,
a global level, cylinders give rise to pronounced differences in 2093 (1981).
the short-time mobility, the sub–diffusive behavior at interme- 11 A. B. Fulton, “How crowded is the cytoplasm?” Cell 30, 345–347 (1982).
12 M. C. Konopka, I. A. Shkel, S. Cayley, M. T. Record, and J. C. Weisshaar,
diate timescales, and the transition time from diffusive to sub-
diffusive behavior. Particle concentration has a strong effect “Crowding and confinement effects on protein diffusion in vivo,” Journal
of Bacteriology 188, 6115–6123 (2006).
on such transitions. To start with, the mobility shows a smooth 13 R. J. Ellis, “Macromolecular crowding: obvious but underappreciated,”
to stiff transition at 50% cylinder fraction for all particle con- Trends Biochem. Sci. 26, 597–604 (2001).
centrations and the sharpness of this transition increases with 14 R. J. Ellis, “Macromolecular crowding: an important but neglected aspect
particle concentration. Secondly, the sub-diffusive slope and of the intracellular environment,” Current Opinion in Structural Biology 11,
sub–diffusive exponent show mixed features as a function of 114–119 (2001).
15 C. Selhuber-Unkel, P. Yde, K. Berg-Sørensen, and L. B. Oddershede, “Va-
cylinder fraction. The slope shows a smooth to stiff transi- riety in intracellular diffusion during the cell cycle,” Physical biology 6,
tion similar to that of the short time mobility. The exponent 025015 (2009).
16 M. Weiss, M. Elsner, F. Kartberg, and T. Nilsson, “Anomalous subdiffusion
decreases smoothly with increasing cylinder fraction. In both
cases, the dependence on the cylinder fraction is insensitive to is a measure for cytoplasmic crowding in living cells,” Biophysical journal
87, 3518–3524 (2004).
particle concentration. Lastly, the transition time from the dif- 17 F. Höfling and T. Franosch, “Anomalous transport in the crowded world of
fusive to sub–diffusive regime depends strongly on the cylin- biological cells,” Reports on Progress in Physics 76, 046602 (2013).
der fraction for low particle concentrations (φ = 0.1); that de- 18 D. J. Bicout and M. J. Field, “Stochastic dynamics simulations of macro-
pendence weakens with increasing particle concentration. molecular diffusion in a model of the cytoplasm of escherichia coli,” The
Journal of Physical Chemistry 100, 2489–2497 (1996).
As an outlook, the role of aspect ratio and electrostatic in- 19 S. R. McGuffee and A. H. Elcock, “Diffusion, crowding & protein stability
teraction on particle mobility in confined mixtures will be con- in a dynamic molecular model of the bacterial cytoplasm,” PLoS Computa-
sidered in future that arise in a realistic cell environment. tional Biology 6, 1–18 (2010).
20 T. Ando and J. Skolnick, “Crowding and hydrodynamic interactions likely
dominate in vivo macromolecular motion,” Proceedings of the National
Academy of Sciences 107, 18457–18462 (2010).
21 E. Chow and J. Skolnick, “Effects of confinement on models of intracel-
ACKNOWLEDGMENTS
lular macromolecular dynamics,” Proceedings of the National Academy of
Sciences 112, 14846–14851 (2015).
We acknowledge the support by the Department of En- 22 C. Aponte-Rivera and R. N. Zia, “Simulation of hydrodynamically inter-
ergy, Basic Energy Sciences, Materials Research Division acting particles confined by a spherical cavity,” Physical Review Fluids 1,
through the AMEWS EFRC Center. The models and codes 023301 (2016).
23 C. Aponte-Rivera, Y. Su, and R. N. Zia, “Equilibrium structure and diffu-
employed for this work were developed with support from sion in concentrated hydrodynamically interacting suspensions confined by
the Midwest Center for Computational Materials (MICCOM) a spherical cavity,” Journal of Fluid Mechanics 836, 413–450 (2018).
and Award doe-sc0008631 (KFF). We gratefully acknowledge 24 X. Zhao, J. Li, X. Jiang, D. Karpeev, O. Heinonen, B. Smith, J. P.
the computing resources provided on Bebop (Blues), a high- Hernandez-Ortiz, and J. J. de Pablo, “Parallel o(n) stokes’ solver towards
performance computing cluster operated by the Laboratory scalable brownian dynamics of hydrodynamically interacting objects in
general geometries,” The Journal of Chemical Physics 146, 244114 (2017).
Computing Resource Center at Argonne National Laboratory, 25 K. L. Kounovsky-Shafer, J. P. Hernandez-Ortiz, K. Potamousis, G. Tsvid,
and the University of Chicago Research Computing Center. M. Place, P. Ravindran, K. Jo, S. Zhou, T. Odijk, J. J. De Pablo, et al.,
“Electrostatic confinement and manipulation of dna molecules for genome
1 J.
analysis,” Proceedings of the National Academy of Sciences 114, 13400–
Happel and H. Brenner, Low Reynolds Number Hydrodynamics: with 13405 (2017).
Special Applications to Particulate Media (Prentice-Hall, Inc., Englewood 26 J. Li, X. Jiang, A. Singh, O. G. Heinonen, J. P. Hernández-Ortiz, and
Cliffs, New Jersey, 1965). J. J. de Pablo, “Structure and dynamics of hydrodynamically interacting
2 D. L. Koch and G. Subramanian, “Collective hydrodynamics of swimming
finite-size brownian particles in a spherical cavity: spheres and cylinders,”
microorganisms: living fluids,” Annual Review of Fluid Mechanics 43, (N.A.), unpublished.
637–659 (2011). 27 V. K. Kodali, W. Roos, J. P. Spatz, and J. E. Curtis, “Cell-assisted assembly
3 L. Hudson, J. Eastoe, and P. Dowding, “Nanotechnology in action: Over-
of colloidal crystallites,” Soft Matter 3, 337–348 (2007).
based nanodetergents as lubricant oil additives,” Advances in colloid and 28 P. Kolhar and S. Mitragotri, “Polymer microparticles exhibit size and shape
interface science 123, 425–431 (2006). dependent accumulation around the nucleus after endocytosis,” Advanced
4 R. Richert, “Geometrical confinement and cooperativity in supercooled liq-
Functional Materials 22, 3759–3764 (2012).
uids studied by solvation dynamics,” Physical Review B 54, 15762 (1996).9
29 S. Savage and C. Lun, “Particle size segregation in inclined chute flow of Computational Science 11, 79–141 (2016).
dry cohesionless granular solids,” Journal of Fluid Mechanics 189, 311–335 45 A. M. Fiore, F. Balboa Usabiaga, A. Donev, and J. W. Swan, “Rapid sam-
(1988). pling of stochastic displacements in brownian dynamics simulations,” The
30 J. M. N. T. Gray, “Particle segregation in dense granular flows,” Annual Journal of chemical physics 146, 124116 (2017).
Review of Fluid Mechanics 50, 407–433 (2018). 46 B. Sprinkle, A. Donev, A. P. S. Bhalla, and N. Patankar, “Brownian dy-
31 V. Sharma, K. Park, and M. Srinivasarao, “Shape separation of gold namics of fully confined suspensions of rigid particles without green’s func-
nanorods using centrifugation,” Proceedings of the National Academy of tions,” The Journal of chemical physics 150, 164116 (2019).
Sciences 106, 4981–4985 (2009). 47 H. Risken, The Fokker-Planck equation, 2nd ed. (Springer-Verlag, Berlin,
32 R. Caulkin, X. Jia, M. Fairweather, and R. A. Williams, “Geometric aspects Heidelberg, 1989).
of particle segregation,” Physical Review E 81, 051302 (2010). 48 H. C. Öttinger, Stochastic processes in polymeric fluids (Springer-Verlag,
33 C. Pozrikidis, Boundary Integral and Singularity Methods for Linearized Berlin, Heidelberg, 1996).
Viscous Flow (Cambridge University Press, Cambridge, 1992). 49 J. P. Hernández-Ortiz, J. J. de Pablo, and M. D. Graham, “Fast computation
34 O. Ladyzhenskaya, The mathematical theory of viscous incompressible flow of many-particle hydrodynamic and electrostatic interactions in a confined
(Gordon and Beach, New York, 1963). geometry,” Physical Review Letters 98, 140602 (2007).
35 H. Power and L. C. Wrobel, Boundary Integral Methods in Fluid Mechanics 50 M. Fixman, “Implicit algorithm for brownian dynamics of polymers,”
(Computational Mechanics Publications, Southampton, 1995). Macromolecules 19, 1195–1204 (1986).
36 J. F. Brady and G. Bossis, “Stokesian dynamics,” Annual Review of Fluid 51 P. Pranay, S. G. Anekal, J. P. Hernandez-Ortiz, and M. D. Graham, “Pair
Mechanics 20, 111 (1988). collisions of fluid-filled elastic capsules in shear flow: Effects of membrane
37 A. Sierou and J. F. Brady, “Accelerated Stokesian dynamics simulations,” properties and polymer additives,” Physics of Fluids 22, 123103 (2010).
Journal of Fluid Mechanics 448, 115–146 (2001). 52 P. A. Lebwohl and G. Lasher, “Nematic-liquid-crystal order—a monte carlo
38 J. W. Swan and J. F. Brady, “Particle motion between parallel walls: Hy- calculation,” Physical Review A 6, 426 (1972).
drodynamics and simulation,” Physics of Fluids 22, 103301 (2010). 53 J. A. Martínez-González, X. Li, M. Sadati, Y. Zhou, R. Zhang, P. F. Nealey,
39 T. A. Osswald and J. P. Hernández-Ortiz, Polymer Processing: Modeling and J. J. de Pablo, “Directed self-assembly of liquid crystalline blue-phases
and Simulation (Carl Hanser-Verlag, Munich, 2006). into ideal single-crystals,” Nature Communication 8, 15854 (2017).
40 R. Cortez, “The method of regularized stokeslets,” SIAM J. Sci. Comput. 54 M. D. Carbajal-Tinoco, R. Lopez-Fernandez, and J. L. Arauz-Lara, “Asym-
23, 1204 (2001). metry in colloidal diffusion near a rigid wall,” Physical review letters 99,
41 A. Kumar and M. D. Graham, “Accelerated boundary integral method for 138303 (2007).
multiphase flow in non-periodic geometries,” Journal Of Computational 55 H. Eral, J. Oh, D. Van Den Ende, F. Mugele, and M. H. Duits, “Anisotropic
Physics 231, 6682–6713 (2012). and hindered diffusion of colloidal particles in a closed cylinder,” Langmuir
42 C. S. Peskin, “The immersed boundary method,” Acta Numerica 11, 479– 26, 16722–16729 (2010).
517 (2002). 56 A. E. Cervantes-Martínez, A. Ramírez-Saito, R. Armenta-Calderón, M. A.
43 P. J. Atzberger, P. R. Kramer, and C. S. Peskin, “A stochastic im- Ojeda-López, and J. L. Arauz-Lara, “Colloidal diffusion inside a spherical
mersed boundary method for fluid-structure dynamics at microscopic cell,” Physical Review E 83, 030402 (2011).
length scales,” Journal Of Computational Physics 224, 1255–1292 (2007). 57 G. L. Hunter, K. V. Edmond, and E. R. Weeks, “Boundary mobility con-
44 B. Kallemov, A. Bhalla, B. Griffith, and A. Donev, “An immersed bound-
trols glassiness in confined colloidal liquids,” Physical Review Letters 112,
ary method for rigid bodies,” Communications in Applied Mathematics and 218302 (2014).You can also read