Environmental dust repelling from hydrophilic/hydrophobic surfaces under sonic excitations - Nature
←
→
Page content transcription
If your browser does not render page correctly, please read the page content below
www.nature.com/scientificreports
OPEN Environmental dust repelling
from hydrophilic/hydrophobic
surfaces under sonic excitations
Abba Abdulhamid Abubakar1, Bekir Sami Yilbas1,2,3*, Hussain Al‑Qahtani1 & Ammar Alzaydi1
Dust repelling from transparent polyvinyl chloride film surface via sonic excitation is examined and
dynamics of repelled (inflight) dust particles are analyzed. An experimental rig is designed and built
to assess the vibrational characteristics of the polyvinyl chloride film at different frequencies of
sonic excitation. A high speed recording system and tracking program are utilized monitoring and
evaluating the dynamics of the inflight particles. The dynamics of inflight particles are also simulated
numerically and the predictions are compared with those of the experimental data. In order to
examine the influence of dust particle adhesion on the dynamics of the inflight particles, the polyvinyl
chloride film surface is hydrophobized through dip coating by functionalized nano-silica particles.
Improvement of the optical transmittance of the dust mitigated film is determined via outdoor tests.
The findings demonstrate that sonic excitation repels the particles from the film surface and it is more
pronounced at 64 Hz excitation frequency while demonstrating that sonic excitation can be used
for dust removal from transparent surfaces. The mitigation via sonic excitation improves the optical
transmittance of the dusty surface by 77%, which becomes more apparent for hydrophobic surfaces.
The mitigation of environmental dust from surfaces becomes unavoidable because of regular dust settlements
on surfaces in open environments. This becomes particularly important for solar energy devices because of the
prolonged duration of dust settlement significantly influences the optical properties of the device surfaces and
reduces the device performance. The solar radiation reaching on to the device surfaces is immensely affected
by the accumulated dust layer1, which is more pronounced in nearby desert environments where the frequent
dust storms occur. Some cleaning techniques were used for dust mitigation, such as b rushing2, electrostatic
repelling3,4, water spreading5, air puffing6, liquid droplet rolling7, mechanical vibration8, ultrasonic cleaning9,
etc. These techniques are effective in dust mitigation from surfaces even though they have some shortcomings
in terms of high energy consumptions, scarcity of clean water, and expensive air compression. In addition, the
operation and maintenance costs of the mechanical systems for automated brushing, air-jet blowing, and water
splashing are expected to be enormously high in desert environments. The weather conditions do not appear to
be encouraging for self-cleaning applications (via utilizing the mechanism of water droplet rolling) such that the
rainfall, in general, is not feasible most of the time during the entire seasons in arid regions. Although electrostatic
dust repelling from surfaces has promising feature, yet removal of small dust particles from surfaces becomes
challenging because of strong adhesion of these particles on the surfaces. Moreover, utilizing the mechanism of
the mechanical vibration towards cleaning the dusty surfaces can only be effective within limited frequency and
amplitude ranges because of avoiding the structural damages of the solar energy d evice10. One of the alternative
methods can involve with repelling of dust particles with acoustic radiation under the sound wave excitations.
Although some studies were presented incorporating utilization of ultrasonic excitation for particle removal
from surfaces, the environment incorporated is mainly concerned with the liquids9, which may become costly
for dust mitigation from energy harvesting device surfaces. Hence, investigation of dust mitigation from optically
transparent surfaces via acoustic radiation becomes essential.
Cleaning of surfaces using the acoustic waves has taken attention for the application of energy harnessing
equipment11. The main focus was dust mitigation via increasing detachment of the dust particles from surfaces
using the acoustic radiative power. The approach, that introduces the ultrasonic waves for removal of airborne
particles including small size dust, pollens, and industrial low size wastes, reported to work well; however, the
system could operate with the presence of a thin water layer on surfaces12. Although the ultrasonic cleaning
1
Mechanical Engineering Department, King Fahd University of Petroleum and Minerals, Dhahran 31261,
Saudi Arabia. 2Center of Research Excellence in Renewable Energy (CoRE‑RE), KFUPM, Dhahran 31261, Saudi
Arabia. 3K.A. CARE Energy Research & Innovation Center at Dhahran, Dhahran, Saudi Arabia. *email: bsyilbas@
kfupm.edu.sa
Scientific Reports | (2020) 10:19348 | https://doi.org/10.1038/s41598-020-76418-2 1
Vol.:(0123456789)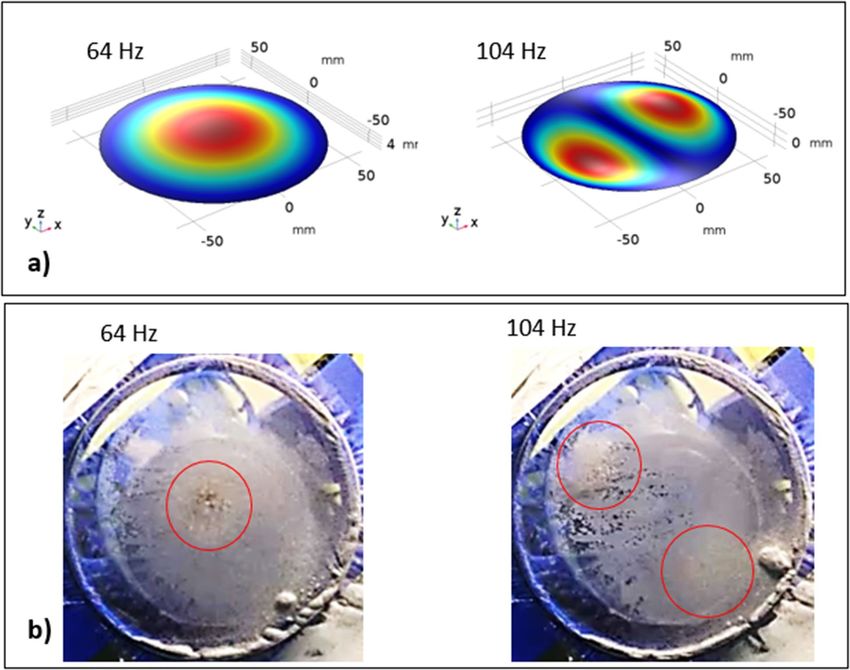
www.nature.com/scientificreports/
method provided the effective cleaning of small particles, the scarcity of clean water in rural areas could limit
the practical application of such arrangements in large scale solar energy harvesting farms. The use of sonic
radiation could be extended to include fouling in tubing s ystems13 and residuals removal in manufacturing,
particularly additive manufacturing system9,12. In any case, the use of clean water becomes a necessity for such
cleaning applications. Moreover, introducing mechanical excitations on surfaces via piezoelectric actuators and
mechanical accelerators could clean the surfaces in ambiances where airborne particles are high present at
high concentrations in air. However, it became necessary to use the additional mechanical system(s) to remove
the repelled particles from surfaces such mechanical brushes8 or to utilize gravitational potential, via surface
inclination, to displace the repelled particles from s urfaces14. The vibrational excitation of the antistatic coated
surface could ease the mitigation of the dust particles from surfaces; however, the vibrational characteristics
of the surface remained important for the efficient cleaning process. The combination of strong acoustic wave
(sound wave) and mechanical vibration could be used effectively to clean the porous surfaces, which became
particularly important for producing the biomedical parts15. However, practical applicability of such arrange-
ments for dust mitigation is questionable because of relatively smooth surfaces involved in energy harvesting
equipment. Moreover, the acoustic excitation towards removal of deposits from surfaces could be favorable for
heat transfer e nhancement16; however, the sound waves generated could disperse and propagate in all directions
in the liquid while resulting in loss of wave intensity, which lowered the mitigation of deposits from surfaces.
Nevertheless, sound wave excitation in air ambient for the mitigation of environmental dust needs to be explored
for practical applications.
On the other hand, environmental dust contains various elements with salt and oxide compounds. Some of
the slat compounds in the dust particles do not conform stoichiometric ratio while creating additional ionic
charges on the particle surfaces17. This adds to the interfacial adhesion, due to the van der Walls forces, between
the particles and the settled surfaces. In addition, the charged particles form clusters-like edifices and they can
attach onto the dust particle surfaces with large s izes18. The combination of particle clustering and ionic forces
considerably enhances the work of adhesion required for dust removal from surfaces, i.e. increased contact area
at the interface on the settled surface and strong interfacial forces enhance particle adhesion. One of the meth-
ods reducing the individual and clustered particle adhesion on the settled surfaces is to reduce the contact area
between the particles and the settled surfaces. This can be achieved, possible, through proper texturing of the
surface19. The surface texture with hierarchically distributed mico/nanopillars are favorable because such texture
topology gives rise to hydrophobic state on the surfaces20. Hydrophobizing the surface lowers the transmittance
of the optically transparent samples; however, overall reduction in optical transmittance of hydrophobized sur-
face over the visible spectrum is almost 10% of the none-hydrophobized s urface21. In environments subjected to
frequent heavy dust settlements, hydrophobizing the surfaces eases dust mitigation from surfaces; in which case,
overall optical transmittance can improve. Moreover, reducing the surface free energy of the textures causes a
further reduction in the adhesion of the particles on surfaces. Hydrophizing the surface having low surface free
energy, via texturing and chemical modification, can ease the mechanical repelling of dust particles from the
surface due to low a dhesion18. Hence, lowering the free energy of textured surfaces provides better opportunities
to mitigate the environmental dust particles surfaces via acoustic excitations in terms of sonic waves. Acoustic
excitations for dust mitigation have successfully applied in the previous studies to remove soot and ashes from
tune banks, particularly at high-temperature a pplications22. The low frequency and high-intensity sound waves
were effectively used removing the charged particles (powders) from the collection plate of an electrostatic
precipitator22. Although acoustic levitation of dust particles enables are swept by the airflow, the flow forming a
vortex structure is required for mitigating the levitated particles from the s urfaces23,24. However, generating such
flow structures sustaining the cleaning of large areas for prolonged durations remains difficult to achieve. In addi-
tion, the particle removal under sonic excitation was studied earlier and the focus was the removal of t ooth22 or
charged particles23. However, dust particles have larger densities than sooth and low static charges unlike those
of the cases reported in the early work22. Hence, the removal of dust particles from surfaces in dry environments
under the sonic influence becomes interestingly new research and accomplishments of dust mitigation from
surfaces by sonic excitation becomes fruitful despite the fact that the practical applications of sonic excitation
for dust mitigation in: i) cleaning of sensor surfaces for autonomous systems, and ii) efficient operation of solar
energy harvesting devices require further investigations. Nevertheless, the present work is proposed to investigate
the dust removal from hydrophilic/hydrophobic and optically transparent polyvinyl chloride film surfaces using
the sonic excitations pertinent to cleaning applications of protective layer for photovoltaic applications. The
sample (polyvinyl chloride film) surfaces are hydrophobized by depositing functionalized nano-silica particles
via dip coating. An experimental rig is designed and built for sonic excitations and dust removal. A high speed
recording system is utilized monitoring and tracking the repelling dust particles from surfaces during the sonic
excitations. An analytical approach is introduced to formulate the repelled dust particle dynamics and resulting
predictions are compared with those of the experimental findings. The outdoor tests are carried out to evaluate
the optical transmittance of dust repelled surfaces.
Experimental
Polyvinyl chloride film with 0.14 mm thickness and 120 mm diameter were used as samples. The sample surfaces
were hydrophobized via a dip-coating technique through depositing the functionalized nano-silica-particles.
The nanoparticles were synthesized in accordance with the early w ork25. The wetting of the coated surface was
determined via goniometer (Kyowa, model DM 501) as similar to the previous w ork26. A high resolution camera
and software were incorporated in the goniometer to capture and analyze the contact angle. De-ionized water
was used in the measurements and droplet volume was controlled with an automatic dispensing system hav-
ing a volume step resolution of 0.1 µL. The sessile droplet contact angle was evaluated using the high-precision
Scientific Reports | (2020) 10:19348 | https://doi.org/10.1038/s41598-020-76418-2 2
Vol:.(1234567890)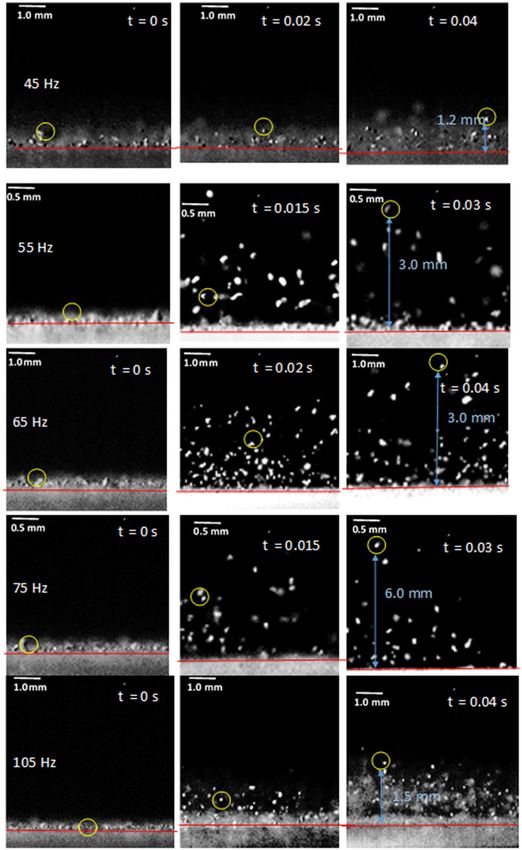
www.nature.com/scientificreports/
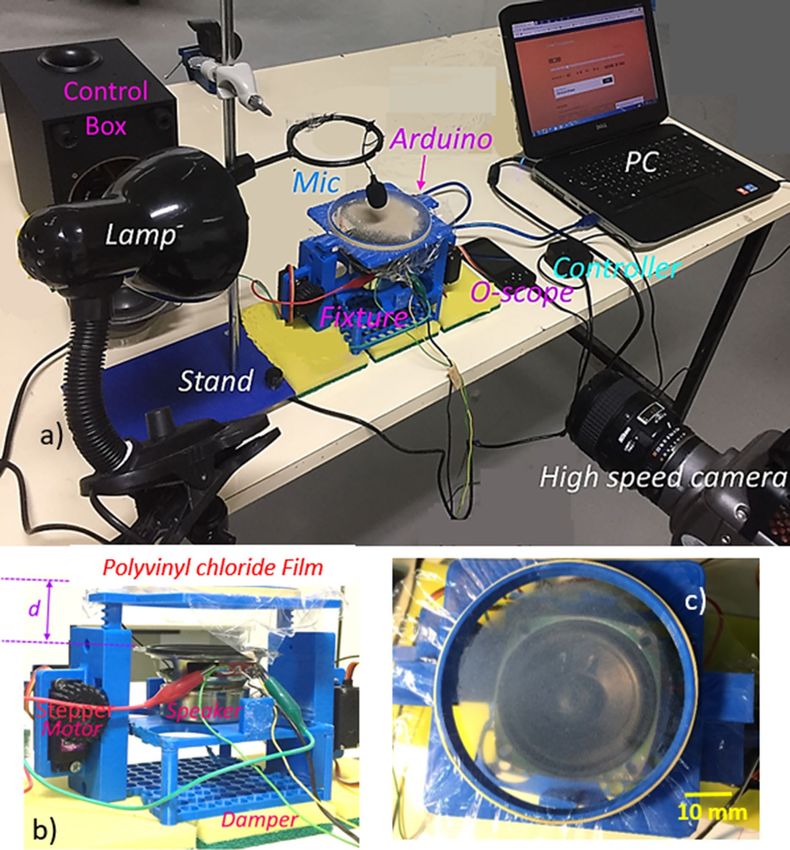
Figure 1. Optical image of the set-up: (a) complete unit, (b) speaker unit and d is the standoff distance, (c)
polyvinyl chloride film surface.
drop shape analysis (HPDSA) technique in line with the early work26. Hence, the contact angle of the coating
surface was 152° ± 3° with hysteresis 5° ± 2°. In addition, the contact angle of as received polyvinyl chloride film
was measured as 82° ± 2° with contact angle hysteresis 41° ± 3°. The coating texture topology and dust particle
adhesion on hydrophobic/hydrophilic surfaces are obtained using an atomic force microscope (AFM/SPM)
probe with the friction mode.
A fixture with two-axes freedom was built via using a 3D printer. The fixture accommodates both the circular
sample holder and the loudspeaker with foam insulation in between them. Figure 1 shows the optical image. The
loudspeaker (Edifier Inc.) operating at 9 V (DC) and 0.44 A was used to generate the sound waves at various
frequencies. To minimize the mechanical disturbance of the polyvinyl chloride film by the loudspeaker mechani-
cal vibration, vibration-reducing foams were used to isolate the loudspeaker from the polyvinyl chloride film
holder. An accelerometer was incorporated ensuring the frequency measurement of polyvinyl chloride film
during the sonic excitation by the loudspeaker at various frequencies. Initially, many tests were conducted secur-
ing the measurement repeatability and fixture stability at various frequencies of the sonic excitations. A high-
speed camera (Speed Sense 9040) was utilized monitoring film oscillations when subjected to the sonic excitations
and the movement of the repelled dust particles from the film surface. In the dust particles repelling experiments,
Scientific Reports | (2020) 10:19348 | https://doi.org/10.1038/s41598-020-76418-2 3
Vol.:(0123456789)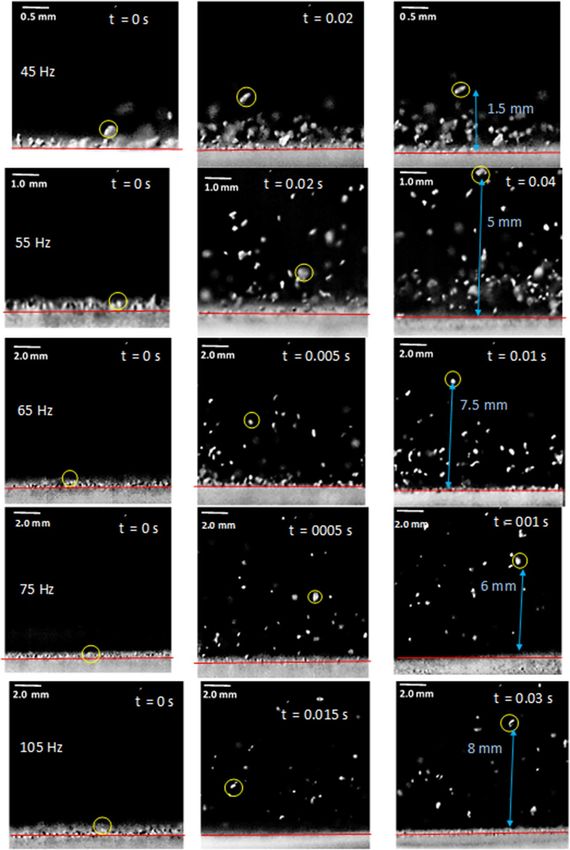
www.nature.com/scientificreports/
the dust layer of almost 150 µm was deposited onto the polyvinyl chloride film surface. Initially, many tests were
carried out calibrating the film response to the sonic excitations and dust particles’ motion in terms of vertical
and lateral motions. The tracker program was used to evaluate the dust particle dynamics from the recorded
data. The high-speed records were obtained at 5,000 frames-per-second (fps) at a resolution of 1280 × 800 pixels.
The pixel size of the images was 14 µm × 14 µm. The repeatability of the recording tests was assessed and the
standard error estimated was in the order of 3%. The uncertainty (± u) of the measurements was evaluated
incorporating the data measured (vertical and horizontal repelling heights of the particles).
The confidence level
xn
of 95% was ensured basing the data repeatability. The uncertainty (σu) is27: σu = xo (x − µe )2 p(x)dx , here,
µe represents the mean/expected value of variable x, n corresponds to the number of points in the recorded data
set, and p(x) resembles the probability distribution function. The probability distribution function was fitted in
a Gaussian-function, which enabled to estimate the probability distribution function diameter. The standard
uncertainty was obtained using the Gaussian fitting function. The number of pixels contributing to the cross-
correlation-peak was normalized for consistency of the recorded data in terms of pixels. The bias error was
estimated to be about 0.5 pixels because of the complexity of the evaluation of small peaks in terms of sizing in
the probability distribution function. The standard uncertainty was evaluated as 3%.
Dust was gathered from photovoltaic surfaces using soft brushes and kept in sampling bottles. They were
characterized by utilizing scanning electron microscopy and energy dispersive spectroscopy (JEOL 6460), and
X-ray diffraction (Bruker D8). The dust particles size distribution was evaluated using the particle size analyzer
(Malvern Panalytical, Mastersizer 3000), which enabled to classify the size of the dust particles within 10–3.5 mm
range through incorporating both red and blue light wavelengths.
Mathematical analysis
The mathematical analysis covers the film vibration under the sonic excitation and the repelled dust particle
dynamics resulted from the film vibration.
Film vibration under sonic excitations. The circular polyvinyl chloride film is located above the sonic
loudspeaker with a standoff distance (spacing between the loudspeaker and the film, Fig. 1) and sonic excita-
tion of the film gives rise to vibrational motion of the film depending on the sonic excitation frequency and the
amplitude. The film has a considerably low thickness (14 µm) and it possesses negligible flexural stiffness. The
transverse deflection of the film because of the natural frequency of vibration can be formulated from the wave
equation. It is worth to mention that the film has a circular shape and it is subjected to a nearly uniform radial
force per unit length of in-plane (radial) tensile force (T0) at the film edges. Hence using the cylindrical coordi-
nate system in line with Fig. 2, the equation governing the transverse deflection yields:
∂ 2 wn (r, θ, t)
2
1 ∂ 2 wn (r, θ, t)
2 ∂ wn (r, θ, t) 1 ∂wn (r, θ, t)
= c + · + · (1)
∂t 2 ∂r 2 r ∂r r2 ∂θ 2
Here, c = ρh T0
is the speed of propagation of the transverse wave on the film surface, ρ is the film density, t
is time, h is film thickness, wn (r, θ, t) is the transverse deflection. The boundary conditions should satisfy that,
at the edges (r = R ), wn (R, θ , t) = 0, i.e. zero transverse displacements at the film edges. In addition, initially,
the film is considered to be at rest, i.e. wn (r, θ, 0) = 0 and as the time approaches infinity time derivative of
transverse displacement approaches to zero, i.e. ∂wn∂t (r,θ,t)
= 0. The mathematical arrangement of the solution of
Eq. (1) is provided in the Supplement (S1). The solution yields:
wn (r, θ, t) = (A1 · cos(c t) + B1 · cos(c t)) · Jm ( mn r) · (A2 cos(mθ ) + B2 sin(mθ )) (2)
Here, A1, B1, A2 and B2 are constants, ω = c is the angular frequency, m = 0, 1, 2, . . .. are constants that
represent the number of diametral lines with zero deflection. Jm is the Bessel functions of zero order. The natural
frequency of the vibrating film is:
c · kmn kmn T0
fmn = c mn = = (3)
2πR 2πR ρh
Here: kmn can be obtained from the Bessel function of the first kind, m is an integer that represents the number
of circumferential lines with zero deflection and n is an integer that represents the number of diametral lines
with zero deflection. Hence, m and n can be used to characterize the modes’ shape. It is worth to mention that:
R(r) = Jm ( mn r) for m = 0, 1, . . . , n = 1, 2, . . . and mn = kmn
R and kmn is the n-th positive root of Jm.
The mode shapes of the vibrating film are also modeled numerically via solving Eq. (1) with the boundary
conditions defined at r = R then wn (R, θ, t) = 0. The Ordinary Differential Equation solver of the COMSOL
Multiphysics finite element code is used to obtain the numerical solution. Since the vibrating film has a small
thickness (low dimension as compared to its radius), it is represented as a 2D elastic film having properties given
in Table 1. In the numerical solution, a uniform radial tensile force per unit length of 1.12 is applied at the edges
of the film and the transverse deflection is constrained at the edges. The film is meshed with 5418 triangular
elements and the grid independence tests demonstrate that the number of elements leads to the converged solu-
tion of Eigenvalues.
Since the film is excited by the sound waves via a loudspeaker, the forced vibrational analysis of the film needs
to be considered. Hence, after obtaining the mode shapes of the film, a pulsating (sinusoidal) pressure is applied
at the film bottom surface resembling the sound waves emanating from the loudspeaker. Generally, sound waves
Scientific Reports | (2020) 10:19348 | https://doi.org/10.1038/s41598-020-76418-2 4
Vol:.(1234567890)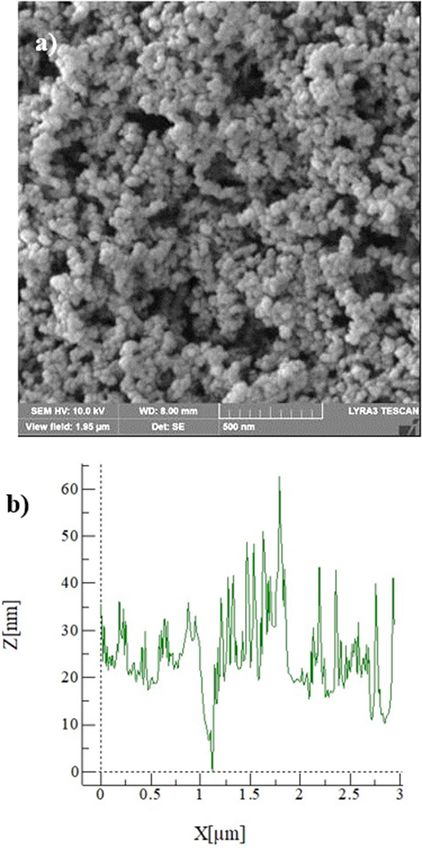
www.nature.com/scientificreports/

                                  Figure 2.  A schematic view of film: (a) coordinate system, and (b) side view of film and boundary conditions.
                                  To is in-plane (radial) tensile force, Peff is the effective pressure created by sonic excitation, and transverse
                                  deflection of film.

                                   Parameter                                   Value
                                   Film radius, R(mm)                          60
                                   Film density, ρ(kg/m3 )                     930
                                   Film thickness, h(mm)                       14 × 10−3
                                   In-plane (radial) tensile force, T0 (N/m)   1.12
                                   Elastic modulus, E(MPa)                     880
                                   Poisson’s ratio, v                          0.38

                                  Table 1.  Parameters used to compute film mode shapes.

                                  are considered to be pressure waves resulting from the change in pressure from that of ambient. The propagating
                                  sine wave can be represented as:
                                                                                           �P = �P max sin(ωt − kx)                               (4)
                                     Here, P = P − Patm is the change in pressure, P max is the amplitude (or maximum) pressure change,
                                        is the wavenumber, ω = T = 2πf is the angular frequency, x is spatial coordinate, t is time. Hence, the
                                  k = 2π                               2π
                                  transverse deflection of the film under the forced vibration, wf (r, θ, t), can be expressed as:

                                             ∂ 2 wf (r, θ, t)        ∂ 2 wf (r, θ, t) 1 ∂wf (r, θ, t)   1 ∂ 2 wf (r, θ, t)
                                         ρh                   = T0                   + ·              + 2 ·                  +�Pmax sin(2πft) (5)
                                                   ∂t 2                    ∂r 2       r     ∂r         r          ∂θ 2

                                     Since the experiment is carried out at low-frequency ranges, the vibrational mode (0,1) dominates and the
                                  solution to wf (r, θ, t) can be considered to be axisymmetric. Hence, Eq. (5) becomes a function of r and θ , i.e.:

Scientific Reports |   (2020) 10:19348 |                     https://doi.org/10.1038/s41598-020-76418-2                                               5

                                                                                                                                              Vol.:(0123456789)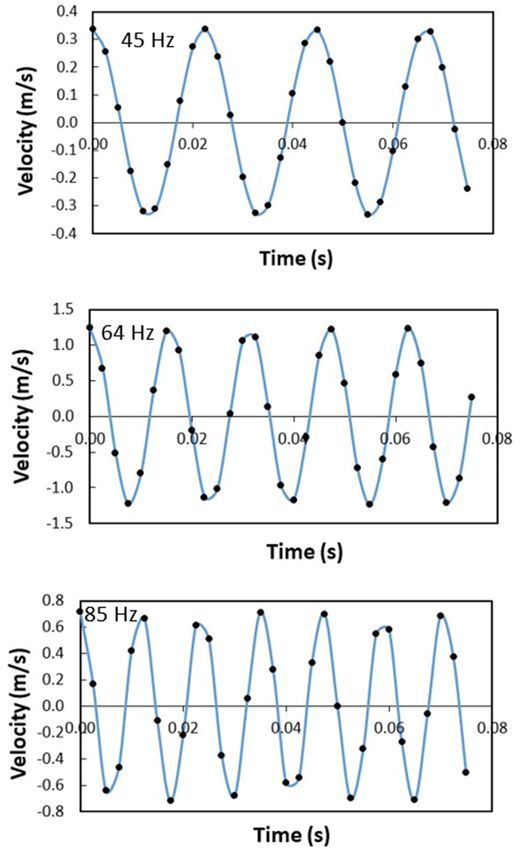
www.nature.com/scientificreports/
Figure 3. Schematic view of polyvinyl chloride film surface, coordinate system and dust particle trajectory.
∂ 2 wf (r, t) ∂ 2 wf (r, t) 1 ∂wf (r, t) 1 ∂ 2 wf (r, t)
ρh = T0 + · + 2 · + �Pmax sin(2πft) (6)
∂t 2 ∂r 2 r ∂r r ∂θ 2
The conditions to be satisfied for the solution of Eq. (6) are: wf (R, 0) = 0 and ∂w(R,0)
∂t = 0 at t = 0.
The exact solution of Eq. (6) can be expressed as28:
∞
�Pmax c 2 J0 ωrc 2�Pmax ωc sin(cαs t)J0 (rαs )
wf (r, t) = sin(ωt) − 1 − (7)
ω2 T0 J0 ωR 2 (ω2 − c2 α 2 )J ′ (rα )
c
αT 0 α s s 0 s
s=1
2
Here, s = 1, 2, . . ., αs are the roots of J0 (az) = 0, I0 (z) = 1 + 2z 2 + · · ·, I0 (iz) = J0 (z), and I0′ (iz) = −iJ0 ′ (z).
Because of the consideration of consistency of numerical vibrational mode assessment of the film, the film
displacement is also predicted numerically by solving Eq. (6) incorporating the conditions. The COMSOL Mul-
tiphysics Differential Equation Solver is used to solve Eq. (6). The vibrating film has a low thickness and it is
represented as a 2D elastic film with properties given in Table 1. In addition, a sinusoidally varying force (source
term), �Pmax sin(2πft) is introduced from the film bottom surface. The transverse deflection is constrained at
the edges and the film is meshed with 5418 triangular elements. The grid independence tests are carried out
securing the grid-independent results.
Dynamic analysis of repelling dust particles. The dust particles are repelled from the film surface
under the influence of film acceleration because of the sonic excitations. The inflight particle (repelled dust
particles from the film surface) motion can be presented in the spherical coordinate system (r, θ , φ, t ). Figure 3
shows schematically the film and inflight particle in the coordinate system. The formulation of the forces acting
on the inflight particle is given in the Supplement (S2). Hence, the forces acting on the inflight dust particle at
the onset of repelling from the film surface are:
2
2
d2 r dφ 2 dθ dr
Fr = m −r sin φ − r = −mgcosθ − D + Fac (8)
dt 2 dt dt dt
d2 θ d2 φ
dr dθ dθ
Fθ = m 2 · + r 2 − r 2 cosθ · sinθ = −mgsinθcosφ − D (9)
dt dt dt dt dt
d2 φ
dr dφ dφ dθ dφ
Fφ = m 2 · sin θ + r 2 sin θ + 2r · cosθ = −mgsinθsinφ − D (10)
dt dt dt dt dt dt
Here, Fi is the inertia force, m is the particle mass, D is the drag force term according to Stokes’ hypothesis,
dp is the particle diameter, and Fac is the acoustic force term. Moreover, the airflow around the dust particle occurs
at low Reynold number (Re) and the Stokes’ hypothesis can be adopted formulating the drag force, i.e.:
D = 3πµdp . In addition, the acoustic radiation force on a particle moving d3
in a viscous fluid is formulated
previously29 and this formulation is used. The acoustic force yields Fac = π 8p kfEac , here k is the wave number,
2 is acoustic energy density and k is the dipole scattering coefficient. The dipole scattering coef-
Eac = 2ρ1 c2 prms
0 0
6(1−ρ)2 (1+δ)δ ρp
ficient is taken as: f = 81 , where, ρ = is the particle-to-air density ratio and δ = δb
(1+2ρ)2 +9(1+2ρ)δ+ 4
ρa rp
2 δ 2 +δ 3 + δ2
Scientific Reports | (2020) 10:19348 | https://doi.org/10.1038/s41598-020-76418-2 6
Vol:.(1234567890)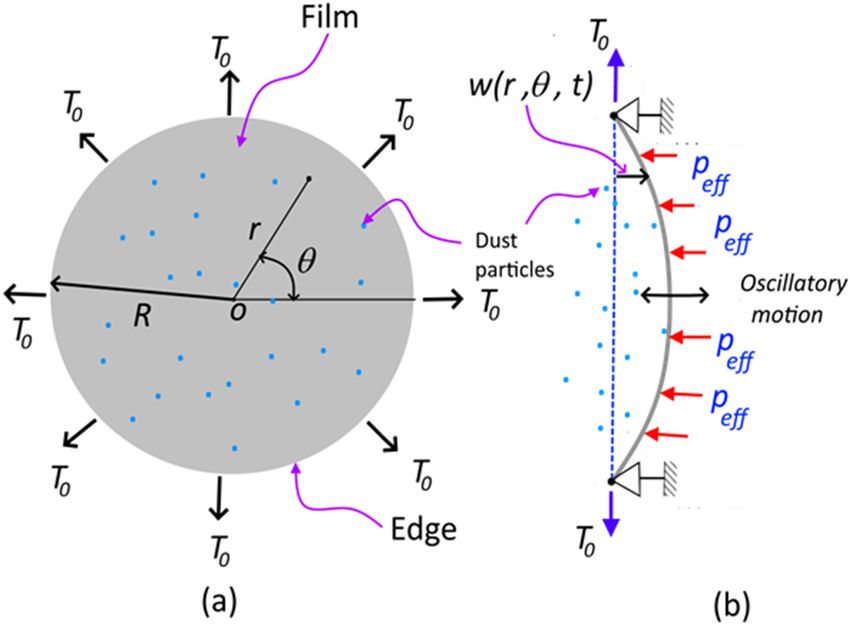
www.nature.com/scientificreports/
Parameter Value
1.2
kg
Density of air, ρ m3
2800
kg
Density of particle, ρp m3
Large Particle diameter, dp (mm) 0.1732
Initial radial position, r0 (mm) 200
Initial rotation angle, θ0 5°
Initial tilt angle, φ0 5°
Adhesion force, Fad 2 × 10⁻¹² N
Table 2. Parameters used in the particle dynamic analysis.
is the ratio of boundary layer and particle radius. The boundary layer developed on a spherical particle can be
4.53d
obtained from δb = √ p 29. The force term in Eqs. (8–10) can be formulated in terms of particle mass and
Re 2
d2 r 2
acceleration, i.e.: mp dt 2 , mp ddt 2θ , mp ddtφ2 , where mp is the particle mass. In consistency with the solutions for the
film vibrational motion, the numerical solution of Eqs. (8–10) can obtained using the Differential Equation solver
of COMSOL Multiphysics finite element code. It is worth to mention that the second order Euler backward dif-
ference scheme is used to discretize the equations and the nonlinear solution is obtained with the aid of the
Newton-Rapson method. Since the accuracy of the predictions is limited by the selection of the time increment,
the time step is set at 10−8 s in the numerical simulations. Table 2 gives the parameters used in the simulations.
Results and discussion
Environmental dust characteristics and dust particles mitigation from transparent polyvinyl chloride film are
examined. The mechanisms of the dust particles repelling via sonic excitation are explored and the dynamics of
the repelled particles are formulated. The findings of the repelled particle heights are compared with their coun-
terparts obtained from the experiments. The optical transmittance of the dust mitigated surfaces is also evaluated.
Dust and surface characteristics. Figure 4a shows SEM microimages and Fig. 4b depicts the AFM line
scan of the hydrophobized film surface. The silica particles have sizes almost 30 nm (Fig. 4a) and form a clus-
tered layer on the sample surface. Small texture height is noted along the line scan (Fig. 4b) and the average
roughness is about 40 nm. The peaks and valleys in the texture of the surface (Fig. 4b) demonstrates that silica
particles clustered while forming small peaks on the surface, which creates a Lotus effect on the liquid droplets
while reducing droplet contact angle hysteresis. The coated surface wetting is measured and the contact angle
of the coated surface is about 150° ± 2° and hysteresis is 4° ± 2°, i.e. coating surface demonstrates superhydro-
phobic identity. On the other hand, dust is collected from PV panel surfaces in Dhahran, Saudi Arabia, and
characterization tools are used to evaluate particle size, shapes, and elemental constitutes. Figure 5a,b show SEM
microimages of dust particles while Fig. 5c shows dust particle distribution. Dust have different shapes and sizes
(Fig. 5a). In addition, particularly, small particles agglomerate forming the clusters (Fig. 5b). The agglomeration
and adherence of small particles are because of ionic forces formed on these particles. Elemental constitutes
obtained from EDS analysis demonstrate that dust retains several elements, such as Si, Na, Ca, K, S, Fe, Cl, and
O (Table 3). The quantification of elemental constitutes does satisfy the stoichiometric ratio for small particles
(2 µm ≤) particularly alkaline salt components (NaCl and KCl) as observed in Table 3, which is also reported in
the earlier work17. This2 contributes to dust agglomeration (Fig. 5b). Dust shapes can be evaluated based on the
shape factor ( Ash2 = 4π A , where P is perimeter of the dust particle and A is area of dust cross-section) and aspect
P
ratio ( As = π(L l)
4A , here Ll is the largest projection length)30. The microscopic methods are utilized to determine
the feature of dust geometry. The shape factor, mostly, ranges from 0.5 to 3. and one corresponds to dust with
the almost circular feature. There is no clear distribution of shape factor with a range of dust sizes of 2–5 µm. As
dust becomes greater than 5 µm, the shape factor becomes almost 3. However, it becomes almost one for small
size dust (≤ 0.8 µm). The aspect ratio varies considerably with dust sizes and aspect ratio approaches almost one
for small size dusts ((≤ 0.8 µm). In addition, a simple mathematical expression correlating the shape factor and
the aspect ratio in terms of dust sizes could not obtained. The particle size of the dust varies in micrometer to
nanometer ranges with an average of 1.2 µm (Fig. 5c). Figure 6 demonstrates the X-ray diffraction data for dust.
The salt compounds (NaCl and KCl), calcite, silica peaks are apparent. The peaks of iron and silicon overlap and
sulfur peak could be anhydrite or gypsum (CaSO4) while iron (Fe) peak corresponds to clay-aggregated hema-
tite (Fe2O3). Moreover, dust adhesion on coated sample surfaces is calculated adopting the technique developed
earlier31. The AFM probe deflection in friction mode is utilized determining the dust particle adhesion on the
sample surface. Hence, F = kσd �V , here k is spring constant (N/m) of probe tip, σd is slope of probe deflection
(Δz/ΔV, m/V), and ΔV is probe output recorded (mV) onset of deflection. The AFM probe used has the charac-
teristics of kσd = 5.80275 × 10⁻¹⁵ N/mV. The particle of about 0.9 µm size on the hydrophilic sample surface (as
received), the output probe voltage is recorded as 380 mV and equation (F = kσd �V ) yields the adhesion force
of 2.21 × 10⁻¹² N. Similarly, for about 8 µm size particle, the probe output is 320 mV, which yields the adhesion
force of 1.86 × 10⁻¹² N. Hence, the adhesion force increases almost 16% as the particle size reduces from 8 to
0.9 µm, which demonstrates the increased adhesion of small particles on the sample surface. The adhesion force
calculations are repeated for the hydrophobized sample surfaces. The probe output reading for 0.9 µm size par-
ticle on the hydrophobized (coated) sample surface is 205 mV, which gives the adhesion force of 1.45 × 10⁻¹² N,
Scientific Reports | (2020) 10:19348 | https://doi.org/10.1038/s41598-020-76418-2 7
Vol.:(0123456789)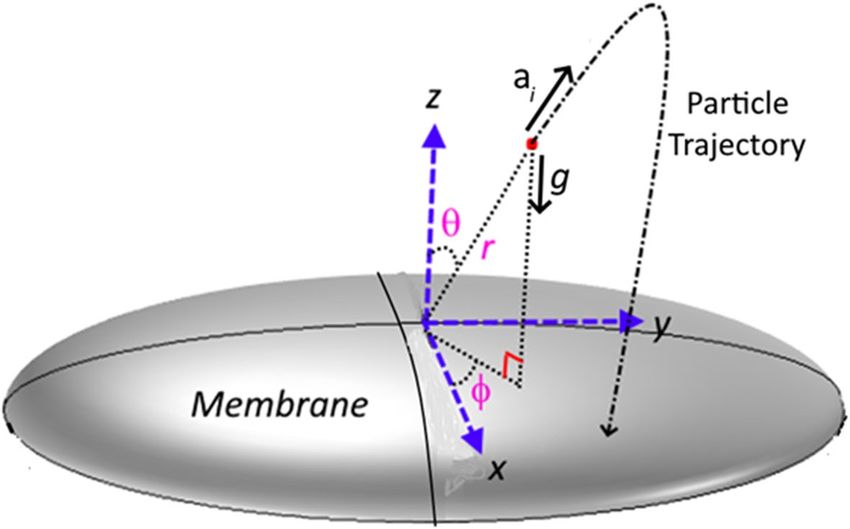
www.nature.com/scientificreports/

                                            Figure 4.  SEM image of coating surface and line scan: (a) SEM micrograph, and (b) AFM line scan of coating
                                            surface.

                                            and for 10 µm size particle on coated sample surface yields the probe output of 170 mV, i.e. the adhesion force
                                            for 10 µm size particle is 0.98 × 10⁻¹² N. Therefore, hydrophobizing the sample surface reduces the particle adhe-
                                            sion force by almost 35% for 0.9 µm particle and about 47% for 8 µm particle. Consequently, hydrophobizing
                                            the surface becomes more effective towards reducing the particle adhesion on the surfaces, particularly for large
                                            size particles. Adhesion force experiments are repeated 10 times to secure accurate data. The standard deviation

          Scientific Reports |   (2020) 10:19348 |               https://doi.org/10.1038/s41598-020-76418-2                                                 8

Vol:.(1234567890)
www.nature.com/scientificreports/
Figure 5. SEM micrograph of dust particles: (a) various size and shapes dust particles, (b) clustered small size
dust particles, and (c) size distribution of dust particles.
Size Si Ca Na S Mg K Fe Cl O
Collected ≥ 1.2 μm 11.8 8.3 2.2 1.3 2.5 0.8 1.2 0.4 Balance
Collected < 1.2 μm 10.2 7.3 2.7 2.5 1.3 1.2 1.1 1.1 Balance
Table 3. Elemental composition of dust particles (wt%).
Scientific Reports | (2020) 10:19348 | https://doi.org/10.1038/s41598-020-76418-2 9
Vol.:(0123456789)www.nature.com/scientificreports/
Figure 6. X-ray diffractogram of dust.
−2
1
N
of the data points due to repeatability ( s = N−1 i=1 (xi − x) , where N is the number of repeats, xi is the
−
output recorded (mV), x is the mean value of probe output) is estimated at about 7%.
Dynamics of repelling dust particles. The polyvinyl chloride (PVC) circular thin film with 14 µm thick-
ness is excited by the sonic waves (sonic radiation) within 35–300 Hz and 80–100 dB amplitude from the bot-
tom of the film while the particles are located on the top surface of the film (Fig. 1). The film possesses very
negligible flexural stiffness and the mode of deflection of the film can be obtained from Eqs. (2) and (3). Moreo-
ver, initially, the assessment of the mode of film vibration is carried out both numerically (Eqs. 2 and 3) and
experimentally. Figure 7a shows the mode of vibration of the film at two different sonic excitation frequencies
(64 Hz and 104 Hz) while Fig. 7b depicts the corresponding modes obtained from the experiments. Tables 4
and 5 give the data for the mode of shapes and natural frequencies of film vibration. At low excitation frequen-
cies (45 Hz–85 Hz), single-mode results while at high excitation frequency four-mode results. Since the dust
particles have small sizes, the mode of film vibration results in the clustering of the dust particles on the film
surface (Fig. 7b). The transverse displacement (along the y-axis) of the film surface is evaluated experimentally
using high speed camera data incorporating the tracker program at low frequencies one mode shape (1,0) of the
film vibration (Fig. 7b). Figure 8 shows the transverse displacement of the film surface with different excitation
sound frequencies and resulting sound power. The displacement remains maximum for the frequency of 64 Hz
because of the resonant frequency. To evaluate the effect of the location of the sound excitation reference to the
film location (standoff distance), various tests are conducted. Figure 9 shows the sound power variation with
the frequency. The local peak sound power occurs at a frequency of 64 Hz. Further tests are carried out to assess
the influence of the input voltage of the sound wave generator on the dynamic characteristics of the film. Table 6
gives the data for film dynamic characteristics. In addition, the amplitude of film vibration at various frequencies
is also obtained from the analytical (Eq. 7) and numerical (Eq. 6, COMSOL simulations) approach and the values
are included in Table 6. The findings reveal that the input voltage of 8.4 V for loudspeakers with d = 30 mm stand-
off distance (Fig. 1) results in the maximum sound power, which is used for dust mitigation study, i.e. the sound
power 104.9 dB is resulted (Table 6). Moreover, the velocity of the film in the transverse direction is determined
from experiments and the findings are shown in Fig. 10. To evaluate the influence of sonic excitation frequency
on the film transverse velocity, three frequencies are included in Fig. 10 for comparison. The velocity of the film
in the transverse direction follows the oscillatory motion of the film with the same frequency. The maximum
amplitude of the transverse velocity is about 1 m/s, which occurs at 64 Hz of the external excitation frequency.
It is worth mentioning that the sound power is the maximum for 64 Hz excitation frequency with a standoff
distance of 30 mm (Table 6).
Under the sonic excitation, rapid displacement of the film causes dust particle acceleration. The trajectory of
the repelled particles are formulated through Eqs. (8–10) and predicted using Differential Equation solver (DE)
of COMSOL multi-physics code. Figures 11 and 12 show the temporal behavior of the inflight particle vertical
(Fig. 11) and horizontal heights (Fig. 12) obtained from the experimental data using the tracker program (incor-
porating the high-speed recorded data for hydrophilic surface) and predicted from the numerical simulations,
at which the particle is located at (200, 5.74°, 5°) on the film surface for four sonic excitation frequencies (45 Hz,
64 Hz, 75 Hz, and 104 Hz), respectively. Here, the coordinate system (r, θ , φ ) is according to Fig. 3. It is worth to
mention that as the particle acceleration reaches a value that takes over the adhesion and weight of the particle,
the particle can depart from the film surface. The vertical height of the inflight dust particle follows a parabolic
rise and fall with time. This is because of the force balance between the particle inertia, gravity, and drag forces.
Scientific Reports | (2020) 10:19348 | https://doi.org/10.1038/s41598-020-76418-2 10
Vol:.(1234567890)www.nature.com/scientificreports/
Figure 7. Mode of vibration at two sonic excitation frequencies (64 Hz and 104 Hz): (a) predictions, and (b)
experimental.
(m,n) n=0 n=1 n=2
m=1 2.4048 3.8317 5.1356
m=2 5.5204 7.0155 8.4172
m=3 8.6537 10.1735 11.620
Table 4. Possible modes shapes for film vibration. The numbers represent coefficients obtained from the
Bessel function.
Natural frequencies
Vibration modes Experimental Analytical Numerical
(1,0) 64.0 ± 5 63.79 63.79
(1,1) 104.0 ± 5 101.64 101.64
(1,2) 124.0 ± 5 136.23 136.24
(2,2) – 146.43 146.46
Table 5. Predicted natural frequencies of film vibration.
The gravitational force over the drag force of the dust particle is in the order of 1 0−3 which demonstrates that the
gravitational force has a major influence on the inflight particle deceleration with time. The maximum vertical
height of the inflight dust particle occurs at about 0.02 s from its departure for 45 Hz excitation; however, the
Scientific Reports | (2020) 10:19348 | https://doi.org/10.1038/s41598-020-76418-2 11
Vol.:(0123456789)www.nature.com/scientificreports/
Figure 8. Transverse displacement of film with sonic excitation frequency.
Figure 9. Sound power resulted on film with sonic excitation frequency.
horizontal location continues to increase with time for a longer duration (0.1 s). Moreover, as the excitation
frequency changes, the time occurrence of the maximum vertical displacement differs, i.e. 0.1 s for 64 Hz and
0.08 s for 104 Hz of excitations. This indicates that the inflight time of the repelled particle remains longer in
the air for 64 Hz excitation. Hence, the repelled particle trajectory has two-stages such that in the first stage, the
particle rises both vertically and horizontally under the influence of the sonic excitation while in the second stage
the particle follows a falling trend from its maximum vertical height. This allows the repelled particles landing
on the film surface significantly away from their repelling locations on the film, which becomes more appar-
ent for 64 Hz of sonic excitation. This indicates that the particle can be removed from surface of the film while
creating the multiple sonic excitations. For inflight particle velocity, the horizontal component of the particle
increases while the vertical velocity component becomes zero at the maximum peak location, particularly at
64 Hz excitation frequency. As comparing the experimental findings with the predictions of the inflight particle
heights in vertical and horizontal directions, both results are in good agreement. The small differences are because
of the experimental errors (7%) and the consideration of uniform density particles, which may change slightly
from particle to particle because of varying elemental composition (Table 3). Nevertheless, both findings are
Scientific Reports | (2020) 10:19348 | https://doi.org/10.1038/s41598-020-76418-2 12
Vol:.(1234567890)www.nature.com/scientificreports/
Measured Pressure
Sound Power amplitude Film vibrating amplitude (mm)
Frequency Angular Freq. Distance Amplitude
Case # (Hz) (rad/s) (mm) Damping (V) Mode (m,n) dB Pa Experimental Analytical Numerical
1 35 219.91 30 No 8.4 – 81.6 0.34 1.249 1.16 0.8
2 45 282.74 30 No 8.4 – 88.6 0.76 1.190 1.1 0.95
3 55 345.58 30 No 8.4 – 101.2 3.25 2.879 2.81 2.75
4 64 402.12 30 No 8.4 (1,0) 104.9 5 3.092 3.01 3.3
5 64 402.12 50 No 8.4 (1,0) 103.8 4.40 2.800 2.71 3
6 64 402.12 70 Yes 8.4 (1,0) 95.6 1.71 1.020 – –
7 64 402.12 70 No 8.4 (1,0) 101.3 3.30 2.170 2.01 2.3
8 64 402.12 70 No 5.6 (1,0) 99.9 2.80 1.890 1.71 2
9 64 402.12 70 No 2.8 (1,0) 92.9 1.25 0.910 0.75 1.02
10 75 471.24 30 No 8.4 – 99.4 2.65 2.060 – –
11 85 534.07 30 No 8.4 – 98.4 2.36 1.343 – –
12 95 596.90 30 No 8.4 – 87.8 0.69 1.714 – –
13 104 653.45 30 No 8.4 (1,1) 95.9 1.77 1.970 – –
14 114 716.28 30 No 8.4 – 94.5 1.51 2.000 – –
15 124 779.11 30 No 8.4 – 86.3 0.58 0.164 – –
16 134 841.95 30 No 8.4 – 93.7 1.37 0.091 – –
17 300 1884.96 30 No 8.4 – 92.6 1.21 0.182 – –
Table 6. Film vibration characteristics under sonic excitation.
in agreement. Figure 13a,b show an optical image of the inflight particles at various times and different sonic
excitation frequencies for hydrophilic and hydrophobic film surfaces, respectively. The tracking of a particle
at different time steps is marked in Fig. 13a,b. It can be observed that at low (45 Hz) and high (105 Hz) sonic
excitation frequencies, the heights of the inflight particles are lower than that of the 64 Hz. In addition, at these
frequencies, some particles remain on the film surface, i.e. particle inertia force remains less than the adhesion
and weight forces of the particles. This situation can also be seen from Fig. 14a,b, in which the temporal variation
of horizontal and vertical heights of the inflight dust particle is shown for various sonic excitation frequencies. In
the case of the hydrophobic surfaces, vertical and horizontal heights of the dust particles change. Figure 15 shows
the temporal variation of horizontal and vertical heights of the inflight particle at the initial location (200, 5.74°,
5°) on the hydrophilic and hydrophobic film surfaces for different sonic excitation frequencies (45 Hz, 64 Hz,
and 75 Hz). It is worth to note that inflight particle heights are obtained experimentally. The inflight particle
height on the hydrophobic film becomes larger than its counterpart corresponding to the hydrophilic surface
at low excitation frequency 45 Hz. As the excitation frequency increases, the inflight particle height difference
becomes small along the vertical line (normal to the film surface); however, some small decrease in the horizontal
height of the particle is observed for the hydrophobic surface. Nevertheless, the inflight particle heights in both
vertical and horizontal directions become similar to whether the particle is initially located on the hydrophobic
or hydrophilic film surfaces as excitation frequency increases to 64 Hz. This is attributed to the inertial force
generated on the particle located on the film surface. As the frequency reduces (45 Hz), the film displacement
and velocity reduce significantly in vertical and horizontal directions. This lowers the inertial force created on
the particle to be repelled from the film surface. Hence, at low excitation frequency, the influence of the particle
adhesion force on the particle acceleration becomes critically important on the particle inflight dynamics for the
case of the hydrophobic surface. As the excitation frequency increase 64 Hz, the inertial force generated on the
particle becomes much larger than the adhesion force. Therefore, the inflight dynamics of the repelled particle
becomes independent of the surface wetting characteristics, i.e. hydrophobic or hydrophilic.
The optical transmittance of the hydrophobic and hydrophilic film surfaces is carried out after the dust repel-
ling experiments incorporating the sonic excitations. It is worth to mention that the duration of the experiment
is kept 20 s for hydrophobic and hydrophilic surfaces. The relative optical transmittance is evaluated adopting
T −T
the transmittance ratio, i.e. the relative transmittance (Trel) is: Trel = film T cleaned , here Tfilm is the optical transmit-
film
tance of the film, Tcleaned is optical transmittance of the film after the dust is repelled. Table 7 gives the transmit-
tance ratio at 64 Hz of sonic excitation for hydrophobic and hydrophilic film surfaces. The relative transmittance
is almost in the order of 57% for hydrophilic surface and it becomes higher (87%) for the hydrophobic surface.
The relative transmittance is higher for hydrophobic surface than hydrophilic surface after dust mitigation by
sonic excitation. It is worth to mention that the optical transmittance of hydrophobic sample is about 90% of
clean (none-dust settled) sample for the wavelength range 600 nm 800 n m21. Hence, the use of hydrophobic
surface improves the overall optical transmittance of the samples after dust mitigation via sonic excitation.
Scientific Reports | (2020) 10:19348 | https://doi.org/10.1038/s41598-020-76418-2 13
Vol.:(0123456789)www.nature.com/scientificreports/
Figure 10. Film velocity with time at different sonic excitation frequencies. The standoff distance is 30 mm.
Scientific Reports | (2020) 10:19348 | https://doi.org/10.1038/s41598-020-76418-2 14
Vol:.(1234567890)www.nature.com/scientificreports/
Figure 11. Vertical displacement (height) of inflight dust particle (repelled) predicted from numerical
simulations and obtained from experiment. The dust particle initial location on the film surface is (200, 5.74°,
5°).
However, a care must be taken to use the hydrophobic coating on the optically transmitting surfaces because of
almost 10% reduction in the optical transmittance after hydrophibizing the surface occurs21. Hence, hydropho-
bizing of surfaces lowers the optical transmittances in none-dusty regions; however, it improves overall optical
transmittance as the samples surfaces being subjected to regular heavy dust depositions. Moreover, the attainment
of a low ratio of optical transmittance is because of the mode of film vibration at 64 Hz, which generates a single-
mode and repelled dust particles in the outer region of the film moves towards the film center with multiple
excitations during 20 s. Nevertheless, as the film surface tilted more than 30° about the vertical axis, the transmit-
tance ratio is expected to increase significantly.
Conclusion
Dust repelling from transparent polyvinyl chloride film under sonic excitation is examined in relation to dust
mitigation from transparent surfaces. An experimental rig is designed and built evaluating the dynamics of
the repelling dust particles from the film surface. Environmental dust particles adhesion on hydrophilic and
hydrophobic surfaces are evaluated through atomic force microscopy. The film surface is hydrophobized via
dip-coating by the functionalized nano-silica particles. High-speed monitoring system and the tracker program
are used to measure the vertical and horizontal heights of the infight dust particles for various frequencies of the
sonic excitation. The flexural characteristics of the film due to applied sonic power are formulated and the mode
of film vibration is determined for different sonic power frequencies. The trajectory of dust particles emanating
from the film surface is formulated in a spherical coordinate system and the resulting equations are solved using
COMSOL Differential Equation solver. The findings of the dynamic characteristics of the inflight dust particles
Scientific Reports | (2020) 10:19348 | https://doi.org/10.1038/s41598-020-76418-2 15
Vol.:(0123456789)www.nature.com/scientificreports/
Figure 12. Horizontal displacement (height) of inflight dust particle (repelled) predicted from numerical
simulations and obtained from experiment. The dust particle initial location on the film surface is (200, 5.74°,
5°).
are compared with those of the experimental counterparts. It is demonstrated that the inflight dust particles
heights along the vertical and horizontal directions agree with those of the experimental findings. The film dis-
placement and transverse velocity become the maximum for the excitation frequency of 64 Hz with the standoff
distance between the film and the sonic excitation source of 30 mm. In this case, the film vibration results in a
single principle vibration mode (0,1), which occurs at the film center. Hydrophobizing the film surface lowers
the dust particle adhesion considerably; hence, adhesion force reduces by almost 35% for 0.9 µm particle and
about 47% for 8 µm particle. The vertical height of the dust particle is higher for excitation frequency of 64 and
reducing the excitation frequency to 45 Hz or increasing to 104 Hz, vertical height reduces significantly. The
inflight particle displacement is large in both vertical and horizontal axes, which implies that the particles from
the film surface can be repelled away from the film. Hence, sonic excitation can mitigate the dust particles from
the transparent polyvinyl chloride surface under a proper selection of the standoff distance and the frequency of
the excitation. The hydrophobic surface provides longer repelling distances for dust particles under low (55 Hz)
Scientific Reports | (2020) 10:19348 | https://doi.org/10.1038/s41598-020-76418-2 16
Vol:.(1234567890)www.nature.com/scientificreports/
Figure 13. (a) Optical images of repelled dust particles on hydrophilic surface at different frequencies and
times. (b) Optical images of repelled dust particles on hydrophobic surface at different frequencies and times.
Scientific Reports | (2020) 10:19348 | https://doi.org/10.1038/s41598-020-76418-2 17
Vol.:(0123456789)www.nature.com/scientificreports/
Figure 13. (continued)
Scientific Reports | (2020) 10:19348 | https://doi.org/10.1038/s41598-020-76418-2 18
Vol:.(1234567890)www.nature.com/scientificreports/
Figure 14. Repelled dust particles vertical and horizontal heights obtained from experiments: (a) vertical
height, and (b) horizontal height. Dust particle initial location on film is (200, 5.74°, 5°).
and high (75 Hz) frequency sonic excitations. This is because of low inertia force generated on the dust particle,
which is comparable to the force of adhesion of the particle. However, as the sonic excitation frequency is set
at 64 Hz, the inertia force generated on the dust particle becomes considerably larger than the adhesion force.
Hence, the height of the inflight dust particle does not influence notably with the adhesion force. Dust mitigation
Scientific Reports | (2020) 10:19348 | https://doi.org/10.1038/s41598-020-76418-2 19
Vol.:(0123456789)www.nature.com/scientificreports/
Figure 15. Vertical and horizontal displacement of dust particles on hydrophobic and hydrophilic surfaces with
time at different sonic excitation frequencies. Dust particle initial location on film surface is (200, 5.74°, 5°).
Surface type Transmittance ratio
Hydrophilic 0.57
Hydrophobic 0.78
Table 7. Transmittance ratio for hydrophilic and hydrophobic film surfaces after dust repelling.
by the sonic excitation improves the optical transmittance of the dusty surface while indicating that the sonic
excitation can be effectively used for dust removal from the transparent film surfaces.
Received: 30 August 2020; Accepted: 7 October 2020
References
1. Chen, Y. et al. Experimental study on the effect of dust deposition on photovoltaic panels. Energy Procedia 158, 483–489 (2019).
2. Alghamdi, A. S., Bahaj, A. S., Blunden, L. S. & Wu, Y. Dust removal from solar PV modules by automated cleaning systems. Ener-
gies 12, 2923 (2019).
3. Alizadehyazdi, V., Modabberifar, M., Mahmoudzadeh Akherat, S. M. J. & Spenko, M. Electrostatic self-cleaning gecko-like adhe-
sives. J. R. Soc. Interface 15, 20170714 (2018).
Scientific Reports | (2020) 10:19348 | https://doi.org/10.1038/s41598-020-76418-2 20
Vol:.(1234567890)www.nature.com/scientificreports/
4. Yilbas, B. S. et al. environmental dust particles repelling from a hydrophobic surface under electrostatic influence. Sci. Rep. 9, 1–18
(2019).
5. Moharram, K. A., Abd-Elhady, M. S., Kandil, H. A. & El-Sherif, H. Influence of cleaning using water and surfactants on the per-
formance of photovoltaic panels. Energy Convers. Manag. 68, 266–272 (2013).
6. Mei, X., Zhang, T. & Wang, S. Experimental investigation of jet-induced resuspension of indoor deposited particles. Aerosol Sci.
Technol. 50, 230–241 (2016).
7. Hassan, G., Yilbas, B. S., Al-Sharafi, A. & Al-Qahtani, H. Self-cleaning of a hydrophobic surface by a rolling water droplet. Sci. Rep.
9, 5744 (2019).
8. Zhang, Q., Lu, X. & Hu, J. A solar panel cleaning system based on a linear piezoelectric actuator. in 2013 Symposium on Piezoelec-
tricity, Acoustic Waves, and Device Applications 1–4 (IEEE, 2013).
9. Verhaagen, B., Zanderink, T. & Rivas, D. F. Ultrasonic cleaning of 3D printed objects and Cleaning Challenge Devices. Appl. Acoust.
103, 172–181 (2016).
10. Attia, O. H., Adam, N. M., As’arry, A. & Rezali, K. A. M. Removal of Dust from the Solar Panel Surface using Mechanical Vibrator.
in Journal of Physics: Conference Series vol. 1262 12021 (IOP Publishing, 2019).
11. Alagoz, S. & Apak, Y. Removal of spoiling materials from solar panel surfaces by applying surface acoustic waves. J. Clean. Prod.
253, 119992 (2020).
12. Vasiljev, P., Borodinas, S., Bareikis, R. & Struckas, A. Ultrasonic system for solar panel cleaning. Sens. Actuators A Phys. 200, 74–78
(2013).
13. Lais, H., Lowe, P. S., Gan, T.-H. & Wrobel, L. C. Numerical modelling of acoustic pressure fields to optimize the ultrasonic cleaning
technique for cylinders. Ultrason. Sonochem. 45, 7–16 (2018).
14. Al-Badra, M. Z., Abd-Elhady, M. S. & Kandil, H. A. A novel technique for cleaning PV panels using antistatic coating with a
mechanical vibrator. Energy Rep. 6, 1633–1637 (2020).
15. Seiffert, G., Hopkins, C. & Sutcliffe, C. Comparison of high-intensity sound and mechanical vibration for cleaning porous titanium
cylinders fabricated using selective laser melting. J. Biomed. Mater. Res. Part B Appl. Biomater. 105, 117–123 (2017).
16. Deshmukh, N. N. & Yadav, A. Experimental and simulation studies for optimal position of different horn length in acoustic clean-
ing. In 2017 International Conference on Nascent Technologies in Engineering (ICNTE) 1–5 (IEEE, 2017).
17. Adukwu, J. E. et al. Adhesion characteristics of solution treated environmental dust. Sci. Rep. 10, 1–15 (2020).
18. Yilbas, B. S. et al. Environmental dust removal from inclined hydrophobic glass surface: avalanche influence on dynamics of dust
particles. RSC Adv. 8, 33775–33785 (2018).
19. Yilbas, B. S. et al. Influence of dust and mud on the optical, chemical and mechanical properties of a pv protective glass. Sci. Rep.
5, 1–12 (2015).
20. Yilbas, B. S. et al. Solvent-induced crystallization of a polycarbonate surface and texture copying by polydimethylsiloxane for
improved surface hydrophobicity. J. Appl. Polym. Sci. 133 (2016).
21. Hassan, G. et al. Solar energy harvesting and self-cleaning of surfaces by an impacting water droplet. Int. J. Energy Res. 44, 388–401
(2020).
22. Shaikh, A. & Deshmukh, N. Simulation and experimental study of acoustic waves for cleaning of soot in process equipments. In
International Conference on Communication and Signal Processing 2016 (ICCASP 2016) (Atlantis Press, 2016).
23. Chen, D. & Wu, J. Dislodgement and removal of dust-particles from a surface by a technique combining acoustic standing wave
and airflow. J. Acoust. Soc. Am. 127, 45–50 (2010).
24. Fuhrmann, A., Marshall, J. S. & Wu, J. Effect of acoustic levitation force on aerodynamic particle removal from a surface. Appl.
Acoust. 74, 535–543 (2013).
25. Yong, W. Y. D., Zhang, Z., Cristobal, G. & Chin, W. S. One-pot synthesis of surface functionalized spherical silica particles. Colloids
Surf. A Physicochem. Eng. Asp. 460, 151–157 (2014).
26. Heib, F. & Schmitt, M. Statistical contact angle analyses with the high-precision drop shape analysis (HPDSA) approach: basic
principles and applications. Coatings 6, 54 (2016).
27. Bhattacharya, S., Charonko, J. J. & Vlachos, P. P. Particle image velocimetry (PIV) uncertainty quantification using moment of
correlation (MC) plane. Meas. Sci. Technol. 29, 115301 (2018).
28. Carslaw, H. S. & Jaeger, J. C. Operational Methods in Applied Mathematics. vol. 123 (Oxford, 1941).
29. Settnes, M. & Bruus, H. Forces acting on a small particle in an acoustical field in a viscous fluid. Phys. Rev. E 85, 16327 (2012).
30. Reid, E. A. et al. Characterization of African dust transported to Puerto Rico by individual particle and size segregated bulk analysis.
J. Geophys. Res. Atmos. 108, 8591 (2003).
31. Butt, H.-J., Cappella, B. & Kappl, M. Force measurements with the atomic force microscope: technique, interpretation and applica-
tions. Surf. Sci. Rep. 59, 1–152 (2005).
Acknowledgements
The authors acknowledge the financial support of Deanship of Scientific Research at King Fahd University of
Petroleum and Minerals (KFUPM) through Projects# IN 171001 and King Abdullah City for Atomic and Renew-
able Energy (K.A. CARE) to accomplish this work.
Author contributions
A.A.A. did the experimental, numerical and analytical works, and contributed to the writing of the manuscript.
B.S.Y. did the research work with the collaboration of other co-authors and wrote the manuscript. H.A.-Q. did
some part of the experimental and analytical work, and contributed to the writing of the manuscript. A.A. did
some part of the experimental work and contributed to the writing of the manuscript.
Competing interests
The authors declare no competing interests.
Additional information
Supplementary information is available for this paper at https://doi.org/10.1038/s41598-020-76418-2.
Correspondence and requests for materials should be addressed to B.S.Y.
Reprints and permissions information is available at www.nature.com/reprints.
Publisher’s note Springer Nature remains neutral with regard to jurisdictional claims in published maps and
institutional affiliations.
Scientific Reports | (2020) 10:19348 | https://doi.org/10.1038/s41598-020-76418-2 21
Vol.:(0123456789)You can also read