Development and Validation of a Masking System for Mitigation of Low-Frequency Audible Noise from Electrical Substations - Preprints.org
←
→
Page content transcription
If your browser does not render page correctly, please read the page content below
Preprints (www.preprints.org) | NOT PEER-REVIEWED | Posted: 16 July 2021 doi:10.20944/preprints202107.0376.v1

 Article

 Development and Validation of a Masking System
 for Mitigation of Low-Frequency Audible Noise from
 Electrical Substations
 Rogerio Regazzi1, Brunno Cunha1, Hugo Villela de Miranda2, Juan José Gómez Acosta3,
 Carlos Roberto Hall Barbosa3,*, Mauricio Nogueira Frota3, João Vitor Souza4 and Carlos
 Augusto Machado Gomes4.

 1 3R Brasil Tecnologia Ambiental. Av. Rio Branco nº 156 sala. 2323, Edifício Av. Central, Centro, Rio de
 Janeiro/RJ, Brazil.
 2 TRACEL Indústria Eletrônica Ltda. Rua Capitão Guynemer Quadra 18 Lote 1B – Polo Industrial CODIN –

 Xerém – Duque de Caxias /RJ, Brazil 25250-615.
 3 Postgraduate Metrology Programme, Pontifical Catholic University of Rio de Janeiro, Marquês de São

 Vicente Street, 225, Gávea, Rio de Janeiro, RJ, Brazil
 4 Light Serviços de Eletricidade S/A. Av. Marechal Floriano, 168 – B4 - 2º andar, CEP 20080-002. Rio de

 Janeiro/RJ, Brazil.
 * Correspondence: hall@puc-rio.br

 Featured Application: Integrated sound system tuned to mask audible noises generated by the
 operation of electrical substations, aiming to comply with legal requirements.

 Abstract: Low-frequency audible noise generated by the magnetostriction effect inherent to the
 operation of power transformers has become a major drawback, especially in cases where the
 electrical substation is located in urban areas subject to strict environmental regulations that
 imposes sound pressure limits, differing for day and night periods. Such regulations apply a +5 dB
 penalty if a tonal component of noise is present, which is clearly the case of magnetostriction noise,
 typically concentrated at twice the industrial frequency (50 Hz or 60 Hz, depending on the
 country). The strategy used to eliminate the tonal characteristics, therefore contributing to establish
 compliance with the applicable regulation and to alleviate the discomfort it causes to the human
 ear, consisted in superimposing to the substation noise a masking sound synthesized from “sounds
 of nature” with suitable intensities, to flatten the noise spectrum while enhancing the soundscape.
 The masking system (heavy-duty speakers powered by a microprocessor platform) was validated
 at an already judicialized urban scenario. Measurement results confirmed that the masking
 solution was capable of flattening the tonal frequencies, whose beneficial effect yielded the
 cancellation of the public civil action filed by the neighbors. The proposed solution is ready to be
 replicated to other scenarios.

 Keywords: power substation; transformer noise; low-frequency noise; noise masking; soundscape

 1. Introduction
 It is well known that the continuous exposure of the human ear to acoustic noise not only
 disturbs and seriously compromises the hearing capacity, but can also endanger the health of those
 who are exposed to it. For this reason, the sound pressure in urban areas is regulated by strict
 environmental legislation. This work evaluates the sound pressure level in the vicinity of electric
 power substations installed in urban areas with high population density. Exposed to constant
 complaints and legal actions filed by the inhabitants of the surroundings of the substation, the
 attenuation of the noise generated by the operation of high voltage electrical transformers has

 © 2021 by the author(s). Distributed under a Creative Commons CC BY license.
Preprints (www.preprints.org) | NOT PEER-REVIEWED | Posted: 16 July 2021 doi:10.20944/preprints202107.0376.v1

 deserved the attention of the electricity utility companies. Aware that mitigation of the noise level is
 not a trivial task, the operation of electrical substations poses technical challenges which require
 innovative solutions, not usually available through conventional technologies. Despite the
 significant technological advances related to the design and installation of transformers and
 subsystems used in electrical substations, the attenuation of acoustic noise generated by the
 operation of high-voltage transformers, even today, is a challenge for managers, researchers and
 manufacturers. Particularly, the noise results from a condition intrinsic to the functioning of the
 transformer itself, caused by the phenomenon of magnetostriction, with tonal characteristics,
 therefore not feasible to be completely eliminated so as not to cause discomfort to the human ear.
 Thus, although it is theoretically possible to attenuate noise by means of acoustic conditioning
 with attenuating and absorbing technologies, aiming at conforming to the strict normative limits
 imposed by the environmental regulation, in practice, the success of these solutions is not trivial.
 Acoustic noise attenuation requires creativity, theoretical and practical experience and mapping of
 the sound field, which, in turn, requires access to high-risk environments, use of specialized
 measurement systems and georeferenced modeling tools.
 The risky environment limits the location of measurement points inside the substation and near
 the transformers, making it difficult to determine and map acoustic power levels and to perform a
 directive analysis of the source [1]. As a result of these difficulties, carrying out a theoretical analysis
 of the energy transfer process during the operation of the electrical transformers would allow
 modeling the system and characterizing the sources [2]. Moreover, a frequency analysis allows
 identifying the fundamental tonal components of the acoustic signal and their harmonics [3].
 This paper is based on the results of an ongoing research and development project (R&D
 Light-Aneel 00382-0128/2019), financed with resources from a research regulated fund managed by
 the regulatory body of the Brazilian electrical system (Aneel), aiming at reducing the level of sound
 pressure present in the broad-spectrum noise that arises from the operation of electrical substations
 installed in urban areas. The paper describes an acoustic noise masking system designed to eliminate
 the tonal characteristic of the spectrum, therefore eliminating the discomfort to the human ear and
 adjusting the sound pressure level to the limits imposed by the environmental legislation. The active
 masking system was made possible by superimposing to the global noise (which emanates from the
 substation's operation) “sounds of nature”, synthesized in the laboratory, thus masking the
 perception of the tonal frequencies (around 120 Hz and first harmonics) by the human ear.
 In this context, the research study represents the response of the electricity utility that has been
 involved in complaints by residents of the substation neighborhood, who claimed to be disturbed by
 the annoying noise generated by the operation of the substation. The proposed acoustic noise
 masking system also contributes to minimizing social-environmental impacts, juridical, operational
 and interdiction costs associated with the functioning of the substations, problems that proved
 feasible to be solved by the use of specialized techniques, such as the proposed masking system.

 2. Theoretical Background

 2.1. Fundamentals of Acoustics
 Acoustic quantities are commonly expressed in decibels (dB), a logarithmic ratio defined by the
 magnitude of the acoustic power in relation to a reference power level (normally P0 = 20 μPa).
 However, due to the different sensitivity of the ear to the different frequencies, the raw values
 obtained are not directly related to the loudness of the sound in question. In order to make the
 measurements more representative of the loudness associated with any sound, it is often desirable to
 weight the values for each frequency in accordance to the way in which the human ear would
 respond to the sound.
 The use of weighting in acoustic measurement is equivalent to making use of filters, allowing
 frequencies to be given different weights during the measurement process. The reason for assigning
 different weights to different frequencies is due to the hearing ability of the human ear, which
 perceives midrange frequencies better than high and low frequencies. In this context, the A-Curve
Preprints (www.preprints.org) | NOT PEER-REVIEWED | Posted: 16 July 2021 doi:10.20944/preprints202107.0376.v1

 weighting allows to simulate the response curve of the human ear during measurements. To meet
 different purposes, the majority of the sound pressure measurements (or noise levels) are expressed
 based on the weight curve A, considering that there is, usually, an acceptable correlation between
 the measured results and the subjective evaluations. In this sense, curve A fulfills the purpose of
 producing a single-value representation of a complete sound spectrum. The A-weighted sound
 pressure level is then defined as

 = 10 10 ( ) . (1)
 0

 The A-weighted Equivalent Continuous Noise Level is used as a descriptor of both
 occupational and environmental noise and, for an average over a period of time Te, it may be written
 in terms of the instantaneous A-weighted sound pressure level as

 ( )
 1
 , = 10 log10 [ ∫0 10 10 ]. (2)

 In this work, the period Te = 5 min was used, leading to the simplified notation for this
 descriptor.
 Two other descriptors, L10 and L95, provide a statistical insight into sound pressure levels that
 fluctuate significantly over time. Considering the LA values, L95 is the level that has been exceeded
 95 % of the time, and is often used as an approximation of the background noise level or as a
 descriptor for continuous noise sources. On the other hand, L10 is the level that has been exceeded
 10 % of the time, and can be used to assess noise from vehicle traffic and other mobile sources.
 Finally, in practical situations, a specific sound might be of interest, and another specific
 descriptor LAeq,sp would be defined depending on the situation. In the case of a continuous noise
 polluted by intrusive noises, L95 is generally a good descriptor to assess the sound pressure level
 generated by the functioning of high-voltage transformers, except in cases where the background
 noise is so high that it masks the specific noise of interest or makes it impossible to be identified.

 2.2. Environmental Regulation
 The international standards ISO 1996-1:2016 and ISO 1996-2:2017 [4,5], used as the basis for the
 Brazilian standard NBR 10.151:2019 [6], define the nomenclature and procedures for measurement
 of environmental noise in community environments and noise assessment in inhabited areas, aiming
 at the comfort of the community. The sound pressure levels are limited by each city zone, typically
 based on the applicable standards, considering the A-weighting, and divided by day time and night
 time periods.
 Furthermore, the aforementioned Brazilian standard defines that, in the case that specific
 frequencies are identified in the measured noise – characterizing the so-called tonal noise –, the
 measured sound pressure levels shall be penalized in KT = +5 dB. Noise is considered to be tonal if
 there is a difference larger or equal to 15 dB between the specific frequencies and its side frequencies,
 for frequencies between 25 Hz and 125 Hz; 8 dB, for frequencies between 160 Hz and 400 Hz; or 5 dB,
 for frequencies between 500 Hz and 10 kHz, as depicted in Table 1.
 This is the criterion that characterizes and quantifies the limits for framing the noise component
 as containing tonal components. As an example, it should be noted that, in the frequency range from
 25 Hz to 125 Hz, the penalty imposed by legislation (i.e., adding + 5 dB to the measured sound
 power value) only occurs if the difference between the sound pressure measured at the central
 frequency and at both adjacent frequencies is ≥ 15 dB.
 Table 1. Characterization of a tonal sound according to ABNT NBR 10151:2019 standard

 Frequency band (Hz) 1/3 ∆ ( ).
 octave of the frequency of Difference between sound pressure measured at
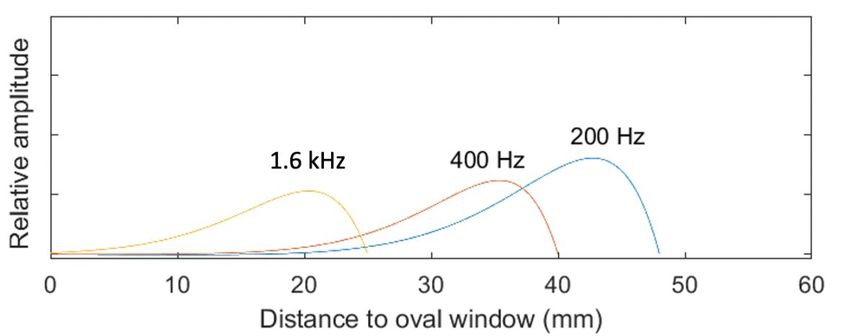
Preprints (www.preprints.org) | NOT PEER-REVIEWED | Posted: 16 July 2021 doi:10.20944/preprints202107.0376.v1

 interest both, central and adjacent frequencies
 25 Hz to 125 Hz ≥ 15 dB
 160 Hz to 400 Hz ≥ 8 dB
 500 Hz to 10000 Hz ≥ 5 dB

 2.3. Magnetostriction Noise
 Magnetostriction is a physical phenomenon characterized by the dimensional alteration of
 ferromagnetic materials when excited by magnetic fields [7]. It occurs in magnetic circuits of
 electrical machines in general and, in particular, in power transformers. More specifically in the case
 of power transformers used in high-voltage electrical substations, the acoustic noise is generated by
 the periodic expansion and contraction of the steel plates that form the laminated core of the
 transformer, due to the magnetic field that is induced by the flow of alternating electric current
 through its coils.
 This phenomenon of expansion and contraction occurs with double the frequency of the
 alternating current. For the operating conditions of the Brazilian electrical network, an acoustic noise
 is generated with a characteristic frequency of 120 Hz, in addition to some harmonics (typically,
 240 Hz and 360 Hz), frequencies in the audible range (there may be variation of these frequencies
 around nominal values, typically ±0.2 Hz). Although the magnetostriction noise from transformers
 can be attenuated by means of a specific project for restructuring the transformer, this phenomenon
 is intrinsic to its operation and cannot be completely eliminated.
 Thus, the noise of interest is continuous, so LAeq,sp = L95 in the cases that the background noise is
 not high enough to mask the specific noise from the substation. In scenarios with a background noise
 too high, no assessment can be made. A corrected noise level, LR, is then defined based on LAeq,sp,
 taking into account the possible penalty due to the presence of tonal noise, so that that =
 , + if there is tonal noise, and = , in the absence of a tonal noise.

 2.4. Sound Masking
 The phenomenon of sound masking is something that naturally occurs every day for most
 people, in the lower part of the inner ear, specifically in the basilar membrane, which divides the
 internal chambers of the cochlea, the snail-shaped organ that connects the middle ear with the
 auditory nerve. Sound masking occurs when the ear is exposed to different tones of different
 frequencies and amplitudes, and the basilar membrane responds to these stimuli with displacements
 from the area near the oval window of the ear [8,9].
 The inner ear reflects a complex sound system. It is composed of the cochlea, a snail-shaped
 structure, and the labyrinth, with three semicircular canals. The cochlea is the essential part of the
 auditory system. It is made up of more than 15000 hair cells, which vibrate according to the sound.
 The frequency of the perceived sound defines the degree of displacement in the basilar membrane,
 as depicted in Figure 1. It is asymmetric and presents a tail from the initial point of displacement, the
 area near the oval window (high frequencies) to the maximum point defined by the amplitude of the
 stimulus, with a sudden decay in the end point or zone of low frequencies. This asymmetry is what
 causes the masking phenomenon, since a low frequency tone, depending on its amplitude, can mask
 a high frequency tone due to the previously explained tail.
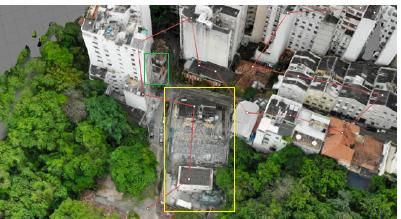
Preprints (www.preprints.org) | NOT PEER-REVIEWED | Posted: 16 July 2021 doi:10.20944/preprints202107.0376.v1

 Figure 1. Basilar membrane displacement for different pure tones

 3. Materials and Methods
 This section describes the methodology used to study the acoustic noise generated by the
 operation of an electrical substation installed in an essentially residential area, and also the design
 and implementation of the masking system.
 Particularly, it discusses experimental procedures to identify the primary sources of noise and
 measurement of the relevant acoustic parameters required to support the development of a masking
 system, which superimposes “sounds of nature” to the primary noise generated by the transformers
 of the substation aiming at eliminating the undesirable tonal characteristics of the noise.
 Measurements were performed in compliance with recommendations of the ABNT NBR 10151:2019
 standard [6], based on ISO 1996-2 standards [4,5], which establishes procedures for measuring and
 evaluating sound pressure levels outside buildings.
 The electrical substation selected to support the study is located in a neighborhood in the south
 zone of the city of Rio de Janeiro, a highly populated residential area nearby the Copacabana beach.
 In compliance with the recommendations of the International Olympic Committee (IOC), the
 capacity of the substation was expanded to 80 MVA, using two transformers of 40 MVA each, here
 referred as Trafo#1 and Trafo#2.

 3.1. Characterization of the substation's internal and external environments
 Figure 2 illustrates a photo taken by an instrumented drone (DJI Mavic air), showing an image
 of the substation (highlighted in yellow) and its residential surroundings. The discomfort caused by
 the noise from the substation culminated in complaints and a legal action imposed by residents of
 one of the buildings (identified in green) surrounding the substation, also shown in the same figure.
 The red line in the figure is the output of a software tool used for determining the height of the
 buildings.

 Figure 2. Location of the substation (in yellow) and of the source of the complaint (in green).
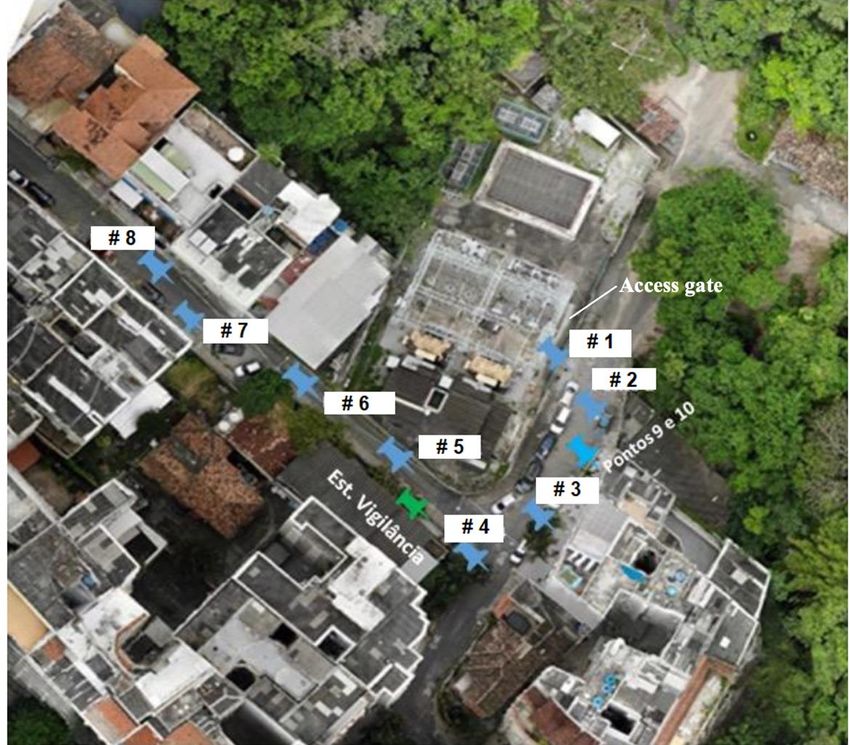
Preprints (www.preprints.org) | NOT PEER-REVIEWED | Posted: 16 July 2021 doi:10.20944/preprints202107.0376.v1

 Figure 3 shows a closer view of the two transformers installed in the substation plant.

 Figure 3. Closer view of the substation, showing the two high-voltage transformers.

 3.2. Characterization of the primary sound sources
 The primary sources of acoustic noise attributed to the operation of the substation are the
 high-voltage transformers (Trafo #1 and Trafo #2). To these, other secondary sources of residual
 noise are superimposed, such as “nature noises” (e.g.: bird songs, insect buzzing), noises generated
 by human activity (eg: traffic of vehicle, people and animals’ passers-by voices), and not negligible
 noises generated by air conditioning equipment, water pumps and ventilation systems installed in
 the neighborhood buildings themselves.
 To monitor the acoustic field perceived by residents of the neighborhood surrounding the
 substation, eight measurement points were selected outside the substation yard, indicated in Figure
 4; the measurement point marked in green refers to a continuous measurement station performed by
 a 24-hour remote monitoring sound level meter, while the points marked in blue indicate
 point-based measurements.
 The sound pressure level was assessed by a calibrated CESVA SC420 Type 1 sound level meter
 (expanded uncertainty of 0.9 dB, for a Coverage Factor k = 2, as stated in the Calibration Certificate
 issued by an accredited laboratory). The sound level meter is equipped with a 1/3 octave band
 spectral analyzer, capable of performing A-weighting measurements, maintaining the microphone
 positioned 1.5 m above the ground level, for each one of the measurement points, while the
 continuous 24-hour measurements were performed by a surveillance acoustic sensor CESVA TA120.
 The effect of wind speed was not considered, given the protection imposed by the presence of
 buildings throughout the neighborhood.
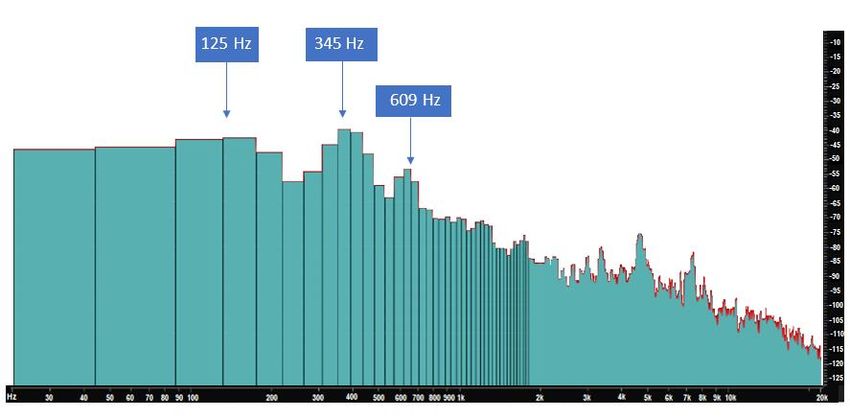
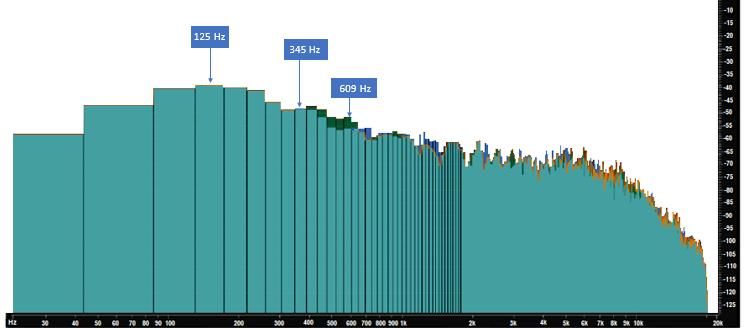
Preprints (www.preprints.org) | NOT PEER-REVIEWED | Posted: 16 July 2021 doi:10.20944/preprints202107.0376.v1

 Figure 4. Sound pressure measurement locations in the vicinity of the substation

 In the internal environment of the substation, measurements were carried out in front of each
 transformer, positioning the microphone 2 m away from it and 1.5 m from the ground. Figure 5
 shows the spectrum associated with the mapping of the primary sources of noise. Even though tonal
 frequencies were identified for the frequencies 125 Hz, 345 Hz and 609 Hz, associated with the band
 centers defined by default by the measurement equipment, actual frequencies resulting from the
 magnetostriction phenomenon generate the hum of the transformer at 120 Hz, 240 Hz and 360 Hz,
 which are harmonics of the excitation current at 60 Hz.

 Figure 5. Frequency spectrum measured in front of the transformer
Preprints (www.preprints.org) | NOT PEER-REVIEWED | Posted: 16 July 2021 doi:10.20944/preprints202107.0376.v1

 The measurement campaign identified , levels above the applicable limit defined by the
 applicable environmental legislation, which defines 55 dB and 50 dB for the daytime and nighttime
 periods, respectively. Since there are tonal frequencies present in the spectrum, the legislation
 applies a penalty of +5 dB over the measured values, which makes the effort to ensure compliance
 with the acceptable standard limits even more challenging for the electricity utility responsible for
 the operation of the substation.

 3.3. Synthetizing of the masking samples
 The main role of the acoustic masking system is to flatten the frequency spectrum around the
 identified tonal frequencies, thereby avoiding the +5 dB penalty applied by environmental
 legislation, and reducing the discomfort perceived by the human ear, thus enhancing the
 soundscape. The masking process was implemented through an electronic synthesis simulating
 natural sounds of nature, with frequencies in the side bands between the ranges 100 Hz to 160 Hz,
 250 Hz to 400 Hz, and 560 Hz to 700 Hz, aiming to mask the tonal noises identified at 125 Hz, 345 Hz
 and 609 Hz, respectively.
 The sounds to be superimposed to the sound generated by the power transformers were
 selected based on the study of their acoustic properties and literature research [10-12], which
 describe significant improvement of the soundscape through the external inclusion of such masking
 sounds. Among the nature sounds selected, the songs of three nocturnal birds present in the
 Brazilian Atlantic region were investigated and incorporated into the masking sound: (i) the
 yellow-bellied Murucutu (Pulsatrix koeniswaldiana) or Tawny-browed Owl [13]; (ii) the Urutau
 (Nyctibius griséus) Grey Potoo [14]; and (iii) the Juruva - Baryphthengus ruficapillus
 (Rufous-capped Motmot) [15].
 A MIDI controller/synthesizer (Roli Seaboard Rise 49), with EQUATOR software and Adobe
 audition CC 12.0 software, was used to perform a sound synthesis and post-production process
 known as sampling, which consists of creating and processing sounds starting from the reuse of
 samples already defined.
 From the first acoustic tests that aimed to superimpose a masking sound on the acoustic noise
 generated by the operation of the transformers, it was possible to synthetize different alternatives of
 sound arrangements using sounds induced by noise associated with the movement of a river and
 waterfalls, noise of rain, insects humming and bird songs from the Atlantic Forest (Essay # 1). Using
 different process racks from Adobe Audition itself, it was possible to adjust the spectrum to the
 critical frequencies of interest. Once the sample to be used was obtained, it was mixed with the noise
 sample of the transformers, as illustrated in Fig. 6, clearly showing a decrease in amplitude between
 the side bands of the tonal frequencies of 125 Hz, 345 Hz and 609 Hz, effectively masking the tonal
 characteristic of the hum generated by both transformers.

 Figure 6. Frequency spectrum of the synthesized sample mixed with the noise generated by the transformers
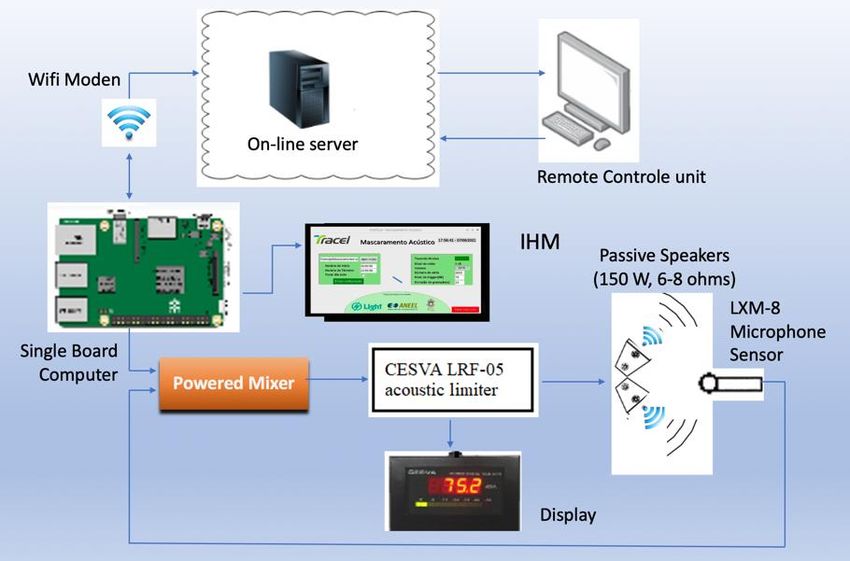
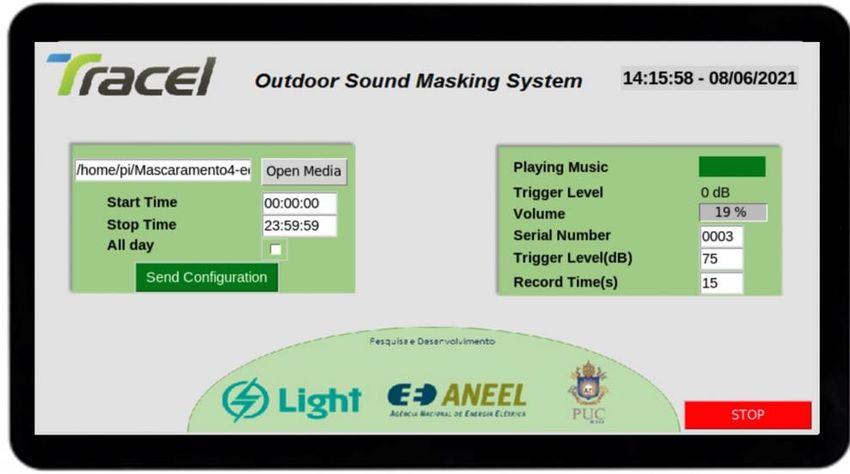
Preprints (www.preprints.org) | NOT PEER-REVIEWED | Posted: 16 July 2021 doi:10.20944/preprints202107.0376.v1

 These preliminary results validated the premises raised by the study and extracted from the
 literature, to carry out additional tests to analyze the superposition of the masking sound (including
 its harmonization) with the environment sound emerged from of the substation.

 3.4. Design of the Masking System
 The acoustic masking system is conceived with the objective of eliminating the tonal component
 in the noise generated by high voltage transformers – which causes discomfort to the human ear and
 penalizes the measured levels by + 5 dB –, understood as the primary source of environmental noise
 generated in the electrical substation studied.
 During the day, the random noise from the surroundings, called "background noise", varies
 depending on the activities in the community. People who speak, vehicles in transit, workers,
 animals in nature, etc., produce an acoustic noise level that manages to mask the noise of the
 transformers; however, at night, this background noise is much lower and the tonal characteristics of
 the transformers are exposed. To overcome this difficulty, an external sound synthetized in the
 laboratory was superimposed on the main acoustic signal generated by the operation of the
 transformers, assigning to it a stationary random characteristic that converts the annoying sound
 into a reasonable "pleasant acoustic landscape", reducing drastically the irritation perceived by the
 human ear. That is, the acoustic masking signal aims to occupy the lateral frequencies of the tonal
 component generated by the noise of the transformers, without increasing the acoustic level of the
 general environment. The masking signal feeds an audio amplifier and is inserted into the
 environment by means of weather resistant speakers. In other words, by removing the tonal
 characteristics, the artificially introduced masking system contributes to increasing the human ear's
 tolerance to irritation caused by acoustic noise and avoids the +5 dB penalty imposed by legislation.
 The control system of the masking system was developed in Python in a Raspberry Pi
 embedded computer, running the Debian Linux system, with the following characteristics:
 • Python version: Python 3.7.3
 • Operating system: "Raspbian GNU / Linux” version 10.4 “buster”
 • Kernel version: 5.4.51-v7 + # 1333
 • Hardware version: Raspberry Pi model 3
 The system, depicted in Figure 7, illustrates the subsystems that make up the masking system.
 Through the program developed in Python, the researchers play the masking sounds, which are
 amplified by a power mixer. The system can be used directly through a touch sensitive human
 machine interface screen (shown in Fig. 8) or remotely through an internal connection. As a
 protection element against operator or system errors and in order to improve the measurement and
 regulation of the sound pressure level in dB that is being reproduced, an acoustic limiter LRF05 was
 used, with its sensor microphone positioned in front of the loudspeakers PSB CS100 (150 W, 6-8
 ohms). An internet server stores soundtracks and data collected by both the system and the limiter.
 The system reproduces a sound of water as a baseline, to attend the lateral bands of the tonal of
 the transformer, and also allows the random reproduction of synthetized sounds of birds at
 pre-programmed periods of the day. Conceived to offer a friendly interaction with the system
 operator, the system incorporates a 7" HMI (Human-Machine Interface) touch screen interface, that
 allows interchange of the masking sound type and its execution by pre-programmable periods,
 whose functions can be selected by the operator, directly on the screen (Figure 8) of the masking
 system.
Preprints (www.preprints.org) | NOT PEER-REVIEWED | Posted: 16 July 2021 doi:10.20944/preprints202107.0376.v1

 Figure 7. Block diagram of the masking system

 Figure 8. HMI display of the masking system and its operating functions

 4. Results
 After being validated in laboratory, the performance of the masking system was evaluated in
 the real field, in the neighborhood of the high-voltage substation studied. The amplitude and
 spectrum of the sound pressure generated by the transformers in operation were monitored
 externally to the substation with the masking system, installed and activated within the internal
 environment of the substation. The reference microphone was installed in positions of measurement
 points #2, #3 and #6 (shown in Figure 3). All acoustic pressure measurements were performed with
 the calibrated sound meter CESVA SC 420, for the two acoustic conditions studied, i.e., with the
 masking system activated and deactivated, thus allowing the comparison of the acoustic noise
 spectra obtained for both studied situations. To establish compliance, the measurement results were
 also compared with the limits of the sound pressure level recommended by the Brazilian standard
 ABNT NBR 10151:2019 [6], as defined in Table 1.
 Figure 9 shows the respective processed frequency spectra for the three selected measurement
 points positioned in the vicinity of the substation. The images on the left document the respective
 spectra in the absence of the masking effect (disabled masking system) while the images on the right
 document the respective frequency spectra under the effect of the masking sound superimposed on
 the sound induced by the operation of substation, i.e., with the masking system activated.
 The frequency spectra shown in the images on the left of Figure 9 clearly indicate the existence
 of potential tonal components in the acoustic signal (characterized by red bars) for all three sound
 pressure measurement campaigns carried out at measurement points #2, # 3 and #6. This is,
 however, only a visual finding made explicit by visual inspection of the frequency spectrum graphs.
Preprints (www.preprints.org) | NOT PEER-REVIEWED | Posted: 16 July 2021 doi:10.20944/preprints202107.0376.v1

 As shown in Table 2, which documents the processed results of the sound pressure measurement
 level (SPL), it is necessary to be aware of the existence of false positives (failure to meet the criteria
 defined in Table 1) in this process of identifying possible tonal components. This is the case of the
 results associated with measurement point #2 which, although presenting three peaks (red bars) at
 the frequencies of 125 Hz, 250 Hz and 400 Hz, in fact, only one of them (at the frequency of 125 Hz)
 can be characterized as tonal when the regulation criteria are applied. The peaks at frequencies of
 250 Hz and 400 Hz simply reflect the presence of harmonics and should be disregarded as they do
 not meet the criteria defined in Table 1.

 Figure 9. Sound pressure frequency spectra in the absence and presence of sound masking. The
 images on the left refer to spectra measured with the masking system turned off, while those on the
 right refer to spectra measured under the effect of the masking system. The three lines correspond to
 measurement points #2, #3 and #6, respectively.

 As explained in by the result of the arithmetic difference calculated between the values of the
 acoustic pressure measured between the central band and in the respective adjacent bands, for all
 three measurement points (#2, #3 and #6), the results of this difference in pressures shown in red
 color confirm the presence of tonal for the 125 Hz frequency, that is, Δ ( ) ≥ 15 . It is important
 to note here that the criterion needs to be met for both adjacent frequencies.
 Just to elucidate this framing criterion, it is worthy noticing that for the results of measuring
 point #3, at the frequency of 250 Hz, the regulation criteria of Table 1 is only satisfied for one of the
 adjacent frequencies. For this case, the applicable filter criterion considered in Table 2 is ∆P (dB) ≥ 8
 dB. As shown in the left part of Table 2 that summarizes the data associated with measurements
 when the masking system remained disabled, for the data associated with measurement point #3, at
 the frequency of 250 Hz, the module of the arithmetic difference of the results of measurements
Preprints (www.preprints.org) | NOT PEER-REVIEWED | Posted: 16 July 2021 doi:10.20944/preprints202107.0376.v1

 performed in the central band and in the respective adjacent bands only meets the criterion for the
 value 9.2 dB (49.3 dB - 40.1 dB), which is not true for the value 6.4 dB (49.3 dB – 42.9 dB), thus not
 confirming the tonal hypothesis.

 Table 2, by the result of the arithmetic difference calculated between the values of the acoustic
 pressure measured between the central band and in the respective adjacent bands, for all three
 measurement points (#2, #3 and #6), the results of this difference in pressures shown in red color
 confirm the presence of tonal for the 125 Hz frequency, that is, Δ ( ) ≥ 15 . It is important to
 note here that the criterion needs to be met for both adjacent frequencies.
 Just to elucidate this framing criterion, it is worthy noticing that for the results of measuring
 point #3, at the frequency of 250 Hz, the regulation criteria of Table 1 is only satisfied for one of the
 adjacent frequencies. For this case, the applicable filter criterion considered in Table 2 is ∆P (dB) ≥ 8
 dB. As shown in the left part of Table 2 that summarizes the data associated with measurements
 when the masking system remained disabled, for the data associated with measurement point #3, at
 the frequency of 250 Hz, the module of the arithmetic difference of the results of measurements
 performed in the central band and in the respective adjacent bands only meets the criterion for the
 value 9.2 dB (49.3 dB - 40.1 dB), which is not true for the value 6.4 dB (49.3 dB – 42.9 dB), thus not
 confirming the tonal hypothesis.

 Table 2. Processing of measurements to identify the tonal component of noise

 The superposition of masking sounds as a strategy to eliminate the tonal characteristics of
 acoustic noise proved to be effective at the substation studied. In addition to the benefits caused by
 masking, it should be noted that the superposition of the masking signal to the acoustic field
 generated by the operation of the substation does not always increase the intensity of the acoustic
 pressure associated with the combined acoustic field. This fact is exemplified by the comparison of
 the results of the measurement of acoustic pressure at the frequency of 125 Hz, carried out at
 measurement points #2 and #3, in which the value of the acoustic pressure decreased by 1.4 dB (from
Preprints (www.preprints.org) | NOT PEER-REVIEWED | Posted: 16 July 2021 doi:10.20944/preprints202107.0376.v1

 63.7 dB to 62.3 dB dB at measurement point #2) and has fallen by 2.5 dB (from 62.2 dB to 59.7 dB at
 measurement point #3). In contrast, the masking effect increased 4.8 dB (from 53.9 dB to 58.7 dB at
 measurement point #6 furthest from the substation) at the same 125 Hz frequency.
 Contrary to what should be expected when the masking signal is superimposed on other
 acoustic noises in an open field, the reduction in the intensity of the sound pressure at points #2 and
 #3 can be explained by an adverse action of masking on standing waves that can be formed in
 confined environments, as occurred at measurement points #2 and #3, closest to the access gate of the
 substation. The presence of standing waves was detected by a 3D Camera operated by 48
 microphones arranged in a ring shape, whose technique and applications is discussed elsewhere
 [16].
 Once the tonal component of the acoustic noise was identified based on the regulation criteria
 defined in Table 1 —which incurs a penalty of + 5 dB in the measured values—, measurements were
 taken of the occupational and environmental noise descriptors, characterized by mean values to over
 a period of time (Te = 5 min), expressed by instantaneous values that result from the weighting based
 on Curve A, expressed by equation (2).
 To represent the physical characteristics of the measurement of a quantity that varies in the
 fields of frequency and time, the CESVA SC 420 sound meter also performs independent
 measurements of the acoustic descriptors 10 and 95 previously described.
 Data in
 Table 3 summarizes measurement results of the characteristic statistical descriptors performed
 at the same three measurement points #2, #3, and #6, at 11:30 pm; i.e., near the changeover from day
 to night periods (the night period starts at 10:00 pm and ends at 10:00 am). In this Table,
 denotes the value corresponding to the value shown in Table 2, but weighted in Curve A. The
 value LR is defined by the value of L95, penalized by +5 dB in cases where the tonal component in
 noise is present, expressed by the equation
 (dB) = 95 (dB) + 5 dB (3)

 Table 3. Results of measurements of characteristic statistical descriptors
 Measurements with the masking system disabled Measurements with the masking system activated
 Measuring
 Point # LA eq L 10 L 95 LR LA eq L 10 L 95 LR
 (Meas.Point #)
 (dB) (dB) (dB) (dB) (dB) (dB) (dB) (dB)
 Meas.Point #2 50.3 50.2 50.2 55.2 53.1 55.7 50.9 50.9

 Meas.Point #3 49.9 50.4 48.8 53.8 50.4 51.1 48.8 48.8

 Meas.Point #6 44.7 45.5 43.3 48.3 46.3 46.8 45.7 45.7

 The results shown in Table 3 confirm, for all three measurement points investigated, that, when
 properly implemented, the masking sound (continuous noise) is able to flatten the tonal
 characteristics associated with the background noise (i.e., compliance of the descriptor with the
 regulation). Except for the value 50.9 dB (measured at measurement point #2), all other values
 comply with the regulation imposed for the night period (< 50 dB). This small discrepancy in the
 threshold value should not be a matter of concern as this measurement point is very close to the
 heavy steel access gate of the substation, whose proximity distorts the measurement (acoustic wave
 reverberation). As shown in Figure which is far from the location inhabited by a potential claimant.
 The results also show that the masking sound practically does not increase the amplitude of the
 combined acoustic signal (i.e., the value of 95 is not considerably affected by the masking sound
 introduced).

 5. Conclusions
 This article presented a new approach to combat noise pollution acting on the acoustic
 landscape of external environments, masking emissions that bother or are unpleasant for the
Preprints (www.preprints.org) | NOT PEER-REVIEWED | Posted: 16 July 2021 doi:10.20944/preprints202107.0376.v1

 population. Based on tests supported by a structured program for monitoring and measuring the
 sound pressure in the presence and absence of the action of the sound masking system, it proved to
 be effective in eliminating the tonal noise of the target noise, which results from the operation of the
 electric substation. When eliminating the tonal characteristics, one benefits from the applicable
 technical standard (NBR 10151:2019) that imposes a penalty of +5 dB on the measured values of the
 sound pressure level. This assumption is supported by the fact that the equivalent sound pressure
 levels did not exceed the 15 dB difference limit for the 125 Hz adjacent bands and 8 dB for the 400 Hz
 adjacent bands, no longer incurring in the +5 dB penalty imposed by the NBR 10151:2019 standard
 [6].
 From a legal point of view, the efficacy of the sound masking system was also proven by the
 fact that the public civil action filed by the residents of the substation's neighborhood was canceled
 based on an independent assessment carried out in the substation environment at the initiative of
 the Public Ministry.
 Author Contributions: Conceptualization, Rogério Regazzi, Brunno Cunha and Hugo Miranda; Data curation,
 Brunno Cunha and Juan José Acosta; Formal analysis, Rogério Regazzi, Brunno Cunha, Hugo Miranda, Juan
 José Acosta, Carlos Barbosa and Mauricio Frota; Funding acquisition, Mauricio Frota; Investigation, Rogério
 Regazzi, Brunno Cunha, Hugo Miranda, Juan José Acosta, Carlos Barbosa and Mauricio Frota; Methodology,
 Rogério Regazzi, Brunno Cunha, Hugo Miranda, Juan José Acosta, Carlos Barbosa and Mauricio Frota; Project
 administration, Mauricio Frota, João Souza and Carlos Augusto Gomes; Resources, Rogério Regazzi, Hugo
 Miranda, Mauricio Frota, João Souza and Carlos Augusto Gomes ; Software, Brunno Cunha and Hugo Miranda;
 Supervision, Carlos Barbosa and Mauricio Frota; Validation, Rogério Regazzi, Brunno Cunha and Hugo
 Miranda; Visualization, Brunno Cunha and Juan José Acosta; Writing – original draft, Juan José Acosta, Carlos
 Barbosa and Mauricio Frota; Writing – review & editing, Carlos Barbosa and Mauricio Frota.

 Funding: This work was financed by the regulated R&D program coordinated by the regulatory body of the
 Brazilian electrical system (Anneal), through Project R&D Light-Aneel 00382-0128/2019.

 Acknowledgments: Thanks are due to Light Energia S/A and the National Electric Energy Agency (Aneel) for
 financing the R&D project Light/Aneel 00382-0128/2019, in the context of which this work was developed. This
 study was financed in part by the Coordenação de Aperfeiçoamento de Pessoal de Nível Superior - Brasil
 (CAPES) - Finance Code 001.

 Conflicts of Interest: The authors declare no conflict of interest. The funders had no role in the design of the
 study; in the collection, analyses, or interpretation of data; in the writing of the manuscript, or in the decision to
 publish the results.

 References
 1. Piana, E.A.; Roozen, N.B. On the Control of Low-Frequency Audible Noise from Electrical Substations: A
 Case Study. Applied Sciences 2020, 10, 637, doi:10.3390/app10020637.
 2. Ying, L.; Wang, D.; Wang, J.; Wang, G.; Wu, X.; Liu, J. Power Transformer Spatial Acoustic Radiation
 Characteristics Analysis under Multiple Operating Conditions. Energies 2018, 11, 74,
 doi:10.3390/en11010074.
 3. Keerthipala, W.W.L.; Zhou RuJing; Tan Eu Leong; Chionh Chang Jinn Electronic Circuits for Active
 Control of Acoustic Noise Generated by High Voltage Transformers. In Proceedings of the 1998
 International Conference on Power Electronic Drives and Energy Systems for Industrial Growth, 1998.
 Proceedings.; IEEE: Perth, WA, Australia, 1998; Vol. 1, pp. 243–248.
 4. ISO 1996-1:2016: Acoustics – Description measurement and assessment of environmental noise – Part 1:
 Basic quantities, assessment procedures. Third edition, Geneva, Switzerland.
 5. ISO 1996-2:2017: Acoustics – Description measurement and assessment of environmental noise – Part 2:
 Determination of sound pressure levels. Geneva, Switzerland.
 6. NBR 10151: 2019 standard. Acústica – Medição e avaliação de níveis de pressão sonora em áreas habitadas
 – Aplicação de uso geral. Rio de Janeiro: ABNT, 2019. (Based on ISO 1996-2).
 7. Charles, J.G. The effect of the level of magnetostriction upon noise & vibration of model single-phase
 transformer, Electrical Research Association (ERA), 1967.
 8. Isbert, A. C. (1998). Diseño acústico de espacios arquitectónicos (Vol. 4). Univ. Politèc. de Catalunya.
Preprints (www.preprints.org) | NOT PEER-REVIEWED | Posted: 16 July 2021 doi:10.20944/preprints202107.0376.v1

 9. Zwicker, E. (1977). Masking‐period patterns produced by very‐low‐frequency maskers and their possible
 relation to basilar‐membrane displacement. The Journal of the Acoustical Society of America, 61(4),
 1031-1040.
 10. Watts, G. R., Pheasant, R. J., Horoshenkov, K. V., & Ragonesi, L. (2009). Measurement and subjective
 assessment of water generated sounds. Acta Acustica United with Acustica, 95(6), 1032-1039.
 doi:10.3813/AAA.918235.
 11. Coensel, B.D.; Vanwetswinkel, S.; Botteldooren, D. Effects of Natural Sounds on the Perception of Road
 Traffic Noise. The Journal of the Acoustical Society of America 2011, 129, EL148–EL153,
 doi:10.1121/1.3567073.
 12. Jeon, J. Y., Lee, P. J., You, J., & Kang, J. (2012). Acoustical characteristics of water sounds for soundscape
 enhancement in urban open spaces. Journal of the Acoustical Society of America, 131(3), 2101-2109.
 doi:10.1121/1.3681938
 13. Menq, W. & Anjos, L. (2015) Habitat selection by owls in a seasonal semi-deciduous forest in southern
 Brazil. Brazilian Journal of Biology. v. 75(4.1):143-149.
 14. Mendonça, L. G. A., Blamires, D., & Tubelis, D. P. (2009). Nesting of the Common Potoo, Nyctibius griseus
 (Gmelin, 1789)(Aves: Nyctibiidae) in an urban environment in central Cerrado. Lundiana: International
 Journal of Biodiversity, 10(1), 77-79.
 15. Pagotto, A. H., Muscat, E., & Stuginski, D. R. (2019). PREDATORY BEHAVIOR OF A RUFOUS-CAPPED
 MOTMOT (BARYPHTHENGUS RUFICAPILLUS) ON A MAMMAL (MONODELPHIS SP.). Ornitología
 Neotropical, 30, 229-231.
 16. M. N. Frota (Coord.) and J. V. Souza (R&D Manager), R&D Project Reports, Light/Aneel 00382-0128/2019,
 “Control of sound pressure levels in energy substation”, Contract # 4500429234, signed in Oct/2019.
You can also read