TOF-SIMS ANALYSIS OF OSTEOBLAST-LIKE CELLS AND THEIR MINERALIZED EXTRACELLULAR MATRIX ON STRONTIUM ENRICHED BONE CEMENTS
←
→
Page content transcription
If your browser does not render page correctly, please read the page content below
Kokesch-Himmelreich et al. Biointerphases 2013, 8:17
http://www.biointerphases.com/content/8/1/17

 ORIGINAL ARTICLE                                                                                                                                   Open Access

ToF-SIMS analysis of osteoblast-like cells and their
mineralized extracellular matrix on strontium
enriched bone cements
Julia Kokesch-Himmelreich1, Matthias Schumacher2, Marcus Rohnke1*, Michael Gelinsky2 and Jürgen Janek1

  Abstract
  Commonly used implants for therapeutic approaches of non-systemically impaired bone do not sufficiently support
  the healing process of osteoporotic bone. Since strontium (II) has been proven as an effective anti-osteoporotic
  drug new types of strontium enriched calcium phosphate bone cements were developed. As osteoporosis is
  characterized by an imbalance of osteoblast and osteoclast activity the influence of this newly generated strontium
  enriched biomaterials on the cellular behavior of osteoblast-like cells was investigated by time of flight secondary
  ion mass spectrometry (ToF-SIMS). ToF-SIMS is used to analyze whether strontium is incorporated in the mineralized
  extracellular matrix (mECM) and whether there is strontium uptake by osteogenically differentiated human
  mesenchymal stem cells (hMSCs). Therefore hMSCs were cultured in osteogenic differentiation medium for 21 days
  on two different strontium enriched bone cements (S100 and A10) and for reference also on the pure calcium
  phosphate cement (CPC) and on a silicon wafer. The distribution of strontium in the osteoblast-like cells and within
  their mineralized extracellular matrix was analyzed. A higher intensity of the strontium signal could be detected in
  the region of the mECM, synthesized by cells cultivated on the Sr- substituted bone cement (S100) in comparison
  to the reference groups. The osteoblast-like cells used the released strontium from the biomaterial to synthesize
  their mECM. Apart from that a uniform strontium distribution was measured within all investigated cells. However,
  different amounts of strontium were found in cells cultured on different biomaterials and substrates. Compared to
  the negative controls the strontium content in the cells on the strontium enriched biomaterials was much higher. A
  higher concentration of strontium inside the cells means that more strontium can take part in signaling pathways.
  As strontium is known for its beneficial effects on osteoblasts by promoting osteoblastic cell replication and
  differentiation, and reducing apoptosis, the newly developed strontium enriched calcium phosphate cements are
  promising implant materials for osteoporotic bone.
  Keywords: Strontium doped bone cements; Osteoblast-like cells; Mineralized extracellular matrix; ToF-SIMS;
  Strontium uptake in cells; Strontium incorporation in mineralized ECM

Background                                                                               and biomechanical properties [2]. Therefore implants and
Osteoporosis is the most common type of systemic                                         biomaterials which are appropriate for the therapeutic use
bone disease. It is characterized by reduction of bone                                   in systemically altered bone are currently under deve-
mineral density (BMD) and leads to an increased risk of                                  lopment. Calcium phosphate cements, which have been
fracture [1]. Commonly used implants for therapeutic                                     proposed to reinforce osteoporotic bone, are particularly
approaches of non-systemically impaired bone are not                                     promising [3]. In general bone cements have been used
sufficient in supporting the healing process of damaged                                  very successfully in the treatment of a wide range of bone
osteoporotic bone regarding their chemical, biological                                   defects due to their biological beneficial behavior and
                                                                                         handling properties [4]. They perfectly fit into the bone
* Correspondence: Marcus.Rohnke@phys.chemie.uni-giessen.de                               defect cavity or can be molded easily to the desired shape
1
 Institute for Physical Chemistry, Justus - Liebig - University Giessen,                 [5]. It was proven that calcium phosphate materials also
Heinrich-Buff-Ring 58, 35392, Giessen, Germany                                           allow ionic substitution, which offers another degree of
Full list of author information is available at the end of the article

                                          © 2013 Kokesch-Himmelreich et al.; licensee Springer. This is an Open Access article distributed under the terms of the Creative
                                          Commons Attribution License (http://creativecommons.org/licenses/by/2.0), which permits unrestricted use, distribution, and
                                          reproduction in any medium, provided the original work is properly cited.
Kokesch-Himmelreich et al. Biointerphases 2013, 8:17                                                             Page 2 of 12
http://www.biointerphases.com/content/8/1/17

freedom in the development of improved cements. Ions            of polyatomic ion sources which cause less residual
with specific activity and with biological relevance, such as   damage of the ion-impacted surface in recent years
Mg2+ and Zn2+ can be added easily to the precursor mate-        made it possible to investigate also biological samples
rials [6]. Adding an agent with anti-osteoporotic effects       [23,24]. Major improvements were seen during the last
could improve the osseointegration of the implant which         two decades, and currently the application of ToF-
would cause a better fracture healing [7]. Strontium ions       SIMS to the analysis of tissue sections and single cells
have been proven as an effective anti-osteoporotic drug         is quickly advancing [25,26]. Several groups have
through their antiresorptive and bone-forming effects [8].      shown that ToF-SIMS is a powerful technique to
In vitro experiments showed that strontium enhances the         characterize cells [27] and to achieve 3D analysis of
proliferation of preosteoblastic cells and bone matrix syn-     cells [28-30]. It was also demonstrated that it is pos-
thesis [9]. And it was also found that it reduces the osteo-    sible to investigate the mineralized extracellular matrix
clast activity [10]. Furthermore it has been demonstrated       of osteoblasts [31].
that strontium is incorporated into mineralized nodules           Here we use ToF-SIMS to investigate whether stron-
without any negative effect on the formation of mineral-        tium is incorporated in the mineralized extracellular
ized matrix even in long-term treatment of osteoblast like      matrix (mECM) and whether there is strontium uptake
cells with strontium ranelate in the growth medium [11].        by osteogenically differentiated human mesenchymal
It has also been demonstrated that strontium stimulates         stem cells (hMSCs). Therefore the distribution of the
bone formation and decreases bone resorption in vivo            strontium mass signal in mineralized extracellular
[12,13]. Clinical studies in postmenopausal osteoporotic        matrix of osteoblast-like cells cultured on two different
patients showed a beneficial effect of orally administered      strontium enriched bone cements was analyzed with
strontium ranelate on fracture risk and micro architecture      high spatial resolution. Also the strontium intensity in
[14,15]. Therefore strontium ranelate is increasingly used      the osteoblast-like cells relocated from the biomaterials
in treatment strategies for osteoporosis [16]. Recently Li      to silicon wafers was monitored, which may help to
et al. found an improvement of implant osseointegration         understand the beneficial effect of strontium on osteo-
in osteoporotic rats, which had an additional oral dispense     blasts better.
of strontium ranelate [17]. But Leeuwenkamp et al.
showed that the bioavailability of orally administered          Methods
strontium is only about 20% [18]. Therefore, in order to        Cement modification with strontium (II)
increase the local strontium dosage new types of stron-         Strontium (II) was introduced into a hydroxyapatite
tium enriched calcium phosphate bone cements have               forming, α-tricalcium phosphate based cement by (a)
recently been developed to achieve a local release of stron-    the addition of strontium carbonate or by (b) complete
tium ions into the bone defect [19].                            substitution of CaCO3 (a component of the standard ce-
  In this paper we report on the influence of these             ment precursor formulation) by SrCO3 as described in
strontium enriched biomaterials on the behavior of              detail elsewhere [19]. Briefly, cement precursor powder
osteoblast-like cells and the formation of their mineral-       (InnoTERE GmbH, Radebeul, Germany) was composed
ized extracellular matrix (mECM) as analyzed by time-           of α-tricalcium phosphate (α-TCP), dicalcium phosphate
of-flight secondary ion mass spectrometry (ToF-SIMS).           (monetite), calcium carbonate (CaCO3) and hydroxy-
ToF-SIMS is a highly surface-sensitive and chemically           apatite (HA). In substitution-type samples, CaCO3 was
specific analytical technique for both inorganic and            replaced with SrCO3 (samples denoted as S100), whilst
organic matter. A focused primary ion beam is used to           10 wt-% SrCO3 were added to the precursor powder in
generate ionized molecular fragments from a solid               samples referred to as A10. Therefore, in S100 samples
sample in ultra-high vacuum. These secondary ions are           a homogenous substitution of Ca2+- by Sr2+- ions could
then separated by their mass-to-charge ratio using a            be obtained, whereas A10 samples are characterised by
time-of-flight mass analyzer [20,21]. By carefully              SrCO3 clusters embedded in a Sr-free cement matrix
analyzing the mass spectrum the chemical composition            [19]. Cylindrical samples of 10 mm diameter and
of the sample can be reconstructed. As the primary ion          approx. 1 mm height were manually prepared by
beam can be rasterized across the sample surface an             moulding a paste prepared from the precursor powder
image of the intensity distribution of a selected mass          mixed with 400 μL g-1 4% Na2HPO4 (Sigma Aldrich,
signal can be obtained [22]. By using an additional ion         Taufkirchen, Germany) solution in water. Samples were
gun (sputter gun), which is much more intensive than            cured for 4 days in water-saturated atmosphere at 37°C
the analysis gun (primary ion gun), it is possible to           and subsequently sterilised (γ-radiation, 25 kGy). A Sr-free
remove a small area of the sample layer by layer to get         standard calcium phosphate cement (CPC) prepared
three-dimensional mass information. This technique has          according to the same protocol was used as a control
been applied to a wide range of materials. The development      material.
Kokesch-Himmelreich et al. Biointerphases 2013, 8:17                                                                          Page 3 of 12
http://www.biointerphases.com/content/8/1/17

Cell culture                                                              (ION-TOF, Münster, Germany) equipped with a 25 keV
Primary human mesenchymal stem cells (hMSC) isolated                      bismuth primary ion-source and a 2 keV O2 sputter ion-
from the bone marrow of 3 donors kindly provided by                       gun. To investigate the pure cements and the mECM of
the Medical Clinic I, Dresden University Hospital “Carl                   the cement cultured cells, sample imaging was performed
Gustav Carus” (Prof. Martin Bornhäuser and co-                            within an area of 120 × 120 μm2 to 250 × 250 μm2 using
workers) were used after given consent. The ethics com-                   Bi3+ cluster ions. Each scan provides an image with 128 ×
mission of Technische Universität Dresden approved                        128 pixels and an approximate pixel size of 5–10 μm. The
application of hMSC for in vitro experiments. Cells                       target current was 0.3 pA - 0.4 pA and the ion dose dens-
were cultured in α-MEM containing 9% fetal calf serum                     ity was about 1∙1012 1/cm2. Images were recorded using
(FCS), 10 U mL-1 penicillin, 100 μg mL-1 streptomycin                     the high current bunch mode with high mass resolution
and 1% L-glutamine (all purchased from Biochrom,                          (m/Δm FWHM > 4000). For calibration the masses of the
Berlin, Germany) at 37°C and 5% CO2. Two different                        molecules CH3+, C2H3+, C3H5+ and C7H7+ were used. To
types of cell samples were prepared. On the one hand                      compare the ToF-SIMS mass images with optical images
cells were seeded onto biomaterials (CPC, A10 and                         the 2D mode of a PLu neox 3D optical profiler (Sensofar,
S100) to study matrix formation and mineralization                        Terrassa, Spain) equipped with a blue LED at 460 nm
in vitro. 2 · 104 cells of the 5th passage were cultured for              wavelength was used.
21 days in the presence of osteogenic supplements (10-8 M                    For 3D-analysis of the osteoblast-like cells, cells were
dexamethasone, 5 mM β-glycerophosphate and 0.05 mM                        relocated from the cements to silicon wafers to avoid
ascorbic acid 2-phosphate, all purchased from Sigma                       mixing effects close to the cement/cell interface. For the
Aldrich, Taufkirchen, Germany). On the other hand                         3D-analysis the oxygen sputter gun was used because
relocated cells were used to study the strontium content                  further experiments have shown that strontium shows a
inside the cells. Therefore cells cultured on cement                      higher ionization rate by using O2+ instead of C60+ or Cs+.
samples were detached using trypsin/EDTA (Invitrogen)                     The comparison between 3D profiles obtained by different
for 15 min, transferred to silicon wafers (Si-MAT,                        analytical methods showed that virtually no differential
Kaufering, Germany) and allowed to adhere for 24 h                        sputtering occurred during the depth profiling using the
(CPC r, B10 r, S100 r). Several control groups on silicon                 oxygen sputter gun (Additional file 1). O2+ - sputtering was
wafers were also prepared. 2 · 104 cells of the 5th pas-                  performed on a 400 × 400 μm2 area with a kinetic energy
sage were seeded onto silicon wafers and cultured in                      of 500 eV. The current at the target ranged between
differentiation medium for one (Si1a-c) or 21 days (Si21d).               90 nA - 100 nA. The analysis sequence included a sputter
In case of some of the cells cultured on silicon wafers for               cycle of 1 s followed by acquisition of 10 scans in high
21 days, the medium was further supplemented with                         current bunch mode in the respective crater center of
0.1 mM (SrCl2 0.1) and 1.0 mM SrCl2 (SrCl2 1.0), respect-                 100 × 100 μm2. Data evaluation was performed using the
ively. The strontium chloride was purchased from Sigma                    software TOF-SIMS Surface Lab 6.3 (ION-TOF GmbH,
Aldrich. One load of the cell samples cultured with                       Germany). For 3D reconstruction of the depth profiles the
1.0 mM SrCl2 was relocated afterwards on a silicon wafer                  NESAC/BIO toolbox ZCorrectorGUI based on MATLAB
(SrCl2 1.0 r). All cell samples were washed with phosphate                was used [32].
buffered saline (PBS, Invitrogen) and fixed with 3.7%                        In order to compare the relative intensities of the
glutaraldehyde (Sigma Aldrich), dehydrated in ethanol                     strontium signal from the depth profiles of different
(VWR, Darmstadt, Germany) and subsequently critical-                      samples the following procedure was carried out:
point dried (CPD 030, Bal-Tec, Liechtenstein). Details of
all samples are summarized in Tables 1 and 2.                               1. Three adherent cells of each sample were depth
                                                                               profiled using the same raster size, primary ion dose
ToF-SIMS analysis                                                              per cycle (1∙1014 1/cm2), and sputter dose per cycle
Pure cement samples and the critical-point dried cell                          (1∙1016 1/cm2).
samples were used for ToF-SIMS analysis. ToF-SIMS                           2. For evaluating the data the same area size of region
data were acquired using a TOF.SIMS 5 instrument                               of interest (ROI) was chosen for every cell and the

Table 1 Samples used to study incorporation of strontium in the mECM
Sample name                               Description                              hMSCs cultured in osteogenic differentiation medium for
   CPC m                             Pure CaP-bone cement.                                                 21 days
   A10 m                  CaP-bone cement with 10 wt-% SrCO3 added.                                        21 days
   S100 m                CaP-bone cement with SrCO3 substituting CaCO3.                                    21 days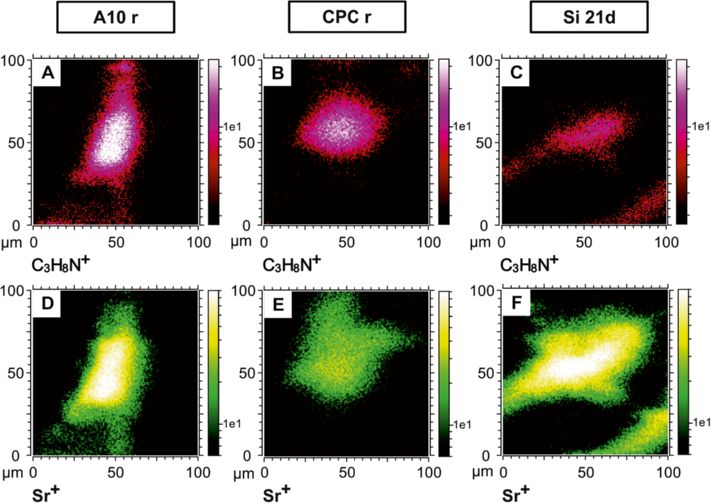
Kokesch-Himmelreich et al. Biointerphases 2013, 8:17                                                                            Page 4 of 12
http://www.biointerphases.com/content/8/1/17

Table 2 Samples used to compare the strontium content inside the osteogenically differentiated hMSCs
Sample name                          Description                          hMSCs cultured in osteogenic differentiation medium for
   Si1d a                       No strontium addition.                                      1 day on a silicon wafer
   Si1d b                       No strontium addition.                                      1 day on a silicon wafer
   Si1d c                       No strontium addition.                                      1 day on a silicon wafer
    Si21d                       No strontium addition.                                     21 days on a silicon wafer
    CPC r                      Pure CaP-bone cement.                21 days on cement, relocated on a silicon wafer and cultured for one day.
    A10 r           CaP-bone cement with 10 wt -% SrCO3 added.      21 days on cement, relocated on a silicon wafer and cultured for one day.
    100 r          CaP-bone cement with SrCO3 substituting CaCO3.   21 days on cement, relocated on a silicon wafer and cultured for one day.
  SrCl2 0.1          0.1 mM SrCl2 solution added to the medium                             21 days on a silicon wafer
  SrCl2 1.0          1.0 mM SrCl2 solution added to the medium                             21 days on a silicon wafer
   SrCl2 r           1.0 mM SrCl2 solution added to the medium           21 days, relocated on a silicon wafer and cultured for one day.

     data were reconstructed from the ROI. The                       given by the distribution of the mass signals. As the bio-
     strontium signal was summed up over 100 sputter                 material contains calcium and strontium we find these
     cycles from each profile and normalized to total                cations and related species in the spectrum (Figure 1 A1).
     counts.                                                         Figure 1 A2 shows the typical pattern of the isotope distri-
                                                                     bution of strontium, which supports the assumption that
  The cell size was determined using the 3D mode of                  the mass signal m/z = 87.9 u represents strontium. In
the PLu neox 3D optical profiler (Sensofar, Terrassa/                Figure 1D the distribution of calcium ions is shown. The
Spain). The thickness of the cells varies between 250 –              calcium image is a negative to the cell signal image, as we
400 nm. This results in estimated sputter rates of 0.2 –             only measured the first monolayers of the sample surface
0.3 nm/s.                                                            (static mode). The distribution of the strontium signals,
                                                                     shown in Figure 1E, is equal to the distribution of the cal-
Results and discussion                                               cium signals (Figure 1D), but the intensity is much lower,
A typical mass spectrum of an area on the strontium                  as the concentration of strontium in the S100 biomaterial
substituted calcium phosphate cement cultured with                   is less than of the calcium.
hMSCs in osteogenic differentiation medium for one day
(S100 1d) is shown in Figure 1 A1. In previous studies               Investigation of the mECM on different bone cements
characteristic mass signals of ToF-SIMS spectra origi-               In the following, two different strontium enriched bone
nating from the cell membrane have been attributed un-               cements are compared with pure calcium phosphate ce-
equivocally to characteristic biomolecules from the cells            ment (CPC) as control. The strontium enriched bone
[33]. These characteristic masses include m/z = 184 u,               cements S100 and A10 differ in the distribution of
being phosphatidylcholine, which is part (head group) of             strontium (II) on the cement surfaces as can be seen in
the most abundant class of phospholipids in mammalian                Figure 2. A homogenous substitution of Ca2+- by Sr2+-
cells. The m/z = 184 u ion (C5H15PNO4+) has a characteris-           ions could be obtained in the case of the new biomaterial
tic fragmentation pattern in parallel, and the major frag-           S100 (Figure 2C). The new bone cement A10 is character-
ments are ions at m/z = 86 u (C5H12N+) and m/z = 58 u                ized by SrCO3 clusters (size about 30 μm), embedded in a
(C3H8N+). These can clearly be seen in the mass                      Sr-free cement matrix (Figure 2B). The differences of the
spectrum in Figure 1 A1. The phosphatidylcholine                     two Sr-enriched biomaterials result from the two different
signal and the signals of its fragments are normally                 preparation methods [19]. Virtually no strontium was
homogenously distributed across the cell surface. Figure 1C          detected on the surface of the pure CPC (Figure 2A).
shows the distribution of the ions m/z = 184 u, 86 u and             Osteogenically differentiated hMSCs were cultured on the
58 u on a sample area which represents the same spot as              three different bone cements. To compare the chemical
in the microscope image in Figure 1B. In the microscope              information of the mineralized extracellular matrix
image the cells are shown in white and the uncovered                 (mECM), synthesized by the osteoblast-like cells, the same
cement in grey. In the SIMS mass images the intensity of             spot of the sample was imaged using the microscope and
the pixels correlate with the intensity of the mass signal. A        the ToF-SIMS. Representative pairs of images for every
bright pixel indicates high intensity of the signal; a dark          material are shown in Figure 3. The first row of Figure 3
pixel indicates low intensity. The mass image of the cell            (A-C) shows the microscope images, and in the second
signals matches the microscope image. Thus it is possible            row (Figure 3D-F) the corresponding ToF-SIMS overlays
to evaluate space-resolved information about the sample              of mass images are depicted. As before, in the microscope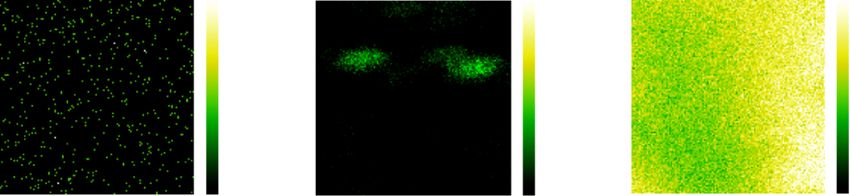
Kokesch-Himmelreich et al. Biointerphases 2013, 8:17                                                                                                            Page 5 of 12
http://www.biointerphases.com/content/8/1/17

                                                                                                   2
                                                                                             x10
                                          1.5
                                                    A1                                                 A2
                                                                                             3.0

                                                                        Intensity (counts)
                                                                                             2.0
                     Intensity (counts)

                                          1.0
                                                                                             1.0

                                                                                                       86.0     86.4       86.8     87.2     87.6    88.0
                                                                                                                               m/ z
                                          0.5
                                                                      x5

                                                                                                                                                      x5

                                                40       60      80                            100             120          140        160          180
                                                                                                        m/z
                                                B                                                                      C
                                                                                                                                                           50

                                                                                                                                                           40

                                                                                                                                                           30

                                                                                                                                                           20
                                                               200 µm                                                                      200 µm
                                                     optical image                                                     MC: 56 TC: 5.4 E+05
                                                                                                                         +      +
                                                                                                                                                      16

                                                D                                             60                       E
                                                                                                                                                          14

                                                                                              50                                                          12

                                                                                              40                                                          10

                                                                                                                                                          8
                                                                                              30
                                                                                                                                                          6
                                                                                              20
                                                                                                                                                          4
                                                           200 µm                                                                          200 µm         2
                                                                                              10
                                                MC: 65 TC: 3.6 E+05                                                    MC: 16 TC: 6.9 E+04
                                                   +    +                                                                +     +
 Figure 1 Mass spectra (A1 and A2), optical image (B) and SIMS mass images (C-E) of strontium substituted calcium phosphate cement
 cultured with hMSCs in osteogenic differentiation medium for one day (S100 1d). Figure A1 shows the labeled masses which were used to
 generated the SIMS mass images. A typical mass pattern of the strontium isotopes is shown in Figure A2. The spatial distribution of the cell mass
 signals (C), calcium signals (D) and strontium signals (E) are shown in the SIMS mass images. The spatial patterns of mass signals offer the same
 morphological information as the microscope image (B), in which the cells are shown in white and the S100 cement in grey.

images (Figure 3A-C) the cells are shown in white, the un-                                                  exhibit the same shape as the white spots in the micro-
covered cement in grey and the mineralized extracellular                                                    scope images, which represent the cells. The calcium
matrix (mECM) is shown in black. In the ToF-SIMS                                                            signal is found in the regions of the uncovered cement
overlays the cell mass signal C3H8N+ is shown in red,                                                       surface and the mECM. In comparison to the control
the calcium signal in blue and the strontium signal in                                                      group (CPC, Figure 3D) a very high strontium signal is
green. The cell mass signals in the SIMS mass images                                                        observed in the region of the mECM in the ToF-SIMS
Kokesch-Himmelreich et al. Biointerphases 2013, 8:17 Page 6 of 12
http://www.biointerphases.com/content/8/1/17
CPC A10 S100
A B C
MC: 2 TC:5.3 E+02 MC: 80 TC: 5.7 E+04 MC: 80 TC: 8.7 E+05
Sr+ Sr+ Sr+
Figure 2 Strontium distribution on the surface of three biomaterials CPC (A), A10 (B) and S100 (C). For B and C the same intensity scale
was used.
image of the S100 sample (Figure 3F). Furthermore, only a the pure CPC and A10 a high intensity of the Ca-signal
weak Ca signal is detected in the mECM due to the low was observed in the region of the mECM. Here stron-
calcium concentration. But it is found that the intensities tium was only found in a few spots of the mECM, and if
of calcium and strontium are not homogenously distrib- so, only a very low intensity of strontium was detected
uted over the different spots of the mECM. Until know (Figure 3D-E). In the case of the strontium enriched
we have no explanation for this finding. In the case of biomaterials previous study showed that strontium is
Figure 3 Light optical microscope images (A-C) and SIMS mass images (D-E) of the mECM synthesized by osteogenically differentiated
hMSCs cultured for 21 days on three different bone cements (CPC m, A10 m, S100 m). In the microscope images the cells are shown in
white, the uncovered cements in grey and the mECM in black (A-C). In the SIMS images the cell mass signal (C3H8N)+ is shown in red, the
calcium signal in blue and the strontium signal in green (D-F).Kokesch-Himmelreich et al. Biointerphases 2013, 8:17 Page 7 of 12
http://www.biointerphases.com/content/8/1/17
released from the biomaterials into the medium [19]. This the strontium and the calcium signal were found. Both
indicates that the cells used most likely the free Sr2+-ions signals remain fairly constant until the silicon wafer is
in the medium to build up their mECM. Since the A10 reached, then the signals of Sr+ and Ca+ decrease again.
samples are characterized by an inhomogeneous distribu- It is known that oxygen sputtering can cause sample
tion of strontium the cells are exposed to different stron- degradation which leads to fragmentation of the organic
tium concentrations. Therefore strontium could be found compounds during depth profiling. This can also explain
in only a small number of matrix nodules. the loss of the lipid signal in the depth profile in Figure 4A.
Previous studies have shown that strontium is incor- In the mass spectrum of the last 100 s of the depth profile
porated in the matrix nodules after cells were cultured the signal of C3H8N+ and also other organic compounds
with strontium salts [11]. How the strontium uptake in like C3H3O+ are still observed (Additional file 2). There-
the mECM takes place is still unknown. It seems likely fore the lateral distribution of the cell signal C3H8N+
that the strontium ion reacts like the calcium ion. Vari- during the depth profile is shown in Figure 4D. For better
ous mechanisms how calcium is taken up into the min- comparison the total ion image is shown in Figure 4C.
eralized extracellular matrix have been postulated: i) a The distribution of the strontium signal can be seen in
cell-independent process where collagen associates with Figure 4E. In these SIMS mass images the intensities
noncollagenous proteins to produce native fibrils, which obtained at different z-values are summed up, i.e. the im-
mediate mineral nucleation [34]; ii) a cell-controlled ages represent depth integrals. The strontium signal is
mechanism by which Ca2+ and phosphate ions are accu- found in the same region as the cell signal. As strontium
mulated in matrix-vesicles extracellulary or iii) calcium could be detected over the whole depth profile and could
and amorphous calcium phosphate are stored inside the not be detected in the outer part of the cell this indicates
cells and transported via vesicles to the ECM [35]. The that strontium is uniformly distributed inside the cell.
same mechanisms may be responsible for the incorpor- To confirm the assumption that strontium has indeed
ation of strontium into the mECM. As there is no native moved into the cell a 3D reconstruction including a z-
storage of strontium inside the cell, it is more likely that correction [32] from the SIMS data of the depth profile
strontium is incorporated extracellulary into the mECM was made. The distribution of the strontium signal
due to a Ca/Sr exchange. (green) and the summed cell signals of C3H8N+, C5H12N+
and C5H15PNO4+ (red) are shown in Figure 4B. Due to
Monitoring the strontium signal inside the cells the O2+ - sputtering the cell signals are unfortunately too
In a next step we compared the strontium content inside weak to reconstruct the whole cell membrane. But we col-
the osteogenically differentiated hMSCs cultured on the lected still enough signal intensity to estimate the shape of
strontium enriched bone cements with cells cultured on the cell. From this 3D illustration it can also be concluded
the pure calcium phosphate cement (CPC) and the sili- that the strontium signal is only distributed inside the cell.
con wafer (Si21d). To analyze the strontium distribution For further data evaluation only the 2D images were used
inside the cells a sputter gun was used to remove the cell since the same interpretation can be achieved with a better
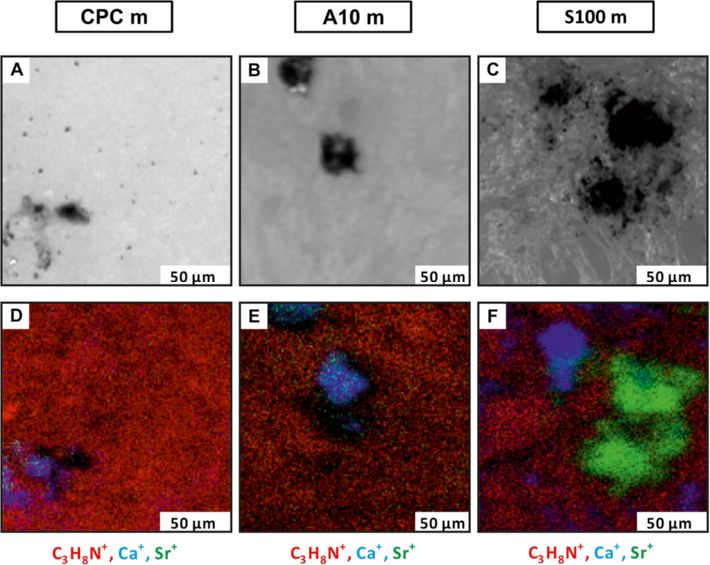
layer by layer. Between the sputter cycles the exposed validity. In Figure 5D the strontium distribution inside a
surfaces were analyzed using the primary ion gun. Since cell cultured on the strontium enriched calcium phosphate
cells are not planar and as the sputter gun was arranged cement A10 can be seen. The same distribution of stron-
at a 45° angle to the sample various removal rates were tium in the cell could be observed. This indicates that
obtained from different spots on the sample. Therefore strontium released by the cements can enter the cells.
the thinner parts of the cell are earlier removed com- As can be seen in Figure 5, strontium was also
pletely than the thicker parts. detected inside the cells of the control groups, relocated
A depth profile of an osteoblast-like cell cultured on cells from the pure CPC (CPC r, Figure 5E) and within
S100 cement for 21 days and relocated afterwards by cells cultured on the silicon wafer (Si21d, Figure 5F). No
trypsination and subsequent re-seeding on a silicon strontium was added to the osteogenic differentiation
wafer (S100 r) can be seen in Figure 4A. The intensities medium of all samples and no Sr could be detected by
of the signals are shown for the cell thickness of 280 nm AAS (atomic absorption spectroscopy) in the purchased
and summed up over the analyzed area which can be and standardized medium (data not shown). But stron-
seen in Figure 4C-E. As the cells were relocated on sili- tium is a trace element and appears often with calcium. It
con wafer the Si-signal increases with sputter time and also occurs in enzymes, which might be the reason why
remains nearly constant after 300 s of the depth profile strontium was found in the negative control groups as
measurement. During the first seconds of sputtering a well (Figure 5E-F). The strontium content in hMSCs of
decrease of the cell signal was observed, which indicates three different patients cultured for one day was analyzed.
that the phospholipid membrane had been removed. Therefore three cells of each donor were depth profiled.
After entering the interior of the cell an increase of both For data evaluation the same area size of region of interestKokesch-Himmelreich et al. Biointerphases 2013, 8:17 Page 8 of 12
http://www.biointerphases.com/content/8/1/17
A S100 r
Si+
10-1 t/s
0
Intensity (counts) / total counts
B
Ca+
10-3
600
Sr+
10-5
1200
0
500 1000 20
60
40 40
60 20
Sr+ and 0
+ +
C 1e5 D E
1e1 1e1
6e4 1e2
0
Total counts Sr+
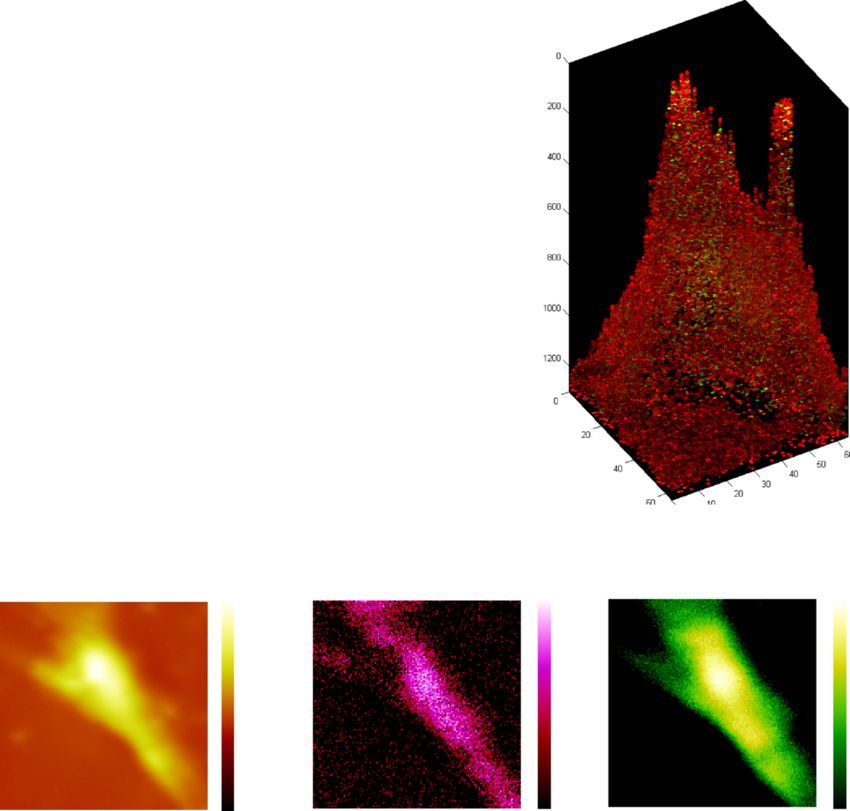
Figure 4 3D analysis of an osteogenically differentiated hMSC. (A) depth profile of an osteogenically differentiated hMSC cultured on S100
relocated after 21 days on a silicon wafer(S100 r). The signal intensity is shown over the whole analysis area. The estimated thickness of the cell is
280 nm. (B) 3D reconstruction of the depth profile showing the distribution of strontium and the cell signals C3H8N+, C5H12N+ and C5H15PNO4+.
The value of the z axis has no physical meaning and depends on the number of layers in the 3D profile. The SIMS mass images show the lateral
distribution summed over the whole depth profile of the total ions (C), cell mass signal C3H8N+ (D) and the strontium signal (E).
was used. In Figure 6 it can be seen that the intensity of were only cultured for one day due to the proliferation.
the strontium signals differs, so it can be suggested that In Figure 5F the strontium content in the cells cultured
the strontium content inside the cells depends on the cell on a silicon wafer for 21 days is almost as high as in the
donor. The cells in Figures 5 and 7 belong to the same cells, cultivated on A10 (5D). This leads to the assump-
donor. The cells investigated in Figure 6 were chosen from tion that strontium is accumulated in the cells. However,
random donors to demonstrate the high variance between to compare the strontium content in the cells cultured
cells from different donors. on the different biomaterials and substrates the hMSCs
After 21 days of cultivation the strontium concentra- from the same donor were used. Again three cells on
tion inside the cells might be lower as in the cells which each type of substrate were measured. The strontiumKokesch-Himmelreich et al. Biointerphases 2013, 8:17 Page 9 of 12
http://www.biointerphases.com/content/8/1/17
Figure 5 SIMS mass images of the cell signals (A-C) and strontium signals (D-F) of osteoblast-like cells. Cells were cultured in osteogenic
differentiation medium on A10 and on the control groups CPC cement and silicon wafer (Si 21d). Cells cultured on the cements were relocated
on a silicon wafer afterwards (A10 r, CPC r). For each mass signal of the different samples the same intensity scale was used.
peak areas of the mass spectra of the different samples could be different afterwards. To investigate the influence
are compared in Figure 7A. The highest strontium con- of the relocation, osteoblast-like cells were cultured with
tent was found in the osteoblast-like cells cultured on 1.0 mM SrCl2 for 21 days and one load was relocated
the strontium enriched cements (S100 r and A10 r), and afterwards by trypsination and subsequent re-seeding on a
the lowest was found in the cells cultured for 21 days on silicon wafer (SrCl2 1.0 r). To clarify whether the intensity
a silicon-wafer (Si21d). A high variation in the strontium of the strontium signal as obtained with ToF-SIMS can be
content of the A10 cells could be observed. As only used as a measure of the strontium concentration; cells
three cells were measured the inhomogeneity of the A10 were cultured on silicon wafers with two different SrCl2
cement sample could cause such variation. In the case of concentrations. The strontium content inside the cells of
the biomaterials the cells were relocated after 21 days on these control groups can be seen in Figure 7B. There is a
silicon wafers. Only perfectly adherent cells were chosen large difference between the strontium intensity of the
for depth profiling but as the relocated cells were no cells cultured with 0.1 mM and 1.0 mM SrCl2. This dia-
longer exposed to additional strontium, and the reloca- gram indicates that it is possible to detect the comparative
tion causes stress for the cells the real strontium content difference of strontium contents inside the cells, which
were exposed to different strontium concentrations via
ToF-SIMS. Furthermore it proves that the strontium
(peak area / total counts)
content in cells will be higher if the cells are exposed to
a higher concentration of strontium. The strontium
content in the relocated cells (SrCl2 1.0 r) is much lower
than in the original sample (SrCl2 1.0). The relocation
of the cells influences the strontium signal. That means
that the original strontium content of the cells cultured
on the cements could be much higher than it is
observed in Figure 7A.
0 However, strontium could be found in the mineralized
Si 1d a Si 1d b Si 1d c
extracellular matrix (mECM) synthesized by the osteoblast-
Figure 6 Strontium content in the hMSCs cultured on silicon like cells cultured on the cements and strontium could be
wafers for one day from three different cell donors (Si 1d a, b, c).
detected in the osteoblast-like cells of every sample type.
Data are expressed as the mean ± standard deviation (n = 3).
But a clear difference in the amount of strontium could beKokesch-Himmelreich et al. Biointerphases 2013, 8:17 Page 10 of 12
http://www.biointerphases.com/content/8/1/17
involved in the Wnt signaling pathway. These combined
A interactions of Sr2+ result in increased osteoblastic
(peak area/total counts)
cell replication, osteoblast gene expression and cell
survival [36]. These beneficial effects on the osteo-
blasts depend on the concentration of the strontium
ions inside the cells. A high strontium concentration
leads to a high impact on the signaling pathways. As
the strontium content inside the cells cultured on the
strontium enriched biomaterials was higher than in
the control groups the newly developed calcium phos-
phate cements S100 and A10 are promising implant
B materials for the use in systemically altered bone.
(peak area/total counts)
Conclusion
It was previously shown that newly developed stron-
tium enriched bone cements release strontium to the
medium [19]. Here we could demonstrate that the re-
leased strontium is incorporated into the mineralized
extracellular matrix (mECM) as well as enriched inside
the osteogenically differentiated hMSCs. In comparison
to the control group we detected a definitely higher
Figure 7 Sr content in osteogenically differentiated hMSCs.
amount of strontium in the mECM of the osteoblast-
(A) Strontium content in osteogenically differentiatedhMSCs from
the same donor as in Figures 4 and 5 cultured onthe three different like cells cultured on the strontium substituted bone
bone cements (CPC r, B10 r, S100 r) and ona silicon wafer for 21 cement S100. The present data are in accordance with
days (Si 21d). (B) Strontium content in osteogenically differentiated previous studies showing that strontium is incorporated
hMSCs cultured on silicon wafers for 21 days with SrCl2 in the in the mECM [11] and in newly formed human bone
growth medium. The first and second column show the Sr content in
[39]. Our results prove that strontium ions from artifi-
cells cultured with 0.1 mM and 1.0 mM SrCl2, respectively in the
medium. The third column shows the Sr content in cells, which were cial biomaterials indeed pass the cellular membrane
relocated after 21 days with 1.0 mM SrCl2 in the medium (SrCl2 r). Data and accumulate inside the osteoblast-like cells. The
are expressed as the mean ± standard deviation (n = 3). strontium was found to be uniformly distributed in the
interior of the cells. The strontium content inside the
cells cultured on the strontium enriched bone cements
observed. The higher the strontium concentration in the is much higher than in cells cultured on the control
medium the higher the intensity of the strontium signals groups. As strontium is known for its beneficial effect
in the osteoblast-like cells and in the mECM. The mech- on osteoblasts the strontium release is a promising
anism of the strontium incorporation into the mECM property of the strontium enriched calcium phosphate
cannot be clarified from this study. Therefore further cements for their use as an implant material for
biomolecular investigations are necessary. As men- osteoporotic bone. In contrast to the A10 samples a
tioned before strontium enhances the replication and homogenous distribution of Sr2+-ions could be
differentiation of pre-osteoblastic cells and the activity obtained in the S100 samples. Therefore the osteoblast-
of functional osteoblasts. Due to that the rate of bone like cells cultured on the S100 biomaterial are exposed
matrix synthesis increases [9]. The molecular targets to the same Sr concentration. This results in a higher
of strontium are still being investigated. As strontium strontium concentration in the osteoblast-like cells,
is a divalent ion and chemically close to Ca2+, Sr2+ cultured on the S100 biomaterial and in their mECM.
may act on similar cellular targets as the calcium ion In conclusion, the strontium substituted calcium phos-
[36]. In the case of calcium the uptake into osteoblasts phate cement S100 could be proposed as a promising
takes place due to different families of calcium ion chan- biomaterial for the treatment of bone defects in osteo-
nels inside the phospholipid membrane [37]. As the ionic porotic patients.
radius of strontium is twice that of calcium, it is more
likely that strontium passes the membrane using one of Additional files
the non-selective ion channels. It was demonstrated that
strontium plays an important role in signaling pathways in Additional file 1: A) 3D profile of a cell cultured on S100 for 21 days
osteoblasts. On the one hand it activates the calcium sen- and relocated to a silicon wafer obtained by the PLu neox 3D
optical profiler before the cell was depth profiled with ToF-SIMS.
sor receptor (CaSR) [38] on the other hand strontium isKokesch-Himmelreich et al. Biointerphases 2013, 8:17 Page 11 of 12
http://www.biointerphases.com/content/8/1/17
B) 3D reconstruction of the same cell as in A) using SIMS data. C) 2D 9. Canalis E, Hott M, Deloffre P, Tsouderos Y, Marie PJ (1996) The divalent
image in false color map of the same cell. The black line indicates the strontium salt S12911 enhances bone cell replication and bone formation
position of the corresponding z profile in D). To compare the 3D profiles in vitro. Bone 18:517–523
obtained with different analytical methods we have to take into account 10. Bonnelye E, Chabadel A, Saltel F, Jurdic P (2008) Dual effect of strontium
that we cannot proper scale the z axis of the SIMS depth profile with the ranelate: Stimulation of osteoblast differentiation and inhibition of
applied software tool and it is difficult to look at the exact same cross- osteoclast formation and resorption in vitro. Bone 42:129–138
section of the cell. Considering these facts the 3d profiles look nearly the 11. Barbara A, Delannoy P, Denis BG, Marie PJ (2004) Normal matrix
same. This leads us to the assumption that rarely differential sputtering mineralization induced by strontium ranelate in MC3T3-E1 osteogenic cells.
occurs. Metabolism 53:532–537
12. Ammann P, Shen V, Robin B, Mauras Y, Bonjour JP, Rizzoli R (2004)
Additional file 2: Mass spectra of the last 100 s of a depth profile Strontium ranelate improves bone resistance by increasing bone mass
from a cell cultured on S100 for 21 days and relocated to a silicon and improving architecture in intact female rats. J Bone Miner Res
wafer. Organic compounds like the C3H3O+ ion, which is most likely a 19:2012–2020
fragment of an amino acid can still be observed. 13. Boivin G, Deloffre P, Perrat B, Panczer G, Boudeulle M, Mauras Y, Allain P,
Tsouderos Y, Meunier PJ (1996) Strontium distribution and interactions with
bone mineral in monkey iliac bone after strontium salt (S 12911)
Competing interests administration. J Bone Miner Res 11:1302–1311
The authors declare that they have no competing interests. 14. Meunier PJ, Roux C, Seeman E, Ortolani S, Badurski JE, Spector TD, Cannata
J, Balogh A, Lemmel EM, Pors-Nielsen S, Rizzoli R, Genant HK, Reginster JY
Authors’ contribution (2004) The effects of strontium ranelate on the risk of vertebral fracture in
JKH carried out the ToF-SIMS measurement evaluated and interpreted the women with postmenopausal osteoporosis. N Engl J Med 350:459–468
data and drafted the manuscript. MS made the biomaterials and planned 15. Roschger P, Manjubala I, Zoeger N, Meirer F, Simon R, Li C, Fratzl-Zelman N,
and carried out the cell culture experiments. MG was involved in designing Misof BM, Paschalis EP, Streli C, Fratzl P, Klaushofer K (2010) Bone material
the cell culture experiments and revised the manuscript. MR helped to quality in transiliac bone biopsies of postmenopausal osteoporotic women
design the ToF-SIMS measurement and has been involved in drafting the after 3 years of strontium ranelate treatment. J Bone Miner Res 25:891–900
manuscript. JJ adjusted and proof read the manuscript. All authors read and 16. Marie PJ (2007) Strontium ranelate: New insights into its dual mode of
approved the final manuscript. action. Bone 40:S5–S8
17. Li Y, Li X, Song G, Chen K, Yin G, Hu J (2012) Effects of strontium ranelate
on osseointegration of titanium implant in osteoporotic rats. Clin Oral
Acknowledgments Implants Res 23:1038–1044
The authors thank Prof. Dr. Sabine Wenisch for helpful advice in writing the 18. Leeuwenkamp OR, van der Vijgh WJ, Husken BC, Lips P, Netelenbos JC
manuscript. The authors thank Dan Graham, Ph.D., for developing the (1990) Human pharmacokinetics of orally administered strontium. Calcif
NESAC/BIO Toolbox used in this study and NIH grant EB-002027 for Tissue Int 47:136–141
supporting the toolbox development. This study was funded by the 19. Schumacher M, Henss A, Rohnke M, Gelinsky M (2013) A novel and easy-to
Deutsche Forschungsgemeinschaft (DFG) as part of the Collaborative -prepare strontium (II) modified calcium phosphate bone cement with
Research Centre/Transregio 79 (SFB/TRR 79 – subproject M5, in collaboration enhanced mechanical properties. Acta Biomater 9:7536–7544
with M2). 20. Benninghoven A (1994) Surface analysis by secondary Ion mass
spectrometry (SIMS). Surf Sci 299–300:246–260
Author details 21. De Souza RA, Manfred M (2007) Secondary ion mass spectrometry (SIMS) –
1
Institute for Physical Chemistry, Justus - Liebig - University Giessen, a powerful tool for studying mass transport over various length scales.
Heinrich-Buff-Ring 58, 35392, Giessen, Germany. 2Centre for Translational physica status solidi (c) 4:1785–1801
Bone, Joint and Soft Tissue Research, Technische Universität Dresden, 22. Vickerman JC, Briggs D (2001) ToF-SIMS: surface analysis by mass
Fetscherstrasse 74, 01307, Dresden, Germany. spectrometry. IM Publications
23. Winograd N (2005) The magic of cluster SIMS. Anal Chem 77:143A–149A
Received: 17 May 2013 Accepted: 18 July 2013 24. Fletcher JS, Lockyer NP, Vickerman JC (2011) Developments in molecular
Published: 23 July 2013 SIMS depth profiling and 3D imaging of biological systems using
polyatomic primary ions. Mass Spectrom Rev 30:142
References 25. Brunelle A, Touboul D, Laprevote O (2005) Biological tissue imaging with
1. Rachner TD, Khosla S, Hofbauer LC (2011) Osteoporosis: now and the future. time-of-flight secondary ion mass spectrometry and cluster ion sources.
Lancet 377:1276–1287 J Mass Spectrom 40:985–999
2. Bonnaire F, Zenker H, Lill C, Weber AT, Linke B (2005) Treatment strategies 26. Fletcher JS (2009) Cellular imaging with secondary ion mass spectrometry.
for proximal femur fractures in osteoporotic patients. Osteoporos Int 16 Analyst 134:2204–2215
(Suppl 2):S93–S102 27. Fartmann M, Dambach S, Kriegeskotte C, Wiesmann HP, Wittig A, Sauerwein
3. Bohner M, Lemaitre J, Cordey J, Gogolewski S, Ring TA, Perren SM (1992) W, Lipinski D, Arlinghaus H (2002) Characterization of cell cultures with
Potential use of biodegradable bone cement in bone surgery: holding ToF-SIMS and laser-SNMS. Surf Interface Anal 34:63–66
strength of screws in reinforced osteoporotic bone. Orthop Trans 28. Malmberg P, Kriegeskotte C, Arlinghaus HF, Hagenhoff B, Homlgren J,
16:401–402 Nilsson M, Nygren H (2008) Depth profiling of cells and tissue by using C +
4. Bucholz RW (2002) Nonallograft osteoconductive bone graft substitutes. 60 and SF5+ as sputter ions. Appl Surf Sci 255:1264–1270
Clin Orthop Relat Res 395:44–52 29. Nygren H, Hagenhoff B, Malmberg P, Nilsson M, Richter K (2007) Bio
5. Bohner M (2007) Reactivity of calcium phosphate cements. J Mater Chem imaging TOF-SIMS: High resolution 3D imaging of single cells. Microsc Res
17:3980–3986 Tech 70:969–974
6. Boanini E, Gazzano M, Bigi A (2010) Ionic substitutions in calcium 30. Brison J, Benoit DSW, Muramoto S, Robinson M, Stayton PS, Castner DG
phosphates synthesized at low temperature. Acta Biomater 6:1882–1894 (2011) ToF-SIMS imaging and depth profiling of HeLa cells treated with
7. Thormann U, Ray S, Sommer U, ElKhassawna T, Rehling T, Hundgeburth M, bromodeoxyuridine. Surf Interface Anal 43:354–357
Henß A, Rohnke M, Janek J, Lips KS, Heiss C, Schlewitz G, Szalay G, 31. Dambach S, Fartmann M, Kriegeskotte C, Brüning C, Hellweg S, Wiesmann
Schumacher M, Gelinsky M, Dimitrakopoulou-Strauss A, Schnettler R, Alt V HP, Lipinski D, Arlinghaus HF (2004) ToF-SIMS and laser-SNMS analysis of
(2013) Bone formation induced by strontium modified calcium phosphate apatite formation in extracellular protein matrix of osteoblasts in vitro. Surf
cement in critical-size metaphyseal fracture defects in ovariectomized rats. Interface Anal 36:711
Biomater accepted 32. Robinson MA, Graham DJ, Castner DG (2012) ToF-SIMS depth profiling of
8. Marie PJ, Ammann P, Boivin G, Rey C (2001) Mechanisms of action and cells: z-correction, 3D imaging, and sputter rate of individual NIH/3T3
therapeutic potential of strontium in bone. Calcif Tissue Int 69:121–129 fibroblasts. Anal Chem 84:4880–4885Kokesch-Himmelreich et al. Biointerphases 2013, 8:17 Page 12 of 12
http://www.biointerphases.com/content/8/1/17
33. Fletcher JS, Rabbani S, Henderson A, Lockyer NP, Vickerman JC (2010)
Three-dimensional mass spectral imaging of HeLa-M cells-sample
preparation, data interpretation and visualisation. Rapid Commun Mass
Spectrom 25:925
34. Glimcher MJ (1984) Recent studies of the mineral phase in bone and its
possible linkage to the organic matrix by protein-bound phosphate bonds.
Philos Trans R Soc Lond B Biol Sci 304:479–508
35. Boonrungsiman S, Gentleman E, Carzaniga R, Evans ND, McComb DW,
Porter AE, Stevens MM (2012) The role of intracellular calcium phosphate in
osteoblast-mediated bone apatite formation. Proc Natl Acad Sci USA
109:14170–14175
36. Saidak Z, Marie PJ (2012) Strontium signaling: Molecular mechanisms and
therapeutic implications in osteoporosis. Pharmacology & Therapeutics
136:216–226
37. Lieben L, Carmeliet G (2012) The involvement of TRP channels in bone
homeostasis. Front Endocrinol (Lausanne) 3:99
38. Takaoka S, Yamaguchi T, Yano S, Yamauchi M, Sugimoto T (2010) The
Calcium-sensing Receptor (CaR) is involved in strontium ranelate-induced
osteoblast differentiation and mineralization. Horm Metab Res 42:627–631
39. Li C, Paris O, Siegel S, Roschger P, Paschalis EP, Klaushofer K, Fratzl P (2010)
Strontium is incorporated into mineral crystals only in newly formed bone
during strontium ranelate treatment. J Bone Miner Res 25:968–975
doi:10.1186/1559-4106-8-17
Cite this article as: Kokesch-Himmelreich et al.: ToF-SIMS analysis of
osteoblast-like cells and their mineralized extracellular matrix on
strontium enriched bone cements. Biointerphases 2013 8:17.
Submit your manuscript to a
journal and benefit from:
7 Convenient online submission
7 Rigorous peer review
7 Immediate publication on acceptance
7 Open access: articles freely available online
7 High visibility within the field
7 Retaining the copyright to your article
Submit your next manuscript at 7 springeropen.comYou can also read