Type I interferon suppresses tumor growth through activating the STAT3-granzyme B pathway in tumor-infiltrating cytotoxic T lymphocytes
←
→
Page content transcription
If your browser does not render page correctly, please read the page content below
Lu et al. Journal for ImmunoTherapy of Cancer            (2019) 7:157

                                                                                                                                                                          J Immunother Cancer: first published as 10.1186/s40425-019-0635-8 on 22 June 2019. Downloaded from http://jitc.bmj.com/ on February 27, 2021 by guest. Protected by copyright.
https://doi.org/10.1186/s40425-019-0635-8

 RESEARCH ARTICLE                                                                                                                               Open Access

Type I interferon suppresses tumor growth
through activating the STAT3-granzyme B
pathway in tumor-infiltrating cytotoxic T
lymphocytes
Chunwan Lu1,2,3*, John D. Klement1,2,3, Mohammed L. Ibrahim1,2,3, Wei Xiao1,2, Priscilla S. Redd1,2,3,
Asha Nayak-Kapoor2, Gang Zhou2 and Kebin Liu1,2,3*

  Abstract
  Background: Type I interferons (IFN-I) have recently emerged as key regulators of tumor response to chemotherapy
  and immunotherapy. However, IFN-I function in cytotoxic T lymphocytes (CTLs) in the tumor microenvironment is
  largely unknown.
  Methods: Tumor tissues and CTLs of human colorectal cancer patients were analyzed for interferon (alpha and beta)
  receptor 1 (IFNAR1) expression. IFNAR1 knock out (IFNAR-KO), mixed wild type (WT) and IFNAR1-KO bone marrow
  chimera mice, and mice with IFNAR1 deficiency only in T cells (IFNAR1-TKO) were used to determine IFN-I function in T
  cells in tumor suppression. IFN-I target genes in tumor-infiltrating and antigen-specific CTLs were identified and
  functionally analyzed.
  Results: IFNAR1 expression level is significantly lower in human colorectal carcinoma tissue than in normal colon tissue.
  IFNAR1 protein is also significantly lower on CTLs from colorectal cancer patients than those from healthy donors.
  Although IFNAR1-KO mice exhibited increased susceptibility to methylcholanthrene-induced sarcoma, IFNAR1-sufficient
  tumors also grow significantly faster in IFNAR1-KO mice and in mice with IFNAR1 deficiency only in T cells (IFNAR1-TKO),
  suggesting that IFN-I functions in T cells to enhance host cancer immunosurveillance. Strikingly, tumor-infiltrating CTL
  levels are similar between tumor-bearing WT and IFNAR1-KO mice. Competitive reconstitution of mixed WT and IFNAR1-
  KO bone marrow chimera mice further determined that IFNAR1-deficient naïve CTLs exhibit no deficiency in response to
  vaccination to generate antigen-specific CTLs as compared to WT CTLs. Gene expression profiling determined that Gzmb
  expression is down-regulated in tumor-infiltrating CTLs of IFNAR1-KO mice as compared to WT mice, and in antigen-
  specific IFNAR1-KO CTLs as compared to WT CTLs in vivo. Mechanistically, we determined that IFN-I activates STAT3 that
  binds to the Gzmb promoter to activate Gzmb transcription in CTLs.
  Conclusion: IFN-I induces STAT3 activation to activate Gzmb expression to enhance CTL effector function to suppress
  tumor development. Human colorectal carcinoma may use down-regulation of IFNAR1 on CTLs to suppress CTL effector
  function to evade host cancer immunosurveillance.
  Keywords: Type I interferon, CTLs, STAT3, Granzyme B, Colon Cancer

* Correspondence: Clu@augusta.edu; Kliu@augusta.edu
1
 Department of Biochemistry and Molecular Biology, Medical College of
Georgia, Augusta, GA 30912, USA
Full list of author information is available at the end of the article

                                       © The Author(s). 2019 Open Access This article is distributed under the terms of the Creative Commons Attribution 4.0
                                       International License (http://creativecommons.org/licenses/by/4.0/), which permits unrestricted use, distribution, and
                                       reproduction in any medium, provided you give appropriate credit to the original author(s) and the source, provide a link to
                                       the Creative Commons license, and indicate if changes were made. The Creative Commons Public Domain Dedication waiver
                                       (http://creativecommons.org/publicdomain/zero/1.0/) applies to the data made available in this article, unless otherwise stated.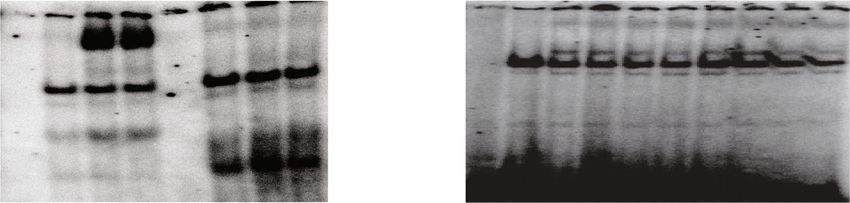
Lu et al. Journal for ImmunoTherapy of Cancer   (2019) 7:157                                                       Page 2 of 11

                                                                                                                                  J Immunother Cancer: first published as 10.1186/s40425-019-0635-8 on 22 June 2019. Downloaded from http://jitc.bmj.com/ on February 27, 2021 by guest. Protected by copyright.
Background                                                        are age and sex-matched mice. Use of mice was performed
Type I interferons IFNα and IFNβ (IFN-I) are pleiotropic          according to approved protocols by institutional animal
cytokines that were originally identified as viral replication    use and care committee. Peripheral blood samples were
suppressor. However, IFN-I function has since been                collected from consented healthy donors in Shepheard
extended to cancer suppression [1–5] and IFNα is now              Community Blood bank. Human colon cancer patient
approved for the treatment of both solid and hematologic          blood specimens were collected from consented patients in
tumors [6–8]. Unlike the type II interferon IFNγ, which           Georgia Cancer Center under approved protocol by
exhibits restricted expression in activated T cells and NK        Augusta University Institutional Review Board.
cells [9], there are 14 isoforms of IFNα [10] that are
expressed in hematopoietic cells, particularly in dendritic       Mouse tumor models
cells (DCs), whereas IFNβ is expressed in most cell types         Sarcoma was induced by injecting methylcholanthrene
[11]. The mechanism underlying IFN-I function in tumor            (MCA, 100 μg/mouse in peanut oil, Sigma-Aldrich, St
suppression is currently an extensively studied subject and       Louis, MO) to mice subcutaneously.
it has long been thought that IFN-I suppresses tumor de-
velopment through their intrinsic functions in tumor cells.       Mixed bone marrow chimera mouse model and
Indeed, IFN-I regulates the expression of various genes that      immunizations
modulate tumor cell growth, proliferation, migration, apop-       Mixed BM chimera mice was created as previously de-
tosis, tumor antigen expression, and immune checkpoint-           scribed [26] using BM cells from SJL and IFNAR1-KO
mediated immune suppression [12–18]. In human cancer              mice (at 1:1 ratio of SJL: IFNAR1-KO) (Additional file 1
patients, the tumor cell autologous IFN-I signaling controls      Figure S2). Mice were immunized with the 2W1S peptide
cancer response to chemotherapy [1], and mutations in             (EAWGALANWAVDSA) to activate CD4+ T cells [27]
mediators of the IFN-I signaling pathways in tumor cells          and with the OVA peptide (SIINFEKL) to activate CD8+ T
confer human cancer non-response to immune checkpoint             cells [28] as previously described and analyzed for antigen-
inhibitor immunotherapy [19, 20].                                 specific T cells as previously described [26].
   Recent breakthroughs in immune checkpoint inhibitor
cancer immunotherapy demonstrated the critical role of            Tumor cell lines
activated T cells in host cancer immunosurveillance. T cells      Murine colon carcinoma MC38 cells were characterized
are the main adaptive immune cells that directly target           as previously described [29].
tumor cells for lysis [21–23]. It is well documented that
IFN-I deficiency leads to increased tumor incidence [24]          Antibodies and reagents
and IFN-I regulates dendritic cell priming of T cells to exe-     Fluorescent dye-conjugated antibodies that are specific for
cute tumor suppressive activity [25]. Therefore, in addition      CD45, CD4, CD8, and Zombie violet were obtained from
to the tumor cells, T cell might be another target of IFN-I       Biolegend (San Diego, CA). pSTAT1 inhibitor Fludarabine
in regulation of anti-tumor immune response. However,             [30] and pSTAT3 inhibitor Stattic [31] were obtained from
the intrinsic function of IFN-I in regulating T cell activation   Santa Cruz. The 2W1S and OVA tetramers were provided
and cytotoxicity in the context of host cancer immunosur-         by the NIH Tetramer Core Facility (Emory University,
veillance is largely unknown. We report here that the in-         GA). The cells were stained with 0.15 μl 2W1S and 0.25 μl
trinsic IFN-I signaling pathway is essential for CTL effector     OVA tetramers. All the antibodies and reagents are listed
function in tumor suppression and human colorectal                in Additional file 1 Table S1.
carcinoma may use down-regulation of the IFNAR1 on
CTLs to impair CTL effector function to evade host cancer         Analysis of DNA-protein interactions by electrophoretic
immunosurveillance. Our findings thus extend IFN-I func-          mobility shift assay (EMSA)
tion to CTLs in host cancer immunosurveillance.                   Tumor-specific 2/20 CTLs were maintained as previously
                                                                  described [32]. T cells were cultured with recombinant IFNα,
Methods                                                           and IFNβ, respectively for 1 h for nuclear extract prepar-
Mice and human specimens                                          ation. The WT pSTAT3 consensus probe forward sequence
IFNAR1 knock out mice [B6(Cg)-Ifnar1tm1.2Ees/J (IFNAR1-           is 5′- GATCCTTCTGGGAATTCCTAGATC − 3′ and re-
KO) were obtained from Jackson Laboratory (Bar Harbor             verse sequence is 3′- CTAGGAAGACCCTTAAGGATC
ME). Mice with IFNAR1 deficiency only in T cells                  TAG-5′ (Santa Cruz Cat# sc-2571). The pSTAT3 mutant
(IFNAR1-TKO) were created by crossing Ifnar1fl (B6(Cg)-           probe forward sequence is 5′- GATCCTTCTGGGCCGTC
Ifnar1tm1.1Ees/J) mouse with B6.Cg-Tg (lck-cre)548Jxm/J           CTAGATC-3′ and reverse sequence is 3′-CTAGGAAG
mouse (Jackson Laboratory). SJL (B6.SJL-Ptprca Pepcb/             ACCCGGCAGGATCTAG-5′ (Santa Cruz cat# sc-2572).
BoyJ) and female C57BL/6 mice were obtained from the              The end-labeled pSTAT3 probe were incubated with nuclear
Jackson Laboratory. The control and experiment groups             extracts and analyzed by EMSA as previously described [33].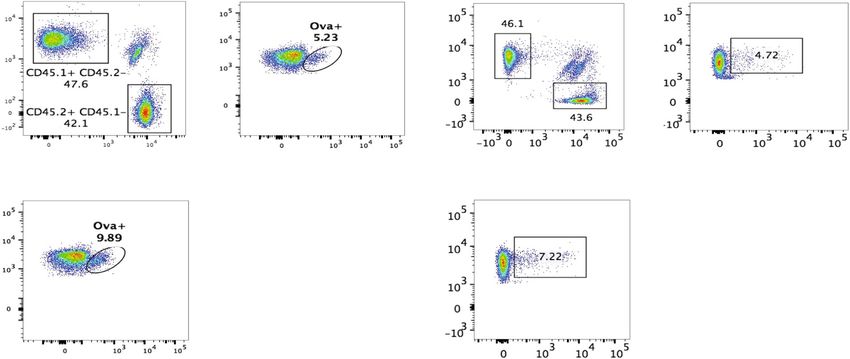
Lu et al. Journal for ImmunoTherapy of Cancer               (2019) 7:157                                                                 Page 3 of 11

                                                                                                                                                        J Immunother Cancer: first published as 10.1186/s40425-019-0635-8 on 22 June 2019. Downloaded from http://jitc.bmj.com/ on February 27, 2021 by guest. Protected by copyright.
Gene expression and Western blotting analysis                                   capture code set using the Nanostring immunology gene
Gene expression was analyzed using RNA and gene-specific                        panel at 65 °C and analyzed on an nCounter instrument ac-
primers in the StepOne Plus Real-Time PCR System (Ap-                           cording to the manufacturer’s instructions. Digital images
plied Biosystems). The PCR primers are: mouse Gzmb for-                         are processed within the nCounter instrument, and the Re-
ward 5′- GCCCACAACATCAAAGAACAGG-3′, Gzmb                                        porter Probe counts were tabulated in a comma separated
reverse 5′-CGTATCAGGAAGCCACCGCAC-3′; mouse β-                                   value (CSV) format for convenient data analysis with Nano-
actin forward 5′- TGAAGGTGACAGCAGTCGGTTG-3′,                                    String’s free nSolver™ Analysis Software V.3.
β-actin reverse 5′- GGCTTTTAGGATGGCAAGGGAC-
3′. Western blotting analysis was performed as previously                       Statistical analysis
described [34]. Antibodies are listed in Additional file 1                      All statistical analysis were performed by two-sided Student
Table S1.                                                                       t test using the GraphPad Prism program (GraphPad Soft-
                                                                                ware, Inc.). p < 0.05 is considered as statistically significant.
Analysis of immune gene expression in CTLs
Tumor tissues were digested with collagenase, followed by                       Results
incubation with anti-CD8 mAb-coated magnetic beads                              IFNAR1 is down-regulated in CTLs of human colon cancer
(Biolegend), and separation by a magnetic stand. RNA was                        patients
purified from cells bound to the beads. WT and IFNAR1-                          IFNAR1 mediates all isoforms of IFN-I signaling. Ana-
KO CD8+ T cells were also isolated from OVA peptide-                            lysis of TCGA dataset revealed that the IFNAR1 expres-
vaccinated mice by cell sorting and used for RNA purifica-                      sion level is significantly down-regulated in human
tion. RNA was hybridized overnight with reporter and                            colon carcinomas as compared to the normal colon

                             A                             p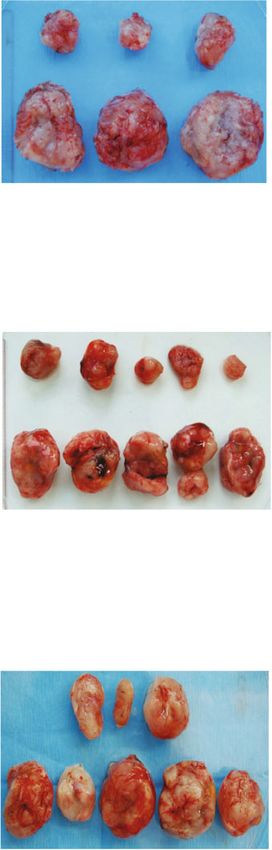
Lu et al. Journal for ImmunoTherapy of Cancer (2019) 7:157 Page 4 of 11
J Immunother Cancer: first published as 10.1186/s40425-019-0635-8 on 22 June 2019. Downloaded from http://jitc.bmj.com/ on February 27, 2021 by guest. Protected by copyright.
tissues (Fig. 1A). The tumor tissue is a mixture of tumor development. WT and IFNAR1-KO mice were injected
cells and immune cells, we then compared IFNAR1 pro- with MCA and monitored for tumor development. About
tein level on CD8 + T cells from healthy donors and colon 40% of WT mice developed tumor 14 weeks after MCA in-
cancer patients. The IFNAR1 protein level is significantly jection. In contrast, all IFNAR1-KO mice developed tu-
lower on CD8+ T cells from human colon cancer patients mors (Fig. 2A). Furthermore, the IFNAR1-KO tumor grew
as compared to that from healthy donors (Fig. 1B&1C). significantly faster than the WT tumor from 12 weeks to
These findings indicate that CTLs in human colon cancer 14 weeks (Fig. 2A). To determine IFN-I function in the im-
patients are deficient in IFN-I signaling. mune component of the tumor microenvironment, The
IFNAR1 sufficient MC38 tumor cells were then trans-
IFN-Ι suppresses tumor development through a T cell- planted to WT and IFNAR1-KO mice. In this model, only
dependent mechanism host immune cells are deficient in IFNAR1. As in the WT
Because IFNAR1 mediates all isoforms of IFN-I signal- and IFNAR1-KO tumor-bearing mice, the MC38 tumor
ing, our above findings suggest that human colon carcin- grew significantly faster in the IFNAR1-KO mice than in
oma might use down-regulating IFNAR1 to impair IFN- the WT mice from 10 days to 18 days after tumor injection
I signaling in CTLs to evade immune surveillance. To (Fig. 2B). These findings indicate that IFN-I suppresses
determine IFN-I function in CTLs in anti-tumor immune tumor development at least in part through an immune
response, we sought to determine IFN-I function in tumor cell-dependent mechanism.
A WT Tumor volume (mm3)
15000 WT
120 IFNAR1-KO **
Tumor incidence (%)
12000 IFNAR1-KO
100
WT 9000
80 **
6000
60 *
40 3000
IFNAR1-KO 20 0
10 11 12 13 14
0 Weeks after MCA treatment
B 3500 WT
Tumor volume (mm3)
**
3000 IFNAR1-KO
WT 2500 **
2000
1500 **
1000 **
IFNAR1-KO 500 **
0
10 12 14 16 18
Days after tumor cell injection
C 6000 WT *
WT
Tumor volume (mm3)
120 IFNAR1-TKO IFNAR1-TKO
4500
WT
90
Tumor (%)
3000 *
60
1500 *
IFNAR1-TKO 30 0
14 16 18 20 22 24
0 Days after tumor cell injection
Fig. 2 IFN-I suppresses tumor growth via an immune cell-dependent mechanism. a. WT (n = 10) and IFNAR1-KO mice (n = 5) were injected with
MCA at the right flank (100 mg/mouse in peanut oil). Tumor growth was monitored over time starting at week 10. Two IFNAR1-KO mice
developed tumor at 56 days after MCA injection and were sacrificed on day 86 due to tumor size limitation of the animal use protocol before the
end of the experiment. Only 4 of the 10 WT mice developed tumor. Three of the WT and three of the IFNAR1-KO mice developed tumor around
10 weeks after MCA injection. One WT mouse developed tumor 90 days after MCA injection. Shown are tumor images from the three pairs of WT
and IFNAR1-KO mice that developed tumor at about the same time (left panel). Tumor incidence is presented at the middle panel. Tumor
growth kinetics in the three pairs of WT and IFNAR1-KO mice as shown in the right panel. * p < 0.05. ** p < 0.01. b. Murine colon carcinoma MC38
cells were injected to WT (n = 5) and IFNAR1-KO (n = 5) mice. Mice were monitored for tumor size starting at day 10 and sacrificed 18 days after
tumor cell injection. Shown are tumor images (left panel) and tumor growth kinetics (right panel). ** p < 0.01. c. MC38 cells were injected s.c. to
WT mice (n = 10) and mice with IFNAR1 deficiency only in T cells (IFNAR1-TKO, n = 5). Tumor formed in 3 of the 10 WT and 5 of the 5 IFNAR1-
TKO mice. Shown are tumor image (left panel) and tumor growth incidence (middle panel). Tumor growth kinetics of the tumors as shown in
the right panel. * p < 0.05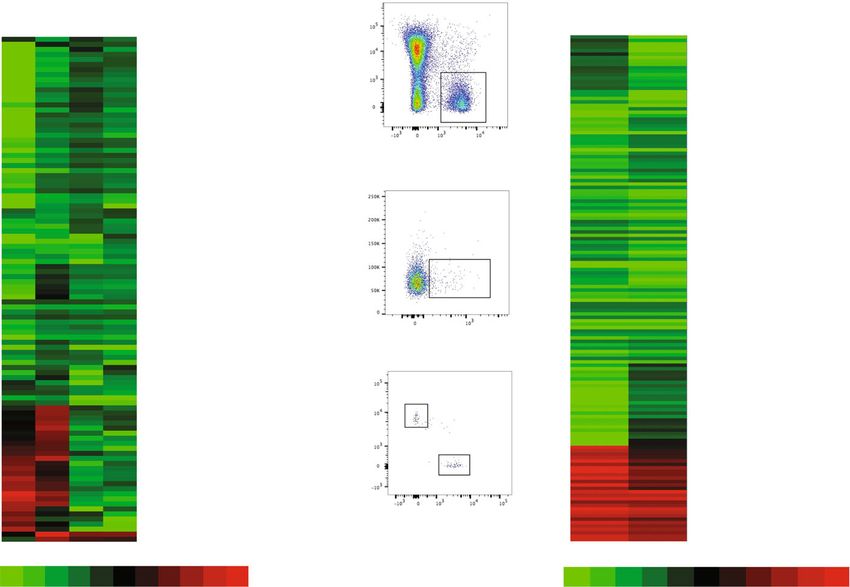
Lu et al. Journal for ImmunoTherapy of Cancer (2019) 7:157 Page 5 of 11
J Immunother Cancer: first published as 10.1186/s40425-019-0635-8 on 22 June 2019. Downloaded from http://jitc.bmj.com/ on February 27, 2021 by guest. Protected by copyright.
To determine whether IFN-I acts in T cells to suppress spleen CD8+ T cells between tumor-free WT and
tumor development, we next created mice with IFNAR1 IFNAR1-KO mice. No significant difference in lymph
deletion only in T cells (IFNAR1-TKO). IFNAR1-TKO node and spleen CD4+ and no significant difference in
mice showed no differences in T cell profiles as compared lymph node CD8+ T cell levels between the tumor-free
to WT mice, and NK cell number is significantly higher in WT and IFNAR1-KO mice were observed (Fig. 3A).
IFNAR1-TKO mice as compared to WT mice, albeit at a There is also no significant difference in CD4+ and
small degree (Additional file 1 Figure S1). MC38 tumor CD8+ T cell levels in the spleens of tumor-bearing WT
cells were transplanted to WT and IFNAR1-TKO mice. and IFNAR1-KO mice (Fig. 3B). The tumor-
MC38 cells formed tumor in about 30% of the WT mice. infiltrating CD4+ T cell levels decreased significantly
In contrast, tumor formed in all IFNAR1-TKO mice (Fig. in the tumor-bearing IFNAR1-KO mice as compared
2C). Furthermore, the established tumor grew significantly to the WT tumor-bearing mice (Fig. 3C & D). How-
faster and bigger in IFNAR1-TKO mice as compared to the ever, there is no significant difference in tumor-
WT mice (Fig. 2C). These findings thereby indicate that infiltrating CD8+ T cell level between the WT and
IFN-I suppresses tumor growth at least in part through IFNAR1-KO mice (Fig. 3C & D). No significant differ-
regulating T cell function in the tumor microenvironment. ence was observed in tumor-infiltrating CD11b+Gr1+
MDSCs levels between WT and IFNAR1-KO mice
Immune cell profiles in the tumor-bearing mice (Fig. 3C & E). These observations indicate that IFN-I
We next analyzed T cells in the MC38 colon tumor play no essential role in CTL tumor infiltration and
model as shown in Fig. 2B. There is small difference in differentiation.
A WT IFNAR1-KO WT
C
SSC-W
FSC-W
IFNAR1-KO
SSC-A
SSC-A
%CD8+ or CD4+
30 P=0.772
25
20 P=0.032
15
10 FSC-A FSC-A SSC-A Zombie Violet
5
Spleen CD8 CD4
D
CD4
WT IFNAR1 KO WT
WT IFNAR1-KO
P=0.163
%CD8+ or CD4+
IFNAR1-KO 2.5
%CD8+ cells
50
P=0.483 2.0
SSC-A
40 1.5
P=0.600
30 1.0
20 0.5
0
LN 10 CD8
CD8 CD8 CD4
WT IFNAR1 KO WT
IFNAR1-KO
B 3.0 P=0.006
%CD4+ cells
SSC-W
FSC-W
2.5
SSC-A
SSC-A
SSC-A
2.0
1.5
1.0
0.5
0
FSC-A FSC-A SSC-A Zombie Violet CD4
WT IFNAR1-KO WT WT
IFNAR1-KO E WT IFNAR1 KO IFNAR1-KO
% CD11b+Gr1+
P=0.161 P=0.112
%CD4+ cells
30 P=0.906
%CD8+ cells
12 2.0
CD4
25
Gr1
9 1.5
cells
6 20
1.0
3 15
CD8 CD8 0 10 0.5
CD11b CD11b 0
Fig. 3 Type I interferon and immune cell profiles in the tumor microenvironment. a. Spleen cells from tumor-free mice were stained with CD4- and
CD8-specific mAbs and analyzed by flow cytometry. Shown are representative flow cytometry plots. The % CD4+ and CD8+ T cells were quantified and
presented at the right panel. b. Cells were prepared from spleens of the MC38 tumor-bearing WT (n = 5) and IFNAR1-KO (n = 5) mice as shown in Fig.
2B. Top panel shows gating strategy for spleen cells. Single cells were gated out for live and dead cells. The live cells were gated for CD4+ and CD8+ T
cells as in A. c. Gating strategy for tumor-infiltrating immune cells. Tumor were excised from the MC38 tumor-bearing WT (n = 5) and IFNAR1-KO (n =
5) mice, digested with collagenase to make single cells. The digested tumor cell mixtures were stained with Zombie violet and CD4-, CD8-, CD11b-,
and Gr1-specific mAbs. The digested cells were gated for single cells, followed by gating for live and dead cells. d & e. The live cells as shown in C
were analyzed for T cells (d) and CD11b+Gr1+ cells (e) by flow cytometry. Shown at the left panels are representative plots of one pair of mice. The %
tumor-infiltrating CD4+ CD8+ T cells (d) and CD11b+Gr1+ cells (e) were quantified and presented at the right panel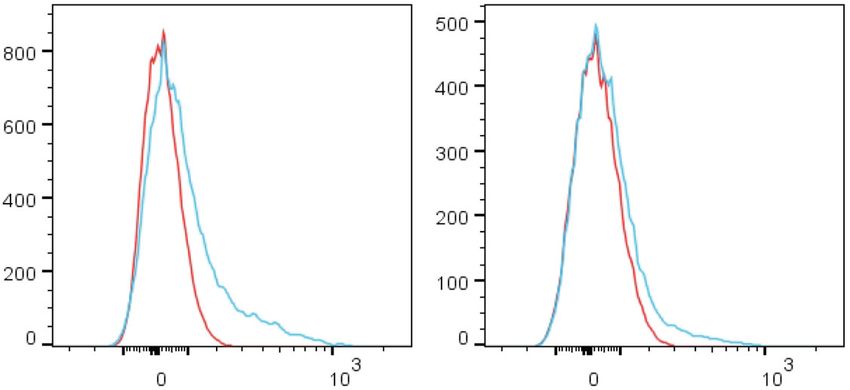
Lu et al. Journal for ImmunoTherapy of Cancer                      (2019) 7:157                                                                           Page 6 of 11

                                                                                                                                                                         J Immunother Cancer: first published as 10.1186/s40425-019-0635-8 on 22 June 2019. Downloaded from http://jitc.bmj.com/ on February 27, 2021 by guest. Protected by copyright.
IFN-I and antigen-specific T cell activation and                                     cells as efficiently as WT CD4+ T cells in the mixed
differentiation                                                                      chimera mice (Fig. 4B). We therefore conclude that IFN-I
The IFNAR1-TKO mice showed significant deficiency in                                 is not essential for antigen-specific T cell activation and
tumor growth control as compared to WT mice (Fig. 2C).                               differentiation in vivo.
It is therefore unexpected that deficiency in IFNAR1 does
not lead to altered CTL tumor infiltration and differenti-                           IFN-I regulation of granzyme B expression in CTLs
ation (Fig. 3C & D). To further determine IFN-I function                             The above findings strongly suggest that IFN-I regulates
in T cells and to unmask the effects of IFN-I on T cells                             CTL effector function rather than regulating T cell acti-
from IFN-I-deficiency-related DC deficiency [25], we                                 vation to execute its anti-tumor activity. To test this hy-
created mixed bone marrow chimera mice with WT and                                   pothesis, we isolated tumor-infiltrating CD8+ CTLs from
IFNAR1-KO mice. The mixed chimera mice have WT                                       the total tumor tissues of the WT and IFNAR1-KO MCA
DCs from WT BM and thus have functional DC to let us                                 (Fig. 2A) and MC38 (Fig. 2B) tumor-bearing mice and an-
determine the direct function of IFN-I in WT and                                     alyzed expression profiles of immune genes (Fig. 5A).
IFNAR1-KO CD4+ and CD8+ T cells within the same cel-                                 Interestingly, the expression levels of five key CTL effector
lular microenvironment. We used two vaccination models                               genes, Fasl, prf1, Gzma, Gzmb and Ifng, and the immune
[27, 28] to stimulate antigen-specific CD4+ and CD8+ T                               suppressive gene Il10, were significantly down-regulated
cell responses in the mixed chimera mice in vivo. The WT                             in the IFNAR1-KO tumor-infiltrating CTLs from both
(CD45.1+) and IFNAR1-KO (CD45.2+) CD4+ and CD8+ T                                    MCA and MC38 tumor, respectively, as compared to the
cells were then determined. Interestingly, both CD4+ and                             WT tumor-infiltrating CTLs (Fig. 5A). The list of all dif-
CD8+ IFNAR1-KO T cells were as responsive to antigen                                 ferentially expressed genes is presented in Additional file 1
stimulation as WT T cells in the mixed chimera mice. As                              Table S2. The Fas-FasL pathway and the perforin-
observed in the tumor-bearing mice, there are no signifi-                            granzyme B pathway are the two primary effector mecha-
cant differences in the levels of antigen-specific CD8+ T                            nisms that CTLs use to kill target cells [35, 36]. To deter-
cells (Fig. 4A). Although CD4+ tumor-infiltrating T cells                            mine whether IFN-I regulation of FasL and perforin/
were significantly lower in IFNAR1-KO tumor-bearing                                  granzyme B expression is a general phenomenon in CTLs,
mice as compared to WT tumor-bearing mice (Fig. 3C &                                 a complimentary approach was then used to validate this
D), IFNAR1-deficient CD4+ naïve T cells responded to                                 finding, we sorted antigen-specific WT and IFNAR1-KO
antigen stimulation to generate antigen-specific CD4+ T                              CD8+ CTLs from spleens of the OVA vaccinated mixed

  A            CD8+ T cells                                        IFNAR1 KO         B          CD4+ T cells                                     IFNAR1 KO
                                                                                     CD45.1
   CD45.1

                                                                                                                   CD4
                                      CD8

                 CD45.2                                           OVA-Tetramer                   CD45.2                                          2WIS Tetramer

                    WT                                                                              WT
                                                                                                                                                     p=0.831
                                                                                                                    %2W1S+ of CD4+ cells

                                                                    p=0.928                                                                30
                                       %OVA+ of CD8+ cells

                                                             30
                                                             25                                                                            25
   CD8

                                                                                     CD4

                                                             20                                                                            20
                                                             15                                                                            15
                                                             10                                                                            10
                                                              5                                                                             5
                                                              0                                                                             0
               OVA-Tetramer                                       WT     IFNAR1 KO             2WIS Tetramer                                    WT      IFNAR1 KO
 Fig. 4 IFN-I regulation of T cell activation in vivo. a. Mixed WT and IFNAR1 chimera mice were vaccinated sixty nine days after BM adoptive
 transfer to induce OVA-specific CD8+ T cells. The mice received a prime followed by a boost 14 days later. Blood samples were collected and
 analyzed seven days following the boost. Shown is the analysis gating strategy of white blood cells. The levels of OVA-specific WT and IFNAR1-KO
 CD8+ T cells were quantified and presented at the bottom right panel. Each dot represents data from one mouse. b. The mixed chimera mice
 were vaccinated sixty nine days after BM adoptive transfer with 2W1S peptide to induce CD4-specific activation. 2W1S-specific WT and IFNAR1-KO
 CD4+ T cells were analyzed and quantified as in A
Lu et al. Journal for ImmunoTherapy of Cancer (2019) 7:157 Page 7 of 11
J Immunother Cancer: first published as 10.1186/s40425-019-0635-8 on 22 June 2019. Downloaded from http://jitc.bmj.com/ on February 27, 2021 by guest. Protected by copyright.
A MCA MC38
B C CD8
1 2 1 2 1 2
MHCII
Fasl (10.4, 2.7) Il10 (1.6)
Gzmb (11.6, 2.2)
Gzmb (1.6)
Ifng (9.0, 2.7)
Prf1 (5.4, 3.4)
CD8
SSC-A
Gzma (7.3, 2.8)
OVA tetramer
Il10 (4.8, 14.9)
CD45.2
CD45.1
-3.8 -3.0 -2.3 -1.5 -0.8 0 0.8 1.5 2.3 3.0 3.8 -1.5 -1.2 -0.9 -0.6 -0.3 0 0.3 0.6 0.9 1.2 1.5
Log 2 ratio Log 2 ratio
Fig. 5 IFN-I regulates expression of granzyme B in tumor-infiltrating and antigen-specific CTLs. a. RNA was isolated from tumor-infiltrating CTLs
from MC38 (18 days after tumor injection) and MCA (96 days after MCA injection) tumor models as outlined in Fig. 2A and B and analyzed for
gene expression using the Nanostring immunology gene panel. Genes whose expression levels are 2 or more folds different in tumor-infiltrating
CTLs between WT and IFNAR1-KO mice were clustered and presented. Green color indicates higher in WT and red color indicates lower in WT
mice. The numbers in the parentheses represent fold decrease in IFNAR-KO mice as compared to WT mice. b. Spleen cells from the WT and
IFNAR1-KO mixed BM chimera mice were collected 14 days after boost and stained with MHCII-, CD8-, CD45.1-, CD45.2-specific mAbs and OVA
tetramer. The activated (OVA tetramer-positive) WT (CD45.1+) and IFNAR1-KO (CD45.2+) CD8+ cells were gated as indicated and sorted for mRNA
purification. c. RNAs were prepared from sorted cells as shown in B. Fifty ng RNA were analyzed for gene expression using the Nanostring
immunology gene panel. Genes whose expression levels are 1.5 or more folds different between activated WT and IFNAR1-KO CD8+ T cells from
the mixed chimera mice as shown in B were clustered and presented
chimera mice (Fig. 5B). The cells were then analyzed for respectively, after treatment (Fig. 6A & B). CTLs were
the expression of immune genes. Gzmb and Il10 expres- then treated with IFNα and IFNβ in the presence of
sion levels decreased 1.6 folds in the IFNAR1-KO OVA- pSTAT1-specific [30] and pSTAT3-specific [31] inhibi-
specific CTLs as compared to the WT OVA-specific CTLs tor, respectively. Analysis of granzyme B expression re-
(Fig. 5C). The list of all differentially expressed genes is vealed that inhibition of pSTAT1 does not cause
presented in Additional file 1 Table S3. These observations significant change in granzyme B expression, but inhib-
indicate that IFN-I is a general regulator of CTL effector ition of STAT3 activation diminished granzyme B ex-
granzyme B expression. pression up-regulation induced by IFNα and IFNβ (Fig.
6C). We therefore conclude that IFN-I induces STAT3
IFN-I induces STAT3 activation to activate Gzmb to activate Gzmb expression in CTLs.
transcription STAT3 is a transcription factor. To determine whether
We next used a defined CTL system to determine the STAT3 directly regulates Gzmb transcription, we then
function of IFN-I in regulation of granzyme B expression. examined the Gzmb promoter and identified six putative
2/20 CTLs is an H-2Ld-restricted tumor cell-reactive CTL STAT consensus sequence elements (Fig. 7A). Because
line that recognizes the AH1 peptide of the gp70 viral STAT3 activation peaked at 1 h after IFNα and IFNβ
protein [37]. We first treated 2/20 CTLs with IFNα and stimulation (Fig. 6A), we treated the 2/20 CTLs with
IFNβ and analyzed STAT activation. STAT1, STAT3, IFNα and IFNβ, respectively, for 1 h and analyzed
STAT4, STAT5 and STAT6 were detectable in the rest- protein-DNA interactions by EMSA. We firstly used the
ing CTLs and only total STAT4 protein level was pSTAT3 consensus sequence probe as a positive control
increased by IFNα and IFNβ treatment. Treatment of and the paired mutant probe as a negative control and
resting 2/20 CTLs with IFNα and IFNβ induced STAT3 observed that the activated STAT3 binds to the WT
activation at 1 h and STAT1 activation at 24 h, probe but not binding to the mutant probe (Fig. 7B). WeLu et al. Journal for ImmunoTherapy of Cancer (2019) 7:157 Page 8 of 11
J Immunother Cancer: first published as 10.1186/s40425-019-0635-8 on 22 June 2019. Downloaded from http://jitc.bmj.com/ on February 27, 2021 by guest. Protected by copyright.
A B C ns
1h 4h 24h 3.0
Control
Resting
Control
Ratio of pSTAT1/STAT1
IFNα
IFNα
IFNα
IFNβ
IFNβ
IFNβ
0.8 1h +Fludarabine
Gzmb mRNA level
4h 2.4
-pSTAT1 0.6 24h ns
1.8
-STAT1 0.4
1.2
-pSTAT2 0.2
0.6
-STAT2
0
Control IFNα IFNβ
-pSTAT3 0
+IFNα +IFNβ
Ratio of pSTAT3/STAT3
-STAT3 1.2 1h
4h
0.9 24h Resting
-pSTAT4 Control
1.8 +STATTIC
-STAT4 0.6 p=0.051
pLu et al. Journal for ImmunoTherapy of Cancer (2019) 7:157 Page 9 of 11
J Immunother Cancer: first published as 10.1186/s40425-019-0635-8 on 22 June 2019. Downloaded from http://jitc.bmj.com/ on February 27, 2021 by guest. Protected by copyright.
A GP5
GP1 +1 GP3 +303 +311 GP6 GP1: GGCTTTTCATAAGAATGGGTT
GZMB -476 -467 +101 +110 +600 +607 GP2: AGGAGTTTTCATAGAAAGCATG
-36 -28 +235 +244 GP3: GCGGCCTTCCGGGGAAGATGAAG
-1000 +1000
GP2 GP4 GP4: AGAGGTCTTTCTCAGGAAGGGCCA
GP5: TGGATCTTCCTAGAAGTACATG
GP6: CTCTGCTTTCTGGAAGGCCAGC
B C
WT pSTAT3 probe Mutant pSTAT3 probe pSTAT3
0 0 0 1 10 50 0 1 10 50 + cold probe
+ + + + + + +NE + + + + +IFNβ
+
+ + +IFNα + ++ + + +IFNα
+ + +IFNβ + Resting
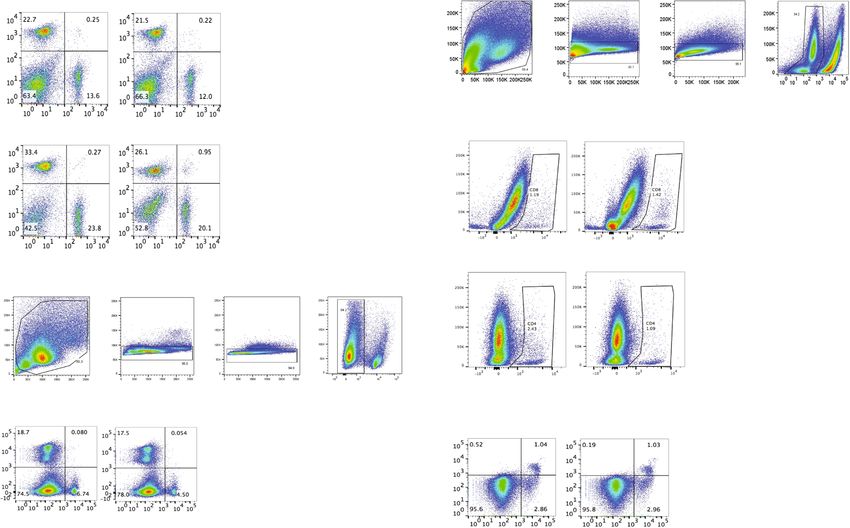
Fig. 7 IFNα and IFNβ-activated STAT3 binds to the Gzmb promoter in CTLs. a. Structures of the Gzmb promoter. The six putative ISRE sequences
(right panel) and locations (left panel) are shown. b. Resting 2/20 CTLs were treated with recombinant IFNα and IFNβ protein, respectively, for 1 h.
Nuclear extracts were prepared from these cells and analyzed for STAT3 activation using EMSA with the WT pSTAT3 consensus probe (Santa Cruz
Cat# sc-2571) and mutant probe (Santa Cruz Cat# sc-2572). Black arrow points to the DNA-pSTAT3 complex. c. Nuclear extracts were prepared as
in B and analyzed for STAT3 activation using EMSA with the Gzmb promoter DNA probe GP4 as indicated in A. To determine pSTAT3-DNA
binding specificity, the WT pSTAT3 consensus probe as shown in B was used for cold probe competition at the indicated ratios relative to the
GP4 probe as a specificity control. Black arrow points to the DNA-pSTA T3 complex
STAT4 [47, 48]. However, STAT1 represses whereas both the colon carcinoma tissues and CTLs of colon
STAT4 activates IFNγ expression in T cells during a viral cancer patients as compared to the normal colon tissues
infection [47, 48]. In this study, we determined that and CTLs of healthy donors, respectively. Therefore, hu-
IFNα and IFNβ selectively induce activation of STAT1 man colon carcinoma may use down-regulating IFNAR1
and STAT3 in CTLs in vitro. We further determined in CTLs as a mechanism to impair CTL effector func-
that IFN-I activated STAT3 directly bound to the Gzmb tion to evade host cancer immunosurveillance. Our find-
promoter and inhibiting pSTAT3 decreased IFN-I- ings indicate that IFNAR1 is potentially a therapeutic
induced Gzmb expression in T cells. Furthermore, target for boosting CTL effector function in human
IFNAR1-deficient tumor-infiltrating and antigen-specific colon cancer immunotherapy.
CTLs exhibited diminished Gzmb expression. Taken to-
gether, we have determined that IFN-I regulates CTL ef- Conclusion
fector function through activating the STAT3-granzyme Our studies aimed at determining the role of IFN-I in
B axis in anti-tumor immune response. CTL-mediated tumor suppression in the tumor micro-
In human breast cancer patients, the autologous IFN-I environment. Previous studies have established an essen-
signaling in tumor cells controls tumor cell response to tial role of autologous IFN-I signaling in tumor cell
chemotherapy [1]. In human melanoma patients, the in- response to chemotherapy and immunotherapy. It be-
trinsic IFN-I signaling pathway is essential for tumor re- comes critically important to determine whether IFN-I
sponse to checkpoint inhibitor immunotherapy [19, 20]. plays a role in CTL function in the tumor suppression
Our findings indicate that IFN-I intrinsic signaling in T since the IFNAR1 is down-regulated on CTLs from hu-
cells is also essential for expression of granzyme B and T man colon cancer patients. It is clear that under the
cell function in colon carcinoma growth control in vivo. conditions used in our studies IFN-I intrinsic signaling
We have therefore extended IFN-I functions to T cell pathway plays a fundamental role in T cell-mediated
anti-tumor immune response. It is known that the im- tumor suppression in vivo. Reversal of immune suppres-
paired IFN signaling pathway in lymphocytes is a com- sion to activate CTLs is the principle action mechanism
mon immune defect in human cancer [49]. We observed of current checkpoint inhibitor immunotherapy. Our
here that the IFNAR1 is significantly down-regulated in data determined that IFN-I is not essential for CTLLu et al. Journal for ImmunoTherapy of Cancer (2019) 7:157 Page 10 of 11
J Immunother Cancer: first published as 10.1186/s40425-019-0635-8 on 22 June 2019. Downloaded from http://jitc.bmj.com/ on February 27, 2021 by guest. Protected by copyright.
activation but rather is critical in regulation of key CTL 2. Stone ML, Chiappinelli KB, Li H, Murphy LM, Travers ME, Topper MJ, et al.
effector granzyme B expression and tumor growth con- Epigenetic therapy activates type I interferon signaling in murine ovarian
cancer to reduce immunosuppression and tumor burden. Proc Natl Acad
trol in vivo. We provide evidence that human colon car- Sci U S A. 2017;114(51):E10981–E90.
cinoma cells may use down-regulation of IFNAR1 to 3. Cauwels A, Van Lint S, Garcin G, Bultinck J, Paul F, Gerlo S, et al. A safe and
impair CTL effector function to evade host cancer highly efficient tumor-targeted type I interferon immunotherapy depends
on the tumor microenvironment. Oncoimmunology. 2018;7(3):e1398876.
immunosurveillance. Therefore, targeting IFNAR1 4. Cauwels A, Van Lint S, Paul F, Garcin G, De Koker S, Van Parys A, et al.
down-regulation is potentially an effective approach to Delivering type I interferon to dendritic cells empowers tumor eradication
bypass both PD-L1-depedent and PD-L1-independent and immune combination treatments. Cancer Res. 2018;78(2):463–74.
5. Brown MC, Holl EK, Boczkowski D, Dobrikova E, Mosaheb M, Chandramohan
immune suppressions to directly activate CTL effector V, et al. Cancer immunotherapy with recombinant poliovirus induces IFN-
function to suppress colon carcinoma growth. dominant activation of dendritic cells and tumor antigen-specific CTLs. Sci
Transl Med. 2017;9(408).
6. Kirkwood J. Cancer immunotherapy: the interferon-alpha experience. Semin
Additional files Oncol. 2002;29(3 Suppl 7):18–26.
7. Garbe C, Eigentler TK. Diagnosis and treatment of cutaneous melanoma:
Additional file 1: Figure S1. Immune cell profiles in WT and IFNAR1- state of the art 2006. Melanoma Res. 2007;17(2):117–27.
TKO mice. Figure S2. Scheme of creation of WT and IFNAR1-KO mixed 8. Hervas-Stubbs S, Perez-Gracia JL, Rouzaut A, Sanmamed MF, Le Bon A,
BM chimera mice. Figure S3. IL6 activates pSTAT3 in colon carcinoma Melero I. Direct effects of type I interferons on cells of the immune system.
cells.Table S1. Antibodies. Table S2. Differentially expressed immune Clin Cancer Res. 2011;17(9):2619–27.
genes between WT and IFNAR1 KO tumor-infiltrating CD8+ T cells from 9. Ayers M, Lunceford J, Nebozhyn M, Murphy E, Loboda A, Kaufman DR, et al.
MCA and MC38 tumor-bearing mice. Table S3. Differentially expressed IFN-gamma-related mRNA profile predicts clinical response to PD-1
immune genes between activated WT and IFNAR1 KO CD8+ T cells from blockade. J Clin Invest. 2017;127(8):2930–40.
mixed chimera mice. (PDF 506 kb) 10. van Pesch V, Lanaya H, Renauld JC, Michiels T. Characterization of the murine
alpha interferon gene family. J Virol. 2004;78(15):8219–28.
11. Ivashkiv LB, Donlin LT. Regulation of type I interferon responses. Nat Rev
Abbreviations Immunol. 2014;14(1):36–49.
CTLs: Cytotoxic T lymphocytes; IFNAR1: Interferon (alpha and beta) receptor 12. Balkwill F, Watling D, Taylor-Papadimitriou J. Inhibition by lymphoblastoid
1; IFN-I: Type I interferons; MCA: Methylcholanthrene interferon of growth of cells derived from the human breast. Int J Cancer.
1978;22(3):258–65.
Acknowledgements 13. Hobeika AC, Subramaniam PS, Johnson HM. IFNalpha induces the
We thank the NIH tetramer core facility at Emory University for providing the expression of the cyclin-dependent kinase inhibitor p21 in human prostate
OVA and 2W1S tetramers. cancer cells. Oncogene. 1997;14(10):1165–70.
14. Greiner JW, Hand PH, Noguchi P, Fisher PB, Pestka S, Schlom J. Enhanced
Author contributions expression of surface tumor-associated antigens on human breast and
C.L., J.D.K., M. L. I., W.X., P.S.R.: performed experiments and developed colon tumor cells after recombinant human leukocyte alpha-interferon
methods; C.L., G.Z., K.L.: concept development and overall study designs; C.L., treatment. Cancer Res. 1984;44(8):3208–14.
K.L., wrote the manuscript. All authors read and approved the final version of 15. Lu M, Zhang W, Li Y, Berenzon D, Wang X, Wang J, et al. Interferon-alpha
the manuscript. targets JAK2V617F-positive hematopoietic progenitor cells and acts through
the p38 MAPK pathway. Exp Hematol. 2010;38(6):472–80.
Funding 16. Xiao W, Klement JD, Lu C, Ibrahim ML, Liu K. IFNAR1 controls autocrine type
Grant support from National Cancer Institute (CA133085 to K.L) and VA Merit I IFN regulation of PD-L1 expression in myeloid-derived suppressor cells. J
Review Award (CX001364, to K.L). Immunol. 2018;201(1):264–77.
17. Chawla-Sarkar M, Lindner DJ, Liu YF, Williams BR, Sen GC, Silverman RH, et
al. Apoptosis and interferons: role of interferon-stimulated genes as
Availability of data and materials
mediators of apoptosis. Apoptosis. 2003;8(3):237–49.
Data and material presented in this study are available upon request.
18. Castiello L, Sestili P, Schiavoni G, Dattilo R, Monque DM, Ciaffoni F,
et al. Disruption of IFN-I signaling promotes HER2/Neu tumor
Ethics approval and consent to participate progression and breast Cancer stem cells. Cancer Immunol Res. 2018;
No applicable. 6(6):658–70.
19. Zaretsky JM, Garcia-Diaz A, Shin DS, Escuin-Ordinas H, Hugo W, Hu-
Consent for publication Lieskovan S, et al. Mutations associated with acquired resistance to PD-1
Not Applicable. blockade in melanoma. N Engl J Med. 2016;375(9):819–29.
20. Shin DS, Zaretsky JM, Escuin-Ordinas H, Garcia-Diaz A, Hu-Lieskovan S,
Competing interests Kalbasi A, et al. Primary resistance to PD-1 blockade mediated by JAK1/2
The authors declare that they have no competing interests. mutations. Cancer Discov. 2017;7(2):188–201.
21. Shankaran V, Ikeda H, Bruce AT, White JM, Swanson PE, Old LJ, et al.
Author details IFNgamma and lymphocytes prevent primary tumour development
1
Department of Biochemistry and Molecular Biology, Medical College of and shape tumour immunogenicity. Nature. 2001;410(6832):1107–11.
Georgia, Augusta, GA 30912, USA. 2Georgia Cancer Center, Medical College 22. Hanson HL, Donermeyer DL, Ikeda H, White JM, Shankaran V, Old LJ, et al.
of Georgia, Augusta, GA 30912, USA. 3Charlie Norwood VA Medical Center, Eradication of established tumors by CD8+ T cell adoptive immunotherapy.
Augusta, GA 30904, USA. Immunity. 2000;13(2):265–76.
23. Leone RD, Sun IM, Oh MH, Sun IH, Wen J, Englert J, et al. Inhibition of
Received: 28 November 2018 Accepted: 11 June 2019 the adenosine A2a receptor modulates expression of T cell coinhibitory
receptors and improves effector function for enhanced checkpoint
blockade and ACT in murine cancer models. Cancer Immunol
References Immunother. 2018.
1. Sistigu A, Yamazaki T, Vacchelli E, Chaba K, Enot DP, Adam J, et al. Cancer 24. Dunn GP, Bruce AT, Sheehan KC, Shankaran V, Uppaluri R, Bui JD, et al. A
cell-autonomous contribution of type I interferon signaling to the efficacy critical function for type I interferons in cancer immunoediting. Nat
of chemotherapy. Nat Med. 2014;20(11):1301–9. Immunol. 2005;6(7):722–9.Lu et al. Journal for ImmunoTherapy of Cancer (2019) 7:157 Page 11 of 11
J Immunother Cancer: first published as 10.1186/s40425-019-0635-8 on 22 June 2019. Downloaded from http://jitc.bmj.com/ on February 27, 2021 by guest. Protected by copyright.
25. Fuertes MB, Kacha AK, Kline J, Woo SR, Kranz DM, Murphy KM, et al. 47. Nguyen KB, Cousens LP, Doughty LA, Pien GC, Durbin JE, Biron CA.
Host type I IFN signals are required for antitumor CD8+ T cell Interferon alpha/beta-mediated inhibition and promotion of interferon
responses through CD8{alpha}+ dendritic cells. J Exp Med. 2011;208(10): gamma: STAT1 resolves a paradox. Nat Immunol. 2000;1(1):70–6.
2005–16. 48. Nguyen KB, Watford WT, Salomon R, Hofmann SR, Pien GC, Morinobu A, et
26. Redd PS, Lu C, Klement JD, Ibrahim ML, Zhou G, Kumai T, et al. H3K4me3 al. Critical role for STAT4 activation by type 1 interferons in the interferon-
mediates the NF-kappaB p50 homodimer binding to the pdcd1 promoter gamma response to viral infection. Science. 2002;297(5589):2063–6.
to activate PD-1 transcription in T cells. Oncoimmunology. 2018;7(9): 49. Critchley-Thorne RJ, Simons DL, Yan N, Miyahira AK, Dirbas FM, Johnson DL,
e1483302. et al. Impaired interferon signaling is a common immune defect in human
27. Kumai T, Lee S, Cho HI, Sultan H, Kobayashi H, Harabuchi Y, et al. cancer. Proc Natl Acad Sci U S A. 2009;106(22):9010–5.
Optimization of peptide vaccines to induce robust antitumor CD4 T-cell
responses. Cancer Immunol Res. 2017;5(1):72–83.
28. Nagato T, Lee YR, Harabuchi Y, Celis E. Combinatorial immunotherapy of
Publisher’s Note
Springer Nature remains neutral with regard to jurisdictional claims in
polyinosinic-polycytidylic acid and blockade of programmed death-ligand 1
published maps and institutional affiliations.
induce effective CD8 T-cell responses against established tumors. Clin
Cancer Res. 2014;20(5):1223–34.
29. Hodge JW, Schlom J. Comparative studies of a retrovirus versus a poxvirus
vector in whole tumor-cell vaccines. Cancer Res. 1999;59(20):5106–11.
30. Frank DA, Mahajan S, Ritz J. Fludarabine-induced immunosuppression is
associated with inhibition of STAT1 signaling. Nat Med. 1999;5(4):444–7.
31. Schust J, Sperl B, Hollis A, Mayer TU, Berg T. Stattic: a small-molecule
inhibitor of STAT3 activation and dimerization. Chem Biol. 2006;13(11):
1235–42.
32. Yang D, Stewart TJ, Smith KK, Georgi D, Abrams SI, Liu K. Downregulation of
IFN-gammaR in association with loss of Fas function is linked to tumor
progression. Int J Cancer. 2008;122(2):350–62.
33. Lu C, Redd PS, Lee JR, Savage N, Liu K. The expression profiles and
regulation of PD-L1 in tumor-induced myeloid-derived suppressor cells.
Oncoimmunology. 2016;5(12):e1247135.
34. Lu C, Yang D, Sabbatini ME, Colby AH, Grinstaff MW, Oberlies NH, et al.
Contrasting roles of H3K4me3 and H3K9me3 in regulation of apoptosis and
gemcitabine resistance in human pancreatic cancer cells. BMC Cancer. 2018;
18(1):149.
35. Golstein P, Griffiths GM. An early history of T cell-mediated cytotoxicity. Nat
Rev Immunol. 2018.
36. Gawden-Bone CM, Frazer GL, Richard AC, Ma CY, Strege K, Griffiths GM. PIP5
kinases regulate membrane phosphoinositide and actin composition for
targeted granule secretion by cytotoxic lymphocytes. Immunity. 2018;49(3):
427–37 e4.
37. Ryan MH, Bristol JA, McDuffie E, Abrams SI. Regression of extensive
pulmonary metastases in mice by adoptive transfer of antigen-specific
CD8(+) CTL reactive against tumor cells expressing a naturally occurring
rejection epitope. J Immunol. 2001;167(8):4286–92.
38. Kolumam GA, Thomas S, Thompson LJ, Sprent J, Murali-Krishna K. Type I
interferons act directly on CD8 T cells to allow clonal expansion and
memory formation in response to viral infection. J Exp Med. 2005;202(5):
637–50.
39. Marrack P, Kappler J, Mitchell T. Type I interferons keep activated T cells
alive. J Exp Med. 1999;189(3):521–30.
40. Curtsinger JM, Valenzuela JO, Agarwal P, Lins D, Mescher MF. Type I IFNs
provide a third signal to CD8 T cells to stimulate clonal expansion and
differentiation. J Immunol. 2005;174(8):4465–9.
41. Le Bon A, Durand V, Kamphuis E, Thompson C, Bulfone-Paus S,
Rossmann C, et al. Direct stimulation of T cells by type I IFN enhances
the CD8+ T cell response during cross-priming. J Immunol. 2006;176(8):
4682–9.
42. Aichele P, Unsoeld H, Koschella M, Schweier O, Kalinke U, Vucikuja S. CD8 T
cells specific for lymphocytic choriomeningitis virus require type I IFN
receptor for clonal expansion. J Immunol. 2006;176(8):4525–9.
43. Schiavoni G, Mattei F, Gabriele L. Type I interferons as stimulators of DC-
mediated cross-priming: impact on anti-tumor response. Front Immunol.
2013;4:483.
44. Tzeng A, Kauke MJ, Zhu EF, Moynihan KD, Opel CF, Yang NJ, et al.
Temporally programmed CD8alpha(+) DC activation enhances
combination Cancer immunotherapy. Cell Rep. 2016;17(10):2503–11.
45. Zitvogel L, Galluzzi L, Kepp O, Smyth MJ, Kroemer G. Type I interferons in
anticancer immunity. Nat Rev Immunol. 2015;15(7):405–14.
46. Catalfamo M, Wilhelm C, Tcheung L, Proschan M, Friesen T, Park JH,
et al. CD4 and CD8 T cell immune activation during chronic HIV
infection: roles of homeostasis, HIV, type I IFN, and IL-7. J Immunol.
2011;186(4):2106–16.You can also read