Synthetic mycobacterial diacyl trehaloses reveal differential recognition by human T cell receptors and the C type lectin Mincle - Nature
←
→
Page content transcription
If your browser does not render page correctly, please read the page content below
www.nature.com/scientificreports
OPEN Synthetic mycobacterial diacyl
trehaloses reveal differential
recognition by human T cell
receptors and the C‑type lectin
Mincle
Josephine F. Reijneveld1,2,3, Mira Holzheimer3, David C. Young1, Kattya Lopez1,4,
Sara Suliman1, Judith Jimenez4, Roger Calderon4, Leonid Lecca4, Megan B. Murray5,
Eri Ishikawa6,7, Sho Yamasaki6,7, Adriaan J. Minnaard3, D. Branch Moody1 &
Ildiko Van Rhijn1,2*
The cell wall of Mycobacterium tuberculosis is composed of diverse glycolipids which potentially
interact with the human immune system. To overcome difficulties in obtaining pure compounds from
bacterial extracts, we recently synthesized three forms of mycobacterial diacyltrehalose (DAT) that
differ in their fatty acid composition, DAT1, DAT2, and DAT3. To study the potential recognition of
DATs by human T cells, we treated the lipid-binding antigen presenting molecule CD1b with synthetic
DATs and looked for T cells that bound the complex. DAT1- and DAT2-treated CD1b tetramers were
recognized by T cells, but DAT3-treated CD1b tetramers were not. A T cell line derived using CD1b-
DAT2 tetramers showed that there is no cross-reactivity between DATs in an IFN-γ release assay,
suggesting that the chemical structure of the fatty acid at the 3-position determines recognition by
T cells. In contrast with the lack of recognition of DAT3 by human T cells, DAT3, but not DAT1 or DAT2,
activates Mincle. Thus, we show that the mycobacterial lipid DAT can be both an antigen for T cells and
an agonist for the innate Mincle receptor, and that small chemical differences determine recognition
by different parts of the immune system.
Infection with Mycobacterium tuberculosis (Mtb) in humans elicits a T cell response. Detection of T cell responses
to peptide antigens from Mtb, presented by major histocompatibility complex (MHC) proteins, forms the basis
tb1. In addition to peptide antigens, cell wall lipids of
of the most reliable diagnostic assay for infection with M
Mtb have been shown to be presented by MHC class I-like proteins CD1a, CD1b, CD1c, and CD1d to T c ells2–10.
The non-polymorphic nature of CD1 molecules makes lipids presented by CD1 proteins ideal targets for vaccine
approaches and diagnostic p urposes11.
Among the many cell wall lipids of Mtb, some are present in most actinomycetes, whereas others exist among
mycobacteria only, and some are strictly specific for the species Mtb. Mycobacterial lipids, such as mannosyl
phosphomycoketide2,4, phosphomycoketide6, glucose m onomycolate5, mycolic a cid8, glycerol m
onomycolate7,
diacyl sulfoglycolipid ( Ac2SGL)9, and dideoxymycobactin3 have been shown to induce T cell responses via pres-
entation by CD1 proteins. Contrary to the broad cross-reactivity against self and bacterial p hospholipids12,13,
individual mycobacterial lipid-specific T cell clones show high specificity for the hydrophilic headgroup of Mtb
1
Division of Rheumatology, Inflammation, and Immunity, Brigham and Women’s Hospital and Harvard Medical
School, Hale Building for Transformative Medicine, 60 Fenwood Road, Boston, MA 02115, USA. 2Department
of Infectious Diseases and Immunology, Faculty of Veterinary Medicine, Utrecht University, Utrecht, The
Netherlands. 3Stratingh Institute for Chemistry, University of Groningen, Groningen, The Netherlands. 4Socios En
Salud, Lima, Peru. 5Division of Global Health Equity, Department of Global Health and Social Medicine, Brigham
and Women’s Hospital and Harvard Medical School, Boston, MA, USA. 6Department of Molecular Immunology,
Research Institute for Microbial Diseases, Osaka University, Suita, Osaka, Japan. 7Laboratory of Molecular
Immunology, Immunology Frontier Research Center, Osaka University, Suita, Osaka, Japan. *email: i.vanrhijn@
uu.nl
Scientific Reports | (2021) 11:2010 | https://doi.org/10.1038/s41598-021-81474-3 1
Vol.:(0123456789)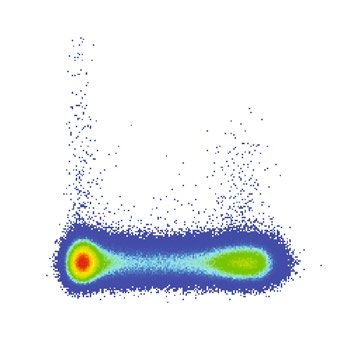
www.nature.com/scientificreports/
lipids, while the hydrophobic parts of the lipid that are buried deep in the CD1 cleft are not typically recognized
by the T cell receptor through direct contact14. Parts of the fatty acids that lie on the CD1 surface or sit near the
antigen exit portal, might contribute to T cell recognition and specificity, especially when they show distinguish-
ing features like double bonds, hydroxylations, and methylations.
Not all Mtb (glyco)lipids have been studied as T cell antigens. We propose that if a lipid binds sufficiently
to a CD1 molecule, and it has clear features that distinguish it from common self-lipids like phospholipids and
sphingolipids, it may be specifically recognized by T cells. Because CD1 interacts with lipid antigens via hydro-
phobic interactions, any glycolipid with one, two, or three hydrophobic tails and a suitable size might bind to
CD1. One of these candidate lipids is diacyl trehalose (DAT). DAT is suggested to be part of the external surface
of the mycobacterial cell wall15 and belongs to the family of trehalose-based glycolipids, which includes lipids
such as Ac2SGL. Although known as a biological substance for decades, DAT had not been chemically synthe-
sized until recently16.
Besides functioning as lipid antigens for T cells, some mycobacterial lipids induce an innate response through
pattern recognition receptors, such as the family of C-type lectin receptors (CLRs). The macrophage inducible
Ca2+-dependent lectin (Mincle) receptor is one of the human CLRs. Trehalose-6,6′-dimycolate, a highly abundant
glycolipid in the mycobacterial cell wall, was the first known Mtb lipid to activate the murine and human Mincle
receptor17. Since then several natural and synthetic mycobacterial lipids have been shown to act as agonists for
both the murine and human Mincle receptor, including DAT isolated from Mtb18. There has been growing inter-
est in using Mincle ligands as adjuvants to promote a Th1 and Th17 immune response to subunit v accines19,20.
Here, we took advantage of precisely defined synthetic forms of DAT to discover receptor mediated human
cellular responses. Three synthetic DATs were tested for their potential as Mincle and T cell receptor (TCR)
ligands. We developed CD1b tetramers loaded with synthetic DAT to study recognition of DAT by T cells ex vivo
in both healthy individuals and tuberculosis patients.
Results
Validation of synthetic diacyl trehalose. Natural DAT isolated from the cell wall of M. tuberculosis
(Mtb) is a mixture of compounds that has immunomodulatory p roperties21. We recently synthesized three forms
of DAT: D AT1, DAT2, and D AT3, that differ in the fatty acyl unit esterified to the 3-position of the glucose
moiety in trehalose, where DAT1 carries mycosanoic acid, DAT2 carries mycolipanolic acid, and DAT3 carries
mycolipenic acid16. Synthetic DAT1 and D AT3 were previously demonstrated to be identical to natural prod-
ucts, but synthetic D AT2 possessed identical fragmentation patterns to natural product, but did not co-elute
by HPLC, suggesting that the two molecules are stereoisomers16. As a validation of the synthesized compound
structure and quality after storage, high-performance liquid chromatography-mass spectrometry (HPLC–MS)
analysis was performed (Fig. 1A–C). All three compounds yielded molecular ions with m/z values that, within
experimental error, were consistent with the ammoniated synthesized target structures (m/z 948.735, 1006.776,
and 988.766 for D AT1, DAT2, and DAT3 respectively). Each synthetic compound gave a single major chroma-
tographic peak, consistent with isomeric purity. Retention times in the reversed phase method are expected to
increase with molecular size but decrease with increasing polarity of groups, such as the hydroxy group on the
hydrocarbon chain, and the relative retention times of the synthetic DATs matched this prediction as D AT2
was < DAT1, with DAT3 showing the longest retention time. Thus, the compounds showed high purity, correct
mass and the expected retention times, allowing biological investigations of the antigenicity of DAT.
Diacyl trehalose acts as a Mincle ligand. Both natural mixed and synthetic forms of DAT can be ligands
for macrophage-inducible C-type lectin (Mincle), a receptor of the innate immune system and activator of mac-
rophages that responds to several types of trehalose containing g lycolipids16,18. To confirm that the stored syn-
thetic lipids are bioactive, we tested their ability to activate Mincle by measuring the activation of NFAT-GFP
in reporter cells expressing murine Mincle and its signaling subunit, the FcRγ chain. Synthetic DAT3 acts as an
agonist for Mincle, while stimulation of Mincle by DAT1 and DAT2 was not much higher than background even
at the highest concentrations tested (Figs. 1D and S1), consistent with the previously reported pattern16. These
results confirm that the chemical structure of DAT influences recognition by Mincle and that D AT3 is a strong
activator of Mincle.
Identification of CD1b‑DAT tetramer‑specific T cells. Regardless of their capacity to stimulate the
innate immune system, it is possible that DAT1, DAT2, or DAT3 can function as foreign lipid antigens presented
by CD1 proteins for human T cells. Among human CD1 proteins, CD1b can present lipids with the longest
and most alkyl chains22. The ~ C42 forms of DAT studied here were somewhat larger than most lipids present-
ing by other CD1 isoforms, so we hypothesized that DAT could be presented by CD1b molecules to activate
CD1b reactive T cells. To test this, we enriched T cells from healthy donor peripheral blood mononuclear cells
(PBMCs) by depleting non-T cells using magnetic selection and stained them with CD1b tetramers that were
treated with either synthetic DAT1, synthetic DAT2, or synthetic DAT3. Some T cells recognize ’CD1b-endo’
complexes, which are so named because they carry endogenous self-phospholipids from the mammalian CD1
protein expression system. Such T cells recognize CD1b-phosholipid or bind the CD1b protein itself independ-
ent of the lipid bound12,13. Therefore, we stained the T cells simultaneously with a phycoerythrin (PE)-labeled
synthetic DAT-treated CD1b tetramer and an allophycocyanin (APC)-labeled untreated CD1b tetramer (CD1b-
endo). For quantification, residual non-T cells and auto-fluorescent cells were gated out, as well as CD1b-endo
positive cells to determine true CD1b-DAT tetramer binding cells (Fig. S2a). CD1b-DAT tetramer+ cells were
detected in all eight donors tested (Fig. 2A). Binding of CD1b-DAT1 tetramers was the highest, with frequencies
ranging from 0.031 to 0.007% of total T cells, followed by CD1b-DAT2 (0.021–0.003%) and CD1b-DAT3, which
Scientific Reports | (2021) 11:2010 | https://doi.org/10.1038/s41598-021-81474-3 2
Vol:.(1234567890)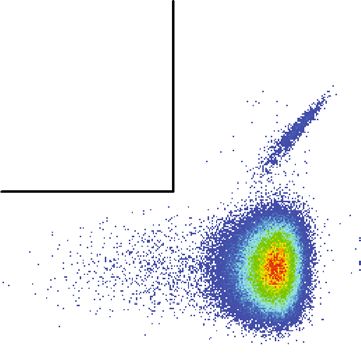
www.nature.com/scientificreports/
a DAT1 M + NH4+ 948.7346 m/z 948.73 6.72-6.75 min M + NH4+
4 4 948.734
6 OH
Counts x 104
HO 4 5 3
948.734 M + Na+
O O 3 953.689
C16H33 3 2 1 1
O 2 2
C9H19 O
O 1 1
O 751.646 1021.676
0
HO O OH
0 0
5 5.5 6 6.5 7 7.5 8 500 550 600 650 700 750 800 850 900 950 1000 940 950 960 970
OH OH
b
intenstity (counts x105)
intenstity (counts x104)
DAT2 M + NH4+ 1006.7764 m/z 1006.78 6.17-6.21 min M + NH4+
6 OH 3 1006.776
3 M + Na+
Counts x 104
HO 4 5 1006.776
O O 2 1011.730
C18H37 3 2 1 1 2
C9H19 OH O O
O 1 1
O 1079.724
0
HO O OH
0 0
5 5.5 6 6.5 7 7.5 8 500 600 700 800 900 1000 1100 1200 1000 1010 1020
OH OH
c M + NH4+
DAT3 M + NH4+ 988.7659 m/z 988.77 4 7.27-7.29 min 4 988.765
6 OH M + Na+
Counts x 104
HO 4 3 3
988.765 M + H+ 993.720
C18H37 O 5O
3 2 1 1 2 2 971.739
O O
C9 H19 O 1 1061.709 1
O 0 791.676
HO O OH
0 0
5 5.5 6 6.5 7 7.5 8 500 600 700 800 900 1000 1100 970 980 990 1000
OH OH time (min) mass-to-charge (m/z) mass-to-charge (m/z)
d 80
DAT1 DAT2 DAT3
Normalized To Mode
100 no lipid 60
NFAT-GFP%
80 50 ng/well
60 100 ng/well 40
40 200 ng/well
400 ng/well 20
20
0 800 ng/well 0
3 4 5 3 4 5 3 4 5
0 10 10 10 0 10 10 10 0 10 10 10 no
NFAT-GFP lipid DAT1 DAT2 DAT3
Figure 1. Synthetic DAT is a Mincle ligand. Synthetic D
AT1 (A), DAT2 (B), and DAT3 (C) were analyzed by
via high-performance liquid chromatography–mass spectroscopy (HPLC–MS). Extracted ion chromatograms
were generated for the ammoniated molecular ions. The mass spectra at the elution time of the ammoniated
ions contained the expected molecular ions with H+, NH4+, and Na+ adducts. Loss of hexose due to in-source
fragmentation (calculated m/z 751.645 for D
AT1 and 791.676 for DAT3) and sodium formate adduction with
the Na+ adducted molecular ion (calculated m/z 1021.677 for D AT1, 1079.719 for DAT2, and 1061.708 for
DAT3) accounted for additional small peaks. Differences between the three forms of DAT are indicated in
red in the structural formula, and the numbering of the trehalose carbons is shown in blue. (D) NFAT-GFP
reporter cells expressing mouse Mincle + FcRγ were stimulated with the indicated amount of DAT1, DAT2,
DAT3, or TDM. After 24 h the induction of NFAT-GFP was analyzed by flow cytometry as shown in histogram
and overlay flow cytometry histograms. Bar graphs represent three independent experiments. Values of each
experiment are shown as symbols. Error bar represents standard deviation.
was the lowest (0.009–0.001%). Visualization of double staining of T cells with CD1b-DAT- and CD1b-endo
tetramers, not gating CD1b-endo tetramer+ cells out (Fig. S2b), showed that most CD1b-DAT tetramer-binding
cells fail to bind CD1b-endo, as illustrated by dot plots from donor 49 (Fig. 2B) or the other donors (Fig. S3).
Together these results suggest that synthetic DAT1 and synthetic DAT2 are T cell antigens, while we could not
convincingly detect CD1b-synthetic DAT3 binding TCRs. Although we expect the three forms of DAT to load
with comparable efficiency onto CD1b, we cannot formally exclude the possibility that D AT3 was less efficiently
loaded. Therefore, our inability to detect CD1b-DAT3 binding T cells can be due to their absence in blood, or a
failure to load tetramers with DAT3.
To enable functional studies of T cell response, we stained PBMC from a healthy blood bank donor (HD1)
with anti-CD3 and CD1b-synthetic DAT2 tetramer. After two rounds of sorting and expansion of cells that were
positive for CD3 and tetramer, we obtained an oligoclonal T cell line that, upon flow cytometric analysis, was
demonstrated to consist mainly of T cells that stained double positive for mock treated CD1b (CD1b-mock) and
CD1b-DAT2 tetramer. The approximately 3% of the cells in the cell line that stained brightly with CD1b-DAT2
tetramer but were negative for CD1b-mock tetramer were sorted and expanded further (Fig. 2C, third sort) to
generate the 98% pure cell line HD1A (Fig. 2C, right panel). A 1.3% contamination of CD1b-mock+ cells was
detected, which was not surprising because it formed the majority of the cells before the third sort. We further
characterized line HD1A by staining with a panel of 24 Vβ antibodies (Fig. S4) and identified that it was an Vβ T
cell line that stained with anti-Vβ13.2, which stains the TRBV6-2 gene product (Fig. 2D). Expression of TRBV6-2
Scientific Reports | (2021) 11:2010 | https://doi.org/10.1038/s41598-021-81474-3 3
Vol.:(0123456789)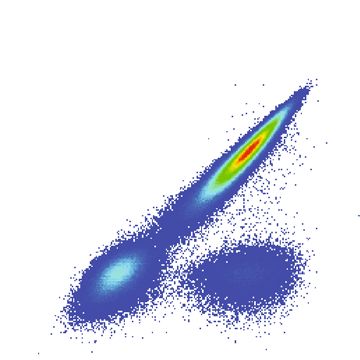
www.nature.com/scientificreports/
a b
0.04 CD1b-endo CD1b-DAT1 CD1b-DAT2 CD1b-DAT3
% CD1b-DAT tetramer + 5
CD1b-PE tetramer
10 0.002 0.001 0.031 0 0.021 0.0001 0.004 0
0.03
4
10
0.02 3
10
0.01 0
100 0.008 100 0.003 100 0.003 100 0.005
0.00 0 103 10 105
4 0 103 10 105
4 0 103 10 105
4
0 103 10 105
4
CD1b-endo-APC
T1
T2
T3
DA
DA
DA
c expansion expansion
3rd sort
expansion
5
1st sort 2nd sort line HD1A
CD1b-DAT2 -PE tetramer
10 105
CD1b-mock-APC tetramer
0.054 0.68 0 1.30
4 4
10 10
3
10 10
3
0
0
3.11 0.60 98.1
0 10 10 10 3 4 5
0 10 3
10 104 5 0 10 104 105 3 0 103 104 105
CD3-BV421 CD1b-DAT2 -PE tetramer
d line HD1A
e
105 0.64 TCR TRBV TRBJ CDR3β
CD1b-APC tetramer
98.8
HD1A TRBV6-2 TRBJ2-1 CASSRGLADEQFFGPG
104
103
0
0.54 0
0 10 10 105 3 4
anti-Vβ13.2-PE
Figure 2. Identification of CD1b-DAT binding human T cells. (A) Percentages of CD1b-DAT1, -DAT2, and
-DAT3 tetramer+ T cells of total T cells enriched from PBMC by column purification (n = 8 PBMC samples)
are shown. (B) Flow cytometry dot plots show CD1b-endo, -DAT1, -DAT2, and -DAT3 staining on T cells from
one of the healthy donors. (C) A T cell line was generated by sorting peripheral blood mononuclear cells from
Healthy Donor 1 (HD1) based on expression of CD3 and binding to CD1b tetramers treated with D AT2 or
mock treated (CD1b-mock), followed by expansion in vitro after each sort. Numbers next to or in the outlined
red areas indicate percent cells in gate. (D) Flow cytometry dot plots show anti-CD1b-and anti-Vβ13.2 (TRBV6-
2) staining on HD1A cell line. (E) TCR β chain sequence of HD1A TCR determined using a multiplex PCR and
Sanger sequencing-based approach.
was confirmed by a multiplex PCR approach (Fig. 2E). Thus, we were able to detect CD1b-DAT tetramer-binding
T cells ex vivo and derived a TRBV6-2+ synthetic D
AT2-specific αβT cell line.
Primary CD1b‑DAT recognizing T cells show functional responses to antigen. For some CD1b-
presented lipid antigens, the exact composition of the lipid tail does not matter for T cell r ecognition5. However,
for other CD1b antigens, such as Ac2SGL, mycolic acid, and mannosyl phosphomycoketide, the length and
configuration of the acyl tail influences T cell activation2,23–25. For these three lipids it was shown that differ-
ences in the structure of the acyl tails, such as length of the acyl chain and the number or pattern of C-methyl
branched groups changes recognition by the TCR. We wondered whether the diversity in the acyl chains of the
three synthesized DATs could influence recognition by T cells. Therefore, we asked whether T cell line HD1A
that was sorted with CD1b-synthetic D AT2 tetramers would be cross-reactive to the other synthetic DATs. Line
HD1A, which stained strongly with CD1b tetramers treated with DAT2, did not stain with D AT1-treated tetram-
Scientific Reports | (2021) 11:2010 | https://doi.org/10.1038/s41598-021-81474-3 4
Vol:.(1234567890)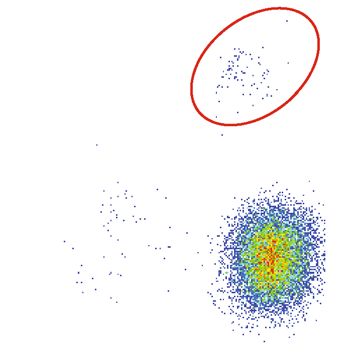
www.nature.com/scientificreports/
a Line HD1A
100
Normalized To Mode
CD1b-mock
80 CD1b-DAT1
60 CD1b-DAT2
CD1b-DAT3
40
20
0
0 103 10 4 105
CD1b-PE tetramer
b Line HD1A
250
IFNγ spots per 1000 cells
200
150
100
50
0
HD1A + + + + + + + + + + +
APC + + + + + + + + + + –
DAT1 – + + + – – – – – – –
DAT2 – – – – + + + – – – –
DAT3 – – – – – – – + + + –
αCD1b – – + – – + – – + – –
isotype – – – + – – + – – + –
Figure 3. Line HD1A is reactive to DAT2. (A) Flow cytometry histogram of line HD1A stained with DAT1-,
AT2-, or DAT3-, or mock-treated CD1b tetramers (CD1b-mock). (B) IFN-γ ELISPOT of line HD1A
D
stimulated with monocyte-derived dendritic cells treated with D AT1, DAT2, or DAT3, with or without anti-CD1b
antibody or Isotype control. Error bars represent standard error of the mean (SEM) of triplicate wells. One
representative experiment of three is shown.
ers more than the background obtained with mock-treated tetramers (Fig. 3A). CD1b-DAT3-treated tetramers
showed a weak staining.
Tetramer staining suggests that the T cells would be responsive to the lipid antigen loaded onto the tetram-
ers, but not all tetramer-binding T cells show functional responses upon presentation of antigen by antigen-
presenting cells. To investigate functional responses to cellular presentation of synthetic DATs, we tested whether
HD1A cells are functionally reactive to monocyte-derived dendritic cells, which represent in vitro generated
primary APCs26, treated with synthetic DATs. D AT2 induced secretion of interferon-γ (IFN-γ) by HD1A T
cells, while APCs treated with DAT1, DAT3 or medium alone, did not (Fig. 3B). Production of IFN-γ was almost
completely blocked by anti-CD1b antibodies, indicating that CD1b is necessary for the activation of the HD1A
by antigen, but not by other receptors present on the APCs, including CD1a, CD1c, or CD1d. Of note, synthetic
DAT3, which supported low CD1b tetramer staining, did not lead to IFN-γ responses, which is most likely due to
low potency of DAT3 as an antigen for HD1A. Thus, the HD1A cell line shows CD1b-dependent, highly specific
functional responses to synthetic DAT2 presented by APCs, which is likely caused by TCR recognition of the
CD1b-DAT2 complex. The lack of functional responses to D AT1 and D AT3 suggests that the chemical differences
among DATs, consisting of the differing fatty acyl units at C3 of trehalose (Fig. 1A), influence recognition by T
cells and prevents cross-reactivity.
CD1b‑DAT2 binding T cells in Peruvian cohort. Next, we wanted to measure the frequency of
AT2-reactive T cells in a cohort of 150 human subjects27,28 to determine if there is an Mtb infection or disease-
D
associated expansion of DAT-specific T cells. PBMCs were isolated from 50 Peruvian individuals with active
Scientific Reports | (2021) 11:2010 | https://doi.org/10.1038/s41598-021-81474-3 5
Vol.:(0123456789)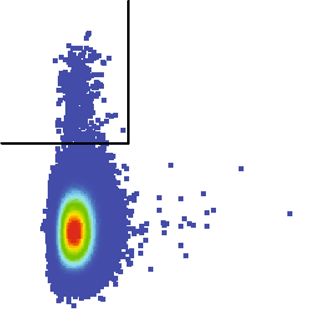
www.nature.com/scientificreports/
tuberculosis (TB) before the start of anti-TB drug treatment. In addition, PBMCs were isolated from 50 patients
with latent TB infection and 50 household contacts with Mtb exposure, but no documented infection (unin-
fected), based on IFN-γ release assay results27,28. To generate adequate numbers of T cells for the tetramer analy-
sis, we expanded an aliquot of PBMCs by stimulation with anti-CD3 antibody and feeder cells, as previously
described28. CD1b-synthetic D AT2 binding T cells were observed in subjects across all three groups, although
in low frequencies. Comparing the median tetramer staining rate among the three groups based on TB disease
status, the frequencies of CD1b-DAT2 tetramer positive T cells did not significantly differ among active TB
patients, latently infected patients, and uninfected subjects as determined by the Kruskall-Wallis test (Fig. 4A).
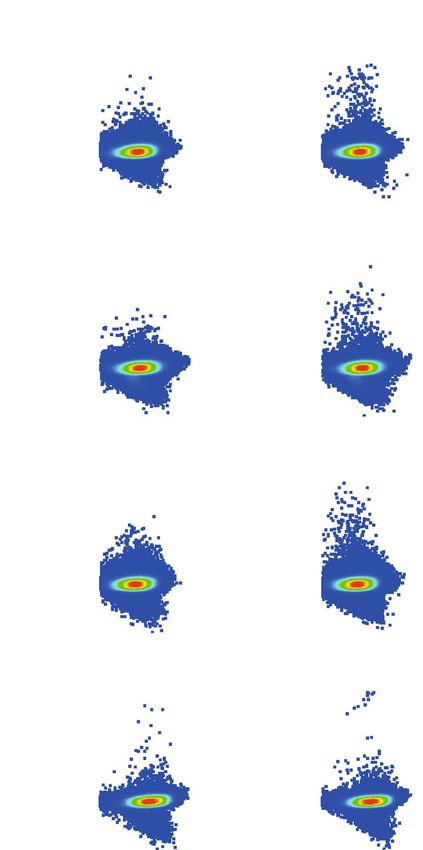
Staining patterns of expanded PBMCs with CD1b-synthetic D AT2 vary from broad smear of tetramer positive
cells as illustrated by three subjects with tetramer-binding T cells (subjects 115-7, 149-4, and 63-1) to smaller
high affinity populations, as seen for subject 206-0 (Fig. 4B). Thus, synthetic D
AT2 is recognized by T cells in the
blood, but frequencies of these cells did not increase after infection with Mtb.
Discussion
Here we have characterized the antigenicity of DAT for the human immune system and show that synthetic DATs
are able to act as both an innate and an adaptive agonist. Small differences in chemical structure between the three
synthetic forms of DAT had strong effects on stimulation of innate versus adaptive receptors. We determined
that DAT3, but not DAT1 or DAT2, behaved as a highly potent activator of the innate receptor Mincle, while
DAT1 was by far the most potent compound recognized by polyclonal, ex-vivo T cells across multiple donors.
As predicated, DAT could be presented by CD1b and act as an antigen for T cells. Across multiple healthy
donors we observed T cell binding to CD1b-DAT tetramers with frequencies similar to binding of CD1b-GMM
and mycolic acid tetramers28. The highest percentage of CD1b-DAT tetramer+ cells was observed using synthetic
DAT1 treated tetramers, followed by synthetic D AT2 treated CD1b tetramers, while the percentage CD1b-syn-
thetic DAT3 tetramer+ T cells was extremely low. These results suggest that the composition of methyl-branched
fatty acids of DAT strongly influences recognition by CD1b-reactive T cells.
Among the trehalose-based glycolipids that are made by Mtb, DAT is one of the smallest and simplest.
Whereas sulfoglycolipids are sulfated on the 2′-position of the trehalose core and can carry up to four alkyl
chains9, DAT is not sulfated and by definition carries two alkyl c hains16. DAT carries an esterified unbranched
saturated fatty acid on the 2-position of trehalose and a branched fatty acid on the 3-position: mycosanoic
(DAT1), mycolipanolic ( DAT2) or mycolipenic acid ( DAT3)16. Thus, although sulfoglycolipids can carry longer
and more complex branched fatty acids at the 2- and 3-position, A c2SGL is the closest relative of DAT. The
binding mechanism of A c2SGL to CD1b is known and shows that CD1b presents A c2SGL to T cells with the
participation of endogenous spacer lipid that is simultaneously bound in the c left29. The presence of these spacers
in addition to A c2SGL leads to rearrangement of the lipid-binding groove, allowing accommodation for bulky
antigens. At the same time this rearrangement reduces the capacity of the A’ pocket of CD1b to accomodate the
phthioceranoyl chain of A c2SGL, forcing the first three methyl groups of the fatty acyl chain to remain exposed
above the CD1b surface for recognition by TCR29. Since Ac2SGL and DAT show structural similarities, DAT
might be presented by CD1b in a similar way, with the methyl branched motif exposed on the outer surface
of CD1b. If that is true, differences in the exposed residues that are available for TCR recognition, such as the
presence of the extra hydroxy group in the acyl chain of DAT2 and the α,β-unsaturation in DAT3, might explain
the observed lack of cross-recognition by TCRs, such as HD1A. In addition, the differences in the number of
C-methyl groups on the fatty acid of DAT1 (2 groups) and DAT2 and DAT3 (3 groups) could play a role in lack of
cross-reactivity. However, the opposite effect was observed for A c2SGL: an increased number of methyl-branched
carbons led to an increase in the ability of the synthetic Ac2SGLs to stimulate T cells, which was true for up to
four methyl groups24. Thus, the nature of the effect of methyl-branched fatty acids of DAT on T cell recognition
by CD1b-reactive T cells can only be fully understood by additional analyses, including protein crystallography
of the trimolecular complex of CD1b-DAT-TCR.
The Peruvian TB cohort data shows that synthetic DAT2 is recognized by T cells in people with active TB,
healthy latently Mtb-infected, and uninfected controls. However, a difference in frequencies of CD1b-DAT bind-
ing T cells among highly exposed groups that differed in their IGRA status was not observed, similar to other CD1
tetramer studies in cohorts28,30. Also, the range of percentage of CD1b-DAT2 tetramer+ T cells of Peruvian subjects
was similar to the Boston healthy donors. Together, these data suggest that CD1b-DAT2-specific T cells do not
expand upon Mtb exposure, or, if they do, it is not detectable among T cells that circulate in the blood. Recent
studies have suggested that total blood MR1-reactive T cells can stay unchanged or fall in the setting of infection
or antigen-stimulation27,31–33. Thus, a more general perspective to emerge from these studies is that blood-based
quantification is not a reliable measure of total body T cell dynamics. Nevertheless, these studies provide proof
of principle for DAT specific T cells response and point to DAT1 as the T cell antigen with highest response.
In conclusion, our results show that the mycobacterial lipid DAT is an antigen for T cells as well as a stimulat-
ing ligand for the Mincle receptor, but the structural differences in the fatty acyl chains of the different forms of
DAT strongly influence the type of biological response they elicit.
Material and methods
HPLC–MS of synthetic DAT. Diacyl trehaloses were synthesized as previously published (13). The syn-
thetic DAT compounds were analyzed on an Agilent Technologies 6530 Accurate-Mass Q-TOF HPLC–MS sys-
tem. Reversed phase liquid chromatography (LC) used a C-18 HPLC column (Agilent Poroshell 120, 2.7 mm,
4.6 mm × 100 mm) and a gradient method with 7:3 methanol:water (solvent A) and 85:15 1-propanol:cyclohexane
(solvent B). Both solvents contained 2.0 mM ammonium formate. 0.1% water was added to solvent B to aid dis-
solution. The solvent gradient used a 0.5 mL/min flowrate throughout and started at 60% solvent B, increased
Scientific Reports | (2021) 11:2010 | https://doi.org/10.1038/s41598-021-81474-3 6
Vol:.(1234567890)
www.nature.com/scientificreports/
a CD1b-DAT2 tetramer
0.1
% in CD3+ population
0.01
0.001
0.0001
0.00001
latent TB active TB uninfected
b CD1b-mock CD1b-DAT2
5
10
0.0086 0.010
4
10
115-7
3
10
0
5
10
0.0091 0.010
4
10
149-4
3
10
0
5
10
0.0012 0.0075
4
10
63-1
3
10
0
5
CD1b-PE tetramer
10
0.0033 0.0038
4
10
206-0
3
10
0
0 103 104 105 0 103 104 105
CD3-BV421
Figure 4. Quantification of CD1b-DAT2 tetramer binding T cells in a Peruvian TB cohort. (A) Frequencies of
CD1b-mock and CD1b-DAT2 tetramer+ T cells among the 150 subjects of the Peruvian cohort, analyzed by TB
disease status. Medians and interquartile ranges of tetramer+ T cells are depicted as a percent of total C
D3+ cells.
(B) Representative flow cytometry dot plots from subjects with CD1b-DAT2 tetramer positive T cells.
Scientific Reports | (2021) 11:2010 | https://doi.org/10.1038/s41598-021-81474-3 7
Vol.:(0123456789)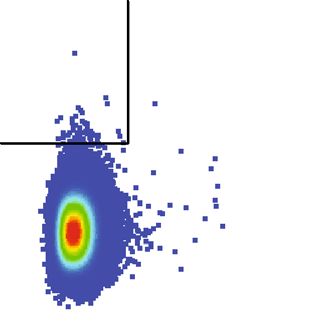
www.nature.com/scientificreports/
linearly starting at 1.0 min and ending at 100% solvent B at 10.0 min, and finally holding at 100% B until
15.0 min. Runs were initiated with 10 µL injections of the synthetic compounds at a concentration of 20 ng/
mL in starting mobile phase. Detected ions were analyzed using Agilent Technologies MassHunter Qualitative
Analysis B.07.00 software.
Mincle activation assay. For the cellular Mincle assays D
AT1, DAT2, and D
AT3 were dissolved in chloro-
form/methanol at 1 mg/mL, diluted in isopropanol to appropriate concentrations and added to a 96-well plate at
20 µL/well. After evaporation of the isopropanol, 30,000 2B4-NFAT-GFP reporter cells expressing mouse Mincle
were added to each well in 100 µL medium. After incubation at 37 °C for 24 h the expression of NFAT-GFP was
analyzed by flow cytometry.
Human subjects. The Brigham and Women’s Hospital Specimen Bank, Boston, provided de-identified leu-
koreduction filters from local blood bank donors for PBMC isolation. Subjects with pulmonary TB disease and
their household contacts were recruited through Socios En Salud, an affiliate of Partners in Health, based in
Lima, Peru27,28. We enrolled 50 patients with culture confirmed pulmonary TB and 100 of their asymptomatic
household contacts of whom 50 had positive IGRA tests, as determined by the QuantiFERON TB-Gold In-Tube
assay (Qiagen) and 50 subjects were IGRA negative (classified as “exposed but uninfected”). Participants were
at least 14 years old and had a negative HIV serology test. Peripheral blood mononuclear cells (PBMC) were
isolated from 50 mL of blood and cryopreserved at 5 × 10⁶ cells per aliquot. The Institutional Review Board of
the Harvard Faculty of Medicine and Partners Healthcare, and the Institutional Committee of Ethics in Research
of the Peruvian Institutes of Health approved this study protocol. All adult study participants and parents or
legal guardians of minors had to provide informed consent, while minors provided assent. All methods were
performed in accordance with the relevant guidelines and regulations.
Tetramers. For lipid loading, WT CD1b monomers were obtained from the NIH tetramer facility. In a
10 mm wide glass tube, 16 μg of dry lipid was sonicated at 37 °C for 1 h in 45 μL of 0.5% CHAPS 50 mM sodium
citrate buffer pH 4.5 for DAT-treated tetramers, as previously described for other lipid ligands28. For CD1b-
mock no lipid was added to the tube. Subsequently, CD1b monomers (10 μg) were added to the tubes and
incubated overnight at 37 °C. The next day the solution of the monomers was neutralized to pH 7.4 by adding
5 μL 1 M Tris pH 8. Monomers were tetramerized using streptavidin-APC (Molecular Probes) or streptavidin-
PE (Invitrogen).
T cell lines and T cell assays. For generation of T cell lines, total PBMC or PBMC-derived T cells were
stained with CD1b-DAT tetramer and anti-CD3. PBMCs were sorted for double positive staining of CD3 and
tetramer. Expansion of sorted cells was performed by plating cells at 100–700 cells/well in round-bottom 96-well
plates containing 2.5 × 10⁵ irradiated allogeneic PBMCs, 5 × 10⁴ irradiated Epstein Barr Virus transformed B
cells, and 30 ng/mL anti-CD3 antibody (clone OKT3) per plate as described p reviously28. The next day human
IL-2 was added to the wells. After 2 weeks, sorting and expansion procedure was repeated as needed. For ELIS-
POT assays, cocultures of 4 × 10⁴ APCs (G4 monocytes) pre-incubated with DAT for 30 min 37 °C and 1 × 10³ T
cells were incubated for 16 h in a Multiscreen-IP filter plate (96 wells; Millipore) coated according to the manu-
facturer’s instructions (Mabtech). For blocking, APCs were preincubated for 1 h at 37 °C with anti-CD1b block-
ing antibody BCD1b3.1 or control IgG P3 (10 μg/mL) before adding T cells.
Staining protocol. T cells were enriched by depletion of non-T cells using the Pan T cell Isolation Kit
(Miltenyi Biotec) according to manufacturer’s protocol. Human enriched T cells and T-cell lines were stained
with tetramers at 2 μg/mL in PBS containing 1% BSA and 0.01% sodium azide. Cells and tetramer were incu-
bated for 10 min at room temperature in the dark, followed by addition of cell surface antibodies for 10 min at
room temperature as described previously27,28. Subsequently, cells were treated with unlabeled OKT3 antibody
and incubated for 20 min at 4 °C. Cells were analyzed using the BD LSRFortessa flow cytometer and FlowJo
software. For staining of PBMCs from Peruvian participants ~ 3 × 10⁶ cells were stained with a “live-dead” fixable
blue cell stain (Molecular Probes), then treated with tetramer in for 10 min at room temperature, followed by cell
surface antibodies for 5 min. Subsequently, cells were treated with unlabeled OKT3 antibody and incubated for
5 min at room temperature, followed by 10 min at 4 °C. Cells were fixed in fresh 2% paraformaldehyde (Electron
Microscopy Sciences) in PBS for 20 min. Antibodies that were used: CD3-BV421 (UCHT1; Biolegend), CD3-
FITC (SK7; BD Bioscience).
TCR sequencing. TCR sequences were determined by isolating RNA from bulk sorted T cell populations
using the RNeasy kit (QIAGEN), followed by complementary DNA synthesis using the QuantiTect Reverse
Transcription Kit (QIAGEN). TCR transcripts were amplified using a multiplex approach12, followed by direct
Sanger sequencing of the PCR product.
Received: 21 October 2020; Accepted: 4 January 2021
Scientific Reports | (2021) 11:2010 | https://doi.org/10.1038/s41598-021-81474-3 8
Vol:.(1234567890)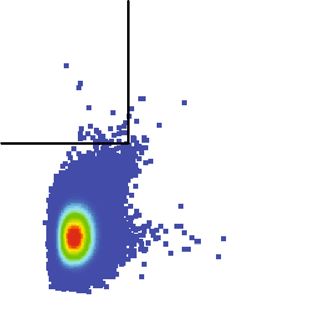
www.nature.com/scientificreports/

                                  References
                                   1. Pai, M. et al. Gamma interferon release assays for detection of Mycobacterium tuberculosis infection. Clin. Microbiol. Rev. 27, 3–20
                                      (2014).
                                   2. de Jong, A. et al. CD1c presentation of synthetic glycolipid antigens with foreign alkyl branching motifs. Chem. Biol. 14, 1232–1242
                                      (2007).
                                   3. Moody, D. B. et al. T cell activation by lipopeptide antigens. Science 303, 527–531 (2004).
                                   4. Moody, D. B. et al. CD1c-mediated T-cell recognition of isoprenoid glycolipids in Mycobacterium tuberculosis infection. Nature
                                      404, 884–888 (2000).
                                   5. Moody, D. B. et al. Structural requirements for glycolipid antigen recognition by CD1b-restricted T cells. Science 278, 283–286
                                      (1997).
                                   6. Ly, D. et al. CD1c tetramers detect ex vivo T cell responses to processed phosphomycoketide antigens. J. Exp. Med. 210, 729–741
                                      (2013).
                                   7. Layre, E. et al. Mycolic acids constitute a scaffold for mycobacterial lipid antigens stimulating CD1-restricted T cells. Chem. Biol.
                                      16, 82–92 (2009).
                                   8. Beckman, E. M. et al. Recognition of a lipid antigen by CD1-restricted αβ+ T cells. Nature 372, 691–694 (1994).
                                   9. Gilleron, M. et al. Diacylated sulfoglycolipids are novel mycobacterial antigens stimulating CD1-restricted T cells during infection
                                      with Mycobacterium tuberculosis. J. Exp. Med. 199, 649–659 (2004).
                                  10. Sieling, P. A. et al. CD1-restricted T cell recognition of microbial lipoglycan antigens. Science 269, 227–230 (1995).
                                  11. Van Rhijn, I. & Moody, D. B. Donor unrestricted T cells: a shared human T cell response. J. Immunol. 195, 1927–1932 (2015).
                                  12. Shahine, A. et al. A T-cell receptor escape channel allows broad T-cell response to CD1b and membrane phospholipids. Nat. Com-
                                      mun. 10, 1–12 (2019).
                                  13. Van Rhijn, I. et al. Human autoreactive T cells recognize CD1b and phospholipids. Proc. Natl. Acad. Sci. U.S.A. 113, 380–385
                                      (2016).
                                  14. Gras, S. et al. T cell receptor recognition of CD1b presenting a mycobacterial glycolipid. Nat. Commun. 7, 13257 (2016).
                                  15. Ortalo-Magné, A. et al. Identification of the surface-exposed lipids on the cell envelopes of Mycobacterium tuberculosis and other
                                      mycobacterial species. J. Bacteriol. 178, 456–461 (1996).
                                  16. Holzheimer, M. et al. Asymmetric total synthesis of mycobacterial diacyl trehaloses demonstrates a role for lipid structure in
                                      immunogenicity. ACS Chem. Biol. 15, 1835–1841 (2020).
                                  17. Ishikawa, E. et al. Direct recognition of the mycobacterial glycolipid, trehalose dimycolate, by C-type lectin Mincle. J. Exp. Med.
                                      206, 2879–2888 (2009).
                                  18. Decout, A. et al. Rational design of adjuvants targeting the C-type lectin Mincle. Proc. Natl. Acad. Sci. U.S.A. 114, 2675–2680
                                      (2017).
                                  19. Lang, R., Schoenen, H. & Desel, C. Targeting Syk-Card9-activating C-type lectin receptors by vaccine adjuvants: findings, implica-
                                      tions and open questions. Immunobiology 216, 1184–1191 (2011).
                                  20. Schoenen, H. et al. Cutting Edge: Mincle is essential for recognition and adjuvanticity of the mycobacterial cord factor and its
                                      synthetic analog trehalose-dibehenate. J. Immunol. 184, 2756–2760 (2010).
                                  21. Lee, K. et al. Diacyltrehalose of Mycobacterium tuberculosis inhibits lipopolysaccharide- and mycobacteria-induced proinflam-
                                      matory cytokine production in human monocytic cells. FEMS Microbiol. Lett. 267, 121–128 (2007).
                                  22. Moody, D. B. et al. Lipid length controls antigen entry into endosomal and nonendosomal pathways for CD1b presentation. Nat.
                                      Immunol. 3, 435–442 (2002).
                                  23. Gau, B. et al. Simplified deoxypropionate acyl chains for mycobacterium tuberculosis sulfoglycolipid analogues: chain length is
                                      essential for high antigenicity. ChemBioChem 14, 2413–2417 (2013).
                                  24. Guiard, J. et al. Fatty acyl structures of mycobacterium tuberculosis sulfoglycolipid govern T cell response1. J. Immunol. 182,
                                      7030–7037 (2009).
                                  25. Van Rhijn, I. et al. CD1b-mycolic acid tetramers demonstrate T-cell fine specificity for mycobacterial lipid tails. Eur. J. Immunol.
                                      47, 1525–1534 (2017).
                                  26. Sallusto, F. & Lanzavecchia, A. Efficient presentation of soluble antigen by cultured human dendritic cells is maintained by granu-
                                      locyte/macrophage colony-stimulating factor plus interleukin 4 and downregulated by tumor necrosis factor α. J. Immunol. 200,
                                      887–896 (2018).
                                  27. Suliman, S. et al. Peripheral blood mucosal-associated invariant T (MAIT) cells in tuberculosis patients and healthy Mycobacterium
                                      tuberculosis-exposed controls. J. Infect. Dis. 222, 995–1007 (2020).
                                  28. Lopez, K. et al. CD1b Tetramers broadly detect T cells that correlate with mycobacterial exposure but not tuberculosis disease
                                      state. Front. Immunol. 11, 199 (2020).
                                  29. Garcia-Alles, L. F. et al. Structural reorganization of the antigen-binding groove of human CD1b for presentation of mycobacterial
                                      sulfoglycolipids. Proc. Natl. Acad. Sci. U.S.A. 108, 17755–17760 (2011).
                                  30. Layton, E. D. et al. Validation of a CD1b tetramer assay for studies of human mycobacterial infection or vaccination. J. Immunol.
                                      Methods 458, 44–52 (2018).
                                  31. Le Bourhis, L. et al. Antimicrobial activity of mucosal-associated invariant T cells. Nat. Immunol. 11, 701–708 (2010).
                                  32. Jiang, J. et al. Mucosal-associated invariant T cells from patients with tuberculosis exhibit impaired immune response. J. Infect.
                                      72, 338–352 (2016).
                                  33. Kwon, Y. et al. Mucosal-associated invariant T cells are numerically and functionally deficient in patients with mycobacterial
                                      infection and reflect disease activity. Tuberculosis 95, 267–274 (2015).

                                  Acknowledgements
                                  DBM was supported by National Institutes of Health (NIH) grant R01 AI049313. DBM, MM, and IVR were
                                  supported by and NIH Tuberculosis Research Unit Network, Grant U19 AI111224. JFR, MH, and AJM were
                                  supported by Nederlands Wetenschappelijk Onderzoek (NWO) Toppunt grant 15.002.

                                  Author contributions
                                  J.F.R. and I.V.R. designed research. J.F.R., S.S., I.V.R., K.L. and D.Y. performed experiments. M.H., A.J.M., E.I.,
                                  S.Y., J.J., R.C., M.M., and L.L. contributed unique reagents. J.F.R., D.Y., D.B.M., and I.V.R. analyzed data. J.F.R.,
                                  D.B.M., and I.V.R. wrote the manuscript.

                                  Competing interests
                                  The authors declare no competing interests.

Scientific Reports |   (2021) 11:2010 |                    https://doi.org/10.1038/s41598-021-81474-3                                                                    9

                                                                                                                                                                   Vol.:(0123456789)
www.nature.com/scientificreports/
Additional information
Supplementary Information The online version contains supplementary material available at https://doi.
org/10.1038/s41598-021-81474-3.
Correspondence and requests for materials should be addressed to I.V.R.
Reprints and permissions information is available at www.nature.com/reprints.
Publisher’s note Springer Nature remains neutral with regard to jurisdictional claims in published maps and
institutional affiliations.
Open Access This article is licensed under a Creative Commons Attribution 4.0 International
License, which permits use, sharing, adaptation, distribution and reproduction in any medium or
format, as long as you give appropriate credit to the original author(s) and the source, provide a link to the
Creative Commons licence, and indicate if changes were made. The images or other third party material in this
article are included in the article’s Creative Commons licence, unless indicated otherwise in a credit line to the
material. If material is not included in the article’s Creative Commons licence and your intended use is not
permitted by statutory regulation or exceeds the permitted use, you will need to obtain permission directly from
the copyright holder. To view a copy of this licence, visit http://creativecommons.org/licenses/by/4.0/.
© The Author(s) 2021
Scientific Reports | (2021) 11:2010 | https://doi.org/10.1038/s41598-021-81474-3 10
Vol:.(1234567890)You can also read