The Effect of A2E on the Uptake and Release of Calcium in the Lysosomes and Mitochondria of Human RPE Cells Exposed to Blue Light - Hindawi.com
←
→
Page content transcription
If your browser does not render page correctly, please read the page content below
Hindawi
Journal of Ophthalmology
Volume 2021, Article ID 5586659, 10 pages
https://doi.org/10.1155/2021/5586659

Research Article
The Effect of A2E on the Uptake and Release of Calcium in the
Lysosomes and Mitochondria of Human RPE Cells Exposed to
Blue Light

          Mao-Mei Luo,1,2,3 Lin Chen,1,2,4,5 Shu Wang,1,2 Chun Zeng,1,2 De-Zhi Li,1,2 YeGe Bi,1,2
          Long-Qian Liu ,4,5 and Shan-Jun Cai 1,2
          1
            Department of Ophthalmology, Affiliated Hospital of Zunyi Medical University, Zunyi, Guizhou, China
          2
            Key Laboratory of Eye Diseases of Guizhou Province, Guizhou Eye Hospital, Zunyi, Guizhou, China
          3
            Department of Ophthalmology, Dazhou Central Hospital, Dazhou, Sichuan, China
          4
            Department of Ophthalmology, West China Hospital, Sichuan University, Chengdu, Sichuan, China
          5
            Department of Optometry and Visual Science, West China Hospital, Sichuan University, Chengdu, Sichuan, China

          Correspondence should be addressed to Long-Qian Liu; b.q15651@hotmail.com and Shan-Jun Cai; caishanjun@163.com

          Mao-Mei Luo and Lin Chen contributed equally to this work.

          Received 10 January 2021; Revised 26 August 2021; Accepted 2 September 2021; Published 24 September 2021

          Academic Editor: Ana Raquel Santiago

          Copyright © 2021 Mao-Mei Luo et al. This is an open access article distributed under the Creative Commons Attribution License,
          which permits unrestricted use, distribution, and reproduction in any medium, provided the original work is properly cited.
          We aimed to explore the effect of N-retinylidene-N-retinylethanolamine (A2E) on the uptake and release of calcium in lysosomes and
          mitochondria by establishing a model of human retinal pigment epithelial (RPE) cell injury induced by exposure to blue light. Primary
          human RPE cells were cultured from passages 4 to 6 and exposed to blue light at an intensity of 2000 ± 500 lux for 6 hours. After blue light
          exposure, the culture was maintained for 24 hours. A2E at a final concentration of 25 μM was added to the culture 2 hours before light
          exposure, and nifedipine at a final concentration of 10−4 M was added 1 hour before light exposure. The levels of Ca2+ in the cytosol
          (CaTM/2AM), mitochondria (Rhod/2AM), and lysosomes (LysoTracker Red and Fluo-3/AM) were determined. In order to measure the
          calcium levels in the different organelles, RPE were imaged using a laser scanning confocal microscope. Moreover, changes in the
          mitochondrial membrane potential were detected by flow cytometry analysis of JC-1-stained cells. The obtained results revealed that blue
          light illumination increased the calcium fluorescence intensity in the cytoplasm, mitochondria, and lysosomes of human RPE cells when
          compared with the control cells (P < 0.05). After A2E treatment, the fluorescence intensity of the calcium in the cytoplasm was further
          increased (P < 0.05), while that in the mitochondria and lysosomes decreased (P < 0.05). In addition, we observed that nifedipine reduced
          the fluorescence intensity of calcium in the RPE cells. Our results also showed that the mitochondrial membrane potential in the RPE
          treated with blue light and A2E was lower than that in the control, blue light, and A2E-treated cells (P < 0.05). Blue light increased calcium
          levels in the cytoplasm, lysosomes, and mitochondria of RPE cells. A2E damages the lysosomal and mitochondrial membranes, resulting in
          calcium release into the cytoplasm. Finally, our results demonstrated that both blue light and A2E treatments reduced mitochondrial
          membrane potential, increasing cytosolic Ca2+ levels, which can contribute to the activation of RPE death.

1. Introduction                                                               inducing changes at structural and functional cellular levels.
                                                                              The accumulation of this pigment is related to the increase in
Retinal pigment epithelial (RPE) cells have many important                    the incidence of diseases such as age-related macular de-
functions, including phagocytosis of the photoreceptor outer                  generation (AMD) and Stargardt disease [1, 2]. As the main
segments and the undigested cargo, after forming lipofuscin.                  component of lipofuscin, N-retinylidene-N-retinylethanol-
The accumulation of lipofuscin in RPE cells increases slowly                  amine (A2E) is fluorescent and phototoxic and is not easily
with age, which enhances the sensitivity to light radiation by                degraded in lysosomes [3]. In the visible light spectrum, blue
2                                                                                                    Journal of Ophthalmology

light is the most harmful, with a wavelength of 400–500 nm         2.2. Reagents and Instruments. Dulbecco’s modified Eagle’s
that can directly penetrate the lens and reach the retina. Long-   medium (DMEM) and trypsin-EDTA solution were ob-
term exposure can cause damage to the macula [4]. Under            tained from HyClone (Logan, Utah, USA). Fetal bovine
blue light irradiation, the structure of A2E changes and           serum (FBS) was obtained from MRC (New Zealand).
produces superoxide anions, singlet oxygen, and other sub-         Hank’s balanced salt solution (HBSS), Rhod-2/AM, Fluo-3/
stances, which reduce the activity of lysosomal enzymes,           AM, and LysoTracker Red DND-99 were obtained from
destroy lysosomal membranes, and target mitochondria,              Thermo Fisher Scientific (Waltham, MA). CaTM-2/AM was
decreasing RPE cell viability and inducing apoptosis [5, 6].       obtained from Goryo (Sapporo, Japan). NFD and F-127 were
     As a second messenger in the cell, calcium (Ca2+) can         obtained from Sigma-Aldrich (St. Louis, MO). Mouse anti-
initiate a series of biochemical reactions and is stored in        human keratin antibody, goat anti-mouse IgG-HRP, mi-
organelles such as lysosomes and mitochondria [7]. The             tochondrial membrane potential assay kit with JC-1,
dynamic balance of calcium ions is essential to maintain the       phosphate-buffered saline (PBS), and penicillin-strepto-
function of cells. Sustained high concentrations of Ca2+ in        mycin were obtained from Solarbio (Beijing, China). Di-
cells generate a large amount of reactive oxygen species           methyl sulfoxide (DMSO) was obtained from MP Bio
(ROS), which damage organelle structures, activate various         (California, USA). A2E was donated by Sun Xiaodong (The
enzymes, and induce apoptosis [8]. Lysosomes and mito-             First Affiliated Hospital of Shanghai Jiaotong University).
chondria can rapidly, reversibly, and selectively absorb the
Ca2+ released from the endoplasmic reticulum to maintain
intracellular Ca2+ homeostasis [9]. The Ca2+ channel of the        2.3. Primary Culture of Human RPE Cells. Briefly, the eye-
lysosome contributes to the generation of Ca2+ signals in the      balls were cut behind the serrated margin. The cornea, lens,
cell and regulates the material transportation, fusion, and        vitreous body, and retinal neuroepithelium were carefully
exocytosis of the lysosome. Ca2+ in mitochondria is involved       removed to form an eyecup and then washed with HBSS.
in oxidative phosphorylation, mitochondrial motility, ATP          Approximately 2/3 of the eyecup was filled with 0.25%
synthesis, and apoptosis of cells. Ca2+ overload in mito-          trypsin and incubated at 37°C for 45 min. The cell suspension
chondria will open the mitochondrial permeability transport        was collected and the precipitate was resuspended in DMEM
pore, leading to mitochondrial swelling and outer membrane         containing 10% FBS, seeded in a 25 cm2 cell culture flask,
rupture and finally inducing cell apoptosis. Therefore, there is    and cultured in an incubator. Cells from the same passage
strong interest in the changes in Ca2+ levels in lysosomes and     were used for each experiment.
mitochondria of RPE cells, under blue light irradiation and
A2E loading.                                                       2.4. Immunohistochemistry. Established third-generation
     In the visible light spectrum, blue light (BL) is the most    human RPE cells were seeded on a sterilized cover glass and
harmful, with a wavelength of 400–500 nm that can directly         fixed with 4% paraformaldehyde for 10 min. Then, 3% hy-
penetrate the lens and reach the retina. Long-term exposure        drogen peroxide was added for a 15 min incubation, and cells
can cause damage to the macula [4]. Early studies of this          were permeabilized with 1% Triton X-100 for 30 min at room
research group explored the optimal light intensity and time       temperature and washed with PBS. Then, the cells were blocked
for blue light exposure, finding it to be 2000 ± 500 lux for 6      by goat serum for 10 min and incubated at 4°C overnight with
hours [10], while cultures were maintained in the incubator        mouse anti-human RPE65 antibody. After incubation in goat
for 24 hours after blue light exposure. Under this condition,      anti-mouse IgG antibody for 1 h at 37°C in the dark, nuclei
there were more apoptotic cells and fewer necrotic cells. The      were stained with 4′,6-diamidino-2-phenylindole (DAPI). The
optimal concentration of A2E was determined to be 25 µM            cells were visualized by fluorescence microscopy.
[11, 12]. The cell viability significantly decreased in an A2E-
dose-dependent manner, and cell viability was best under
this condition. Nifedipine (NFD) was used to eliminate the         2.5. Calcium in the Cytoplasm. Fourth-generation human
influence of extracellular Ca2+ influx. Using these findings,         RPE cells were seeded in confocal dishes at a density of
we explored the effects of A2E on the lysosomal and mi-             1 × 10⁵ cells/ml and divided into five groups: control cells
tochondrial uptake and release of Ca2+ in RPE cells, after         (control), blue light-treated cells (BL), blue light + NFD-
blue light irradiation. These results may provide a basis for      treated cells (BL + NFD), A2E + blue-treated cells
further elucidation of human RPE cell apoptosis induced by         (A2E + BL), and A2E + blue light + NFD-treated cells
blue light.                                                        (A2E + BL + NFD). A2E at a final concentration of 25 μm
                                                                   was added to cells in the dark 2 hours before they were
2. Materials and Methods                                           illuminated, and NFD at a final concentration of 10−4 M was
                                                                   added 1 hour before they were illuminated. Then, the cells
2.1. Cell Sources and Ethics Statement. Three donor eyeballs       were exposed to blue light in an incubator for 6 hours (the
were obtained from a healthy 47-year-old male, 53-year-old         cells in the control group were wrapped in tin foil) with an
male, and 62-year-old female who died in an accident.              intensity of 2000 ± 500 lux, and the culture was maintained
Within 12 hours of death, the eyes were taken after kera-          for 24 hours after illumination.
toplasty at the Affiliated Hospital of Zunyi Medical Uni-                CaTM-2/AM was dissolved in anhydrous DMSO to a
versity. All experiments adhered to the ethical standards          concentration of 4 mM in the dark and then diluted with
established by the unit’s Human Test Committee.                    HBSS to a final concentration of 8 μM, and F-127 with a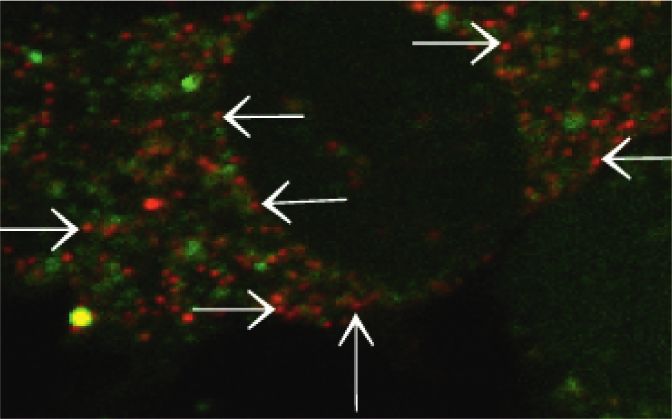
Journal of Ophthalmology                                                                                                     3

mass fraction of 20% was added. The CaTM-2/AM working            cell populations were assessed by flow cytometry. The
solution was added to the cells in the dark and the cells were   number of cells recorded in each experimental group was
incubated at 37°C for 40 min. Then, the cells were washed        ≥10000.
twice and incubated in HBSS at 37°C for another 20 min.
Then, a laser scanning confocal microscope was used to
                                                                 2.9. Image Process Analysis. For quantitative analysis of the
observe and take photos. The excitation wavelength was
                                                                 fluorescence of calcium, the experimental results of each part
561 nm. The fluorescence intensity indicated the number of
                                                                 were maintained at the same threshold by ImageJ, so as to
calcium ions, and ImageJ was used for the analysis.
                                                                 select the region of interest and analyze the average fluo-
                                                                 rescence intensity.
2.6. Calcium in Mitochondria. The cell groupings and pre-
treatment were the same as those described in Section 2.5.       2.10. Statistical Analysis. The results are expressed as the
Rhod-2/AM was dissolved in anhydrous DMSO to a con-              mean ± SD and were analyzed with SPSS 18.0 statistical
centration of 5 mM in the dark, HBSS was added to dilute the     software. One-way analysis of variance (ANOVA) followed
dye to a final concentration of 5 μM, and F-127 with a mass       by an LSD test was performed to compare differences for
fraction of 20% was added. The pretreated cells in each group    multiple groups. Differences were considered significant
were loaded with Rhod-2/AM working solution and incu-            when P < 0.05.
bated at 37°C for 30 min in the dark. Then, the cells were
washed twice with HBSS and left for a further 20 min at 37°C.
A laser scanning confocal microscope was used to observe
                                                                 3. Results
and take photos. The excitation wavelength was 561 nm.           3.1. Human RPE Cells and Immunohistochemistry.
ImageJ was used to analyze the fluorescence intensity, which      Primary human RPE cells adhered to the dish wall. After 3
represented the number of calcium ions.                          days in culture, the cells were spindle-shaped or polygonal,
                                                                 and the cytoplasm was enriched with brown-black particles.
2.7. Calcium in Lysosomes. The experimental groups and           Seven days later, the cells showed pseudopods, and trans-
pretreatment were the same as those described in Section         parent round nuclei appeared, some of which were binu-
2.5. Fluo-3/AM was dissolved in anhydrous DMSO in the            clear. As the number of passages increased, more RPE cells
dark at a concentration of 5 mM and diluted with HBSS to a       were spindles or irregular polygons, and the number of
final concentration of 10 μM; then, F-127 with a mass             pigment particles in the cytoplasm gradually decreased.
fraction of 20% was added. The pretreated cells were loaded      Immunofluorescence staining showed green fluorescence in
with Fluo-3/AM working solution and incubated at 37°C in         RPE cells, indicating expression of RPE65 (Figure 1).
the dark for 30 min. Then, the cells were washed with HBSS
twice and incubated at 37°C for 20 min to allow the              3.2. Calcium Levels in the Cytoplasm of RPE Cells. To in-
complete conversion of Fluo-3/AM to Fluo-3. Then, HBSS           vestigate the Ca2+ level in the cytoplasm, we measured the
was aspirated by pipette, and LysoTracker Red at a final          change in intensity of the Ca2+-sensitive dye CaTM-2/AM.
concentration of 20 nM was added to the cells in the dark        We found that the Ca2+ level in the control cells was lower
and left for a further 10 min at 37°C. Then, a laser confocal    than that in all the other treated cells (P < 0.05). The Ca2+
microscope was used to observe the cells after Fluo-3 was        level in the cells treated with BL + NFD was lower than that
stimulated at an excitation wavelength of 488 nm and             in the BL-treated cells (P < 0.05). The A2E and A2E + NFD-
LysoTracker Red was stimulated at an excitation wave-            treated cells showed a significant increase in the Ca2+ level
length of 561 nm. Lysosomal fluorescence and intracellular        compared with the BL-treated cells (P < 0.05). The Ca2+ level
calcium ion fluorescence were colocalized to detect calcium       in the A2E + BL and A2E + BL + NFD-treated cells was
in the lysosome, and the fluorescence intensity was used to       higher than that in the BL + NFD-treated cells (P < 0.05).
represent the calcium ion levels. ImageJ was used for            The Ca2+ level in the cells treated with A2E + BL was sig-
analysis.                                                        nificantly decreased compared with that in the A2E-treated
                                                                 cells (P < 0.05) (Figure 2).
2.8. Mitochondrial Membrane Potential. Fourth-generation
human RPE cells were divided into four groups: control-          3.3. Calcium Levels in the Mitochondria of RPE Cells. The
treated cells (control), blue light-treated cells (BL), A2E-     calcium in the mitochondria was labeled by Rhod-2/AM, an
treated cells (A2E), and A2E + blue-treated cells (A2E + BL).    indicator of Ca2+, and the fluorescence intensity was mea-
The concentration of A2E and the measurement parameters          sured using a laser scanning confocal microscope. The level of
in terms of time and intensity of light were the same as those   Ca2+ in the BL and BL + NFD-treated cells was significantly
described in Section 2.5.                                        increased compared with that of the control cells (P < 0.05),
    After pretreatment, the cells were digested with 0.25%       while a significant decrease was observed in the A2E + BL and
trypsin and the cell suspension was collected and centrifuged    A2E + BL + NFD-treated cells compared to the control cells
to remove the supernatant, followed by the addition of JC-1      (P < 0.05). The BL + NFD, A2E + BL, and A2E + BL + NFD-
dye (working concentration: 10 μg/mL, ultrapure water di-        treated cells presented a decreased levels of Ca2+ (P < 0.05)
lution), and the cells were incubated at 37°C for 20 min. The    compared to BL-treated cells. The Ca2+ level in the A2E + BL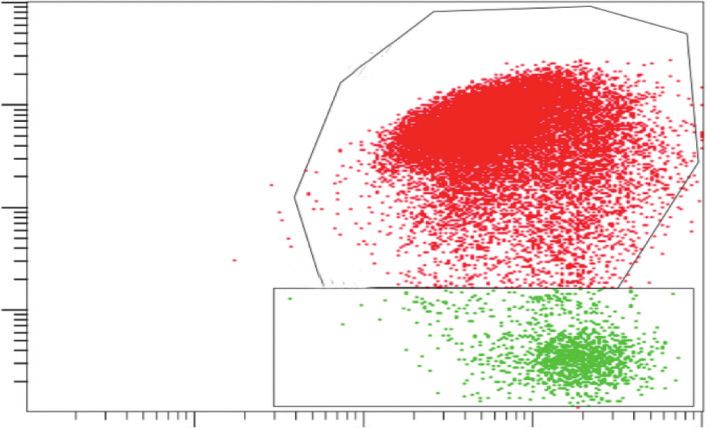
4 Journal of Ophthalmology
(a) (b)
(c) (d)
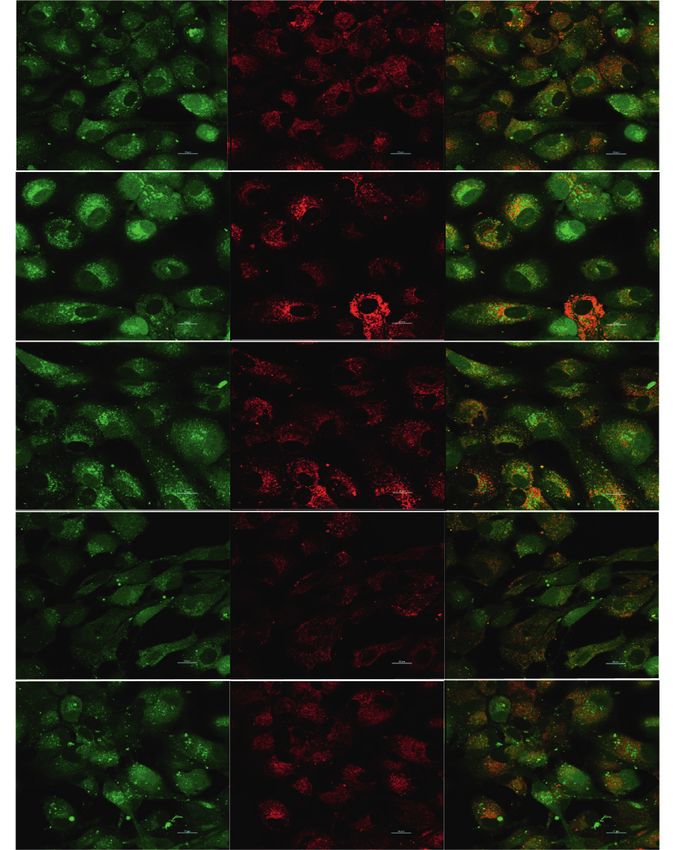
Figure 1: Human RPE cells and immunohistochemistry. (a) After being cultured for 3 days, primary human RPE cells were spindle-shaped
or polygonal and the cytoplasm was filled with pigment particles. (b) Seven days later, the cells were spindle-shaped or irregular, with round
and binuclear nuclei. (c) The third generation of human RPE cells had fewer pigment particles in the cytoplasm and presented as spindles or
irregular polygons. (d) Primary mouse anti-human RPE65 antibodies and secondary goat anti-mouse IgG antibodies were used to
immunostain third-generation RPE cells. Immunofluorescence staining was positive for RPE65.
and A2E + BL + NFD-treated cells was lower than that in the mitochondrial membrane potential is high, JC-1 accumu-
BL + NFD-treated cells (P < 0.05). The cells treated with lates in the mitochondrial matrix to form a polymer, which
A2E + BL + NFD exhibited an increased level of Ca2+ com- fluoresces red, and when the mitochondrial membrane
pared with the A2E-treated cells (P < 0.05) (Figure 3). potential is low, JC-1 remains a monomer, which fluoresces
green. Compared with those in the control (low ΔΨm,
1.07%), the BL (low ΔΨm, 5.37%), A2E (low ΔΨm, 3.00%),
3.4. Calcium Levels in the Lysosomes of RPE Cells. To de- and BL + A2E-treated (low ΔΨm, 16.00%) cells had a de-
termine the Ca2+ level in lysosomes, we performed Ca2+ im- creased mitochondrial membrane potential (P < 0.05)
aging with Fluo-3/AM and lysosomes with LysoTracker Red (Figure 5).
using laser confocal microscopy. With these colocalizing dyes,
the level of Ca2+ in the lysosomes can be analyzed. The ly- 4. Discussion
sosomes from BL and BL + NFD-treated cells showed an in-
crease in the Ca2+ level compared with that of the control cells AMD is a degenerative retinal disease that causes irreversible
(P < 0.05). Moreover, cells treated with A2E and A2E + NFD vision loss [13]. The etiology of AMD includes age, smoking,
exhibited a decreased level of Ca2+ when compared with the genetic factors, and chronic light damage, including that
control cell (P < 0.05). We also observed that the Ca2+ level in from sunlight [14, 15]. Among the wavelengths in the visible
the BL + NFD, A2E, and A2E + NFD-treated cells was signif- light spectrum, BL waves have a higher association with the
icantly decreased when compared with BL-treated cells induction of AMD, due to the increased levels of energy
(P < 0.05). Finally, the results revealed lower levels of Ca2+ in reaching the macula, inducing structural and functional
the A2E + BL and A2E + BL + NFD-treated cells than in the alterations in RPE cells, as well as retinal phototoxicity
BL + NFD-treated RPE (P < 0.05) and higher levels in cells [16, 17]. The accumulation of lipofuscin in the retinal pig-
treated with A2E + BL + NFD than A2E (P < 0.05) (Figure 4). ment epithelium is proportional to eye aging and is related to
various forms of retinal degeneration. In presence of irra-
diation, the ability of lipofuscin to produce superoxide
3.5. Mitochondrial Membrane Potential (ΔΨm). The de- radicals is significantly enhanced [18, 19]. Moreover, A2E,
crease in mitochondrial membrane potential is a notable the main fluorophore in lipofuscin, can upregulate the ex-
event in the early stages of apoptosis. When the pression of inflammatory factors and vascular endothelial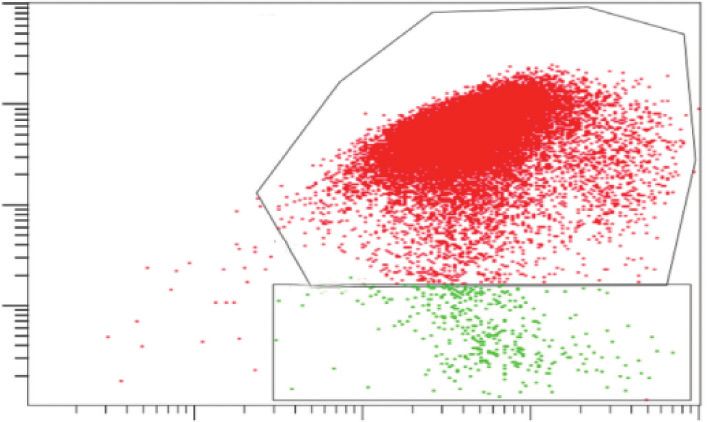
Journal of Ophthalmology                                                                                                                                      5

                                Control                                                      BL                            BL+NFD

                                                     A2E+BL                                              A2E+BL+NFD
                                                                                             (a)

                                                                            100
                                               Mean fluorescence intensity

                                                                             80
                                                     CaTM-2/AM

                                                                             60

                                                                             40

                                                                             20

                                                                             0
                                                                                  Control   BL BL+NFD A2E+ A2E+BL+
                                                                                                       BL    NFD

                                                                                             (b)

Figure 2: The level of calcium in the cytoplasm. (a) To investigate the Ca2+ level in the cytoplasm, we performed CaTM-2/AM staining. Our
data showed that blue light and A2E significantly elevated the cytoplasmic Ca2+ levels compared with those in the nontreated cells. Scale
bar � 20 μM. (b) Data are presented as the mean ± SD (n � 3). An LSD test following one-way ANOVA was performed for the statistical
analysis. ▲P < 0.05, compared with the controls; ★P < 0.05, compared with the BL group; ●P < 0.05, compared with the BL + NFD group;
and ◇P < 0.05, compared with the A2E group.

growth factor [20, 21]. Upon accumulation or light exposure,                                       NFD was added to the cells, the Ca2+ level in the cytoplasm
A2E can damage RPE cells [22]. When A2E is exposed to BL,                                          decreased, indicating that NFD can inhibit the influx of
it can be oxidized into peroxide-A2E and furan-A2E, which                                          extracellular Ca2+ and protect the cells. When cytosolic Ca2+
leads to oxidative stress, inflammatory response, as well as                                        levels increase, excess Ca2+ can bind to calcium-dependent
the apoptosis of RPE cells.                                                                        proteases, which in turn activates the downstream Bcl-2
     Ca2+, as a second messenger, controls many cellular                                           family and triggers the mitochondrial apoptosis pathway.
processes, including cell differentiation, signaling, prolifer-                                     After the cell is exposed to external stimuli, G protein-
ation, migration, and death [23, 24]. The cytoplasmic Ca2+                                         coupled receptors activate phospholipase C, which hydro-
concentration in the cell resting state is very low, approx-                                       lyzes membrane phosphatidylinositol 4,5-diphosphate
imately 10−7 mol/L [25]. In this study, the Ca2+ level in the                                      (PIP2) to IP3 and diacylglycerol (DAG). IP3R mediates the
cytoplasm increased after BL irradiation and increased                                             release of Ca2+ from the endoplasmic reticulum and can
further after A2E was added to the culture, before exposure                                        directly stimulate the mitochondrial absorption of Ca2+
to BL, indicating that A2E and BL have synergistic effects.                                         [27, 28], while PKC phosphorylates various proteins and
On the one hand, the activation of calcium channels by A2E                                         enzymes that can induce apoptosis [29].
and BL on the plasma membrane leads to extracellular Ca2+                                              Lysosomes are intracellular acid organelles and were
influx [6, 26], and on the other hand, inositol 1, 4, 5-tri-                                        recently shown to be the second-largest calcium reservoir
phosphate (IP3) receptors mediate the release of Ca2+ from                                         [30]. The endoplasmic reticulum is the main source of Ca2+
the endoplasmic reticulum, which increases the level of Ca2+                                       in lysosomes, and membrane contact sites found between
in the cytoplasm and directly stimulates mitochondrial Ca2+                                        the endoplasmic reticulum and lysosomes play a crucial role
uptake [27, 28]. When the L-type calcium channel blocker                                           in the lysosomal Ca2+ refilling [31, 32]. In this experiment,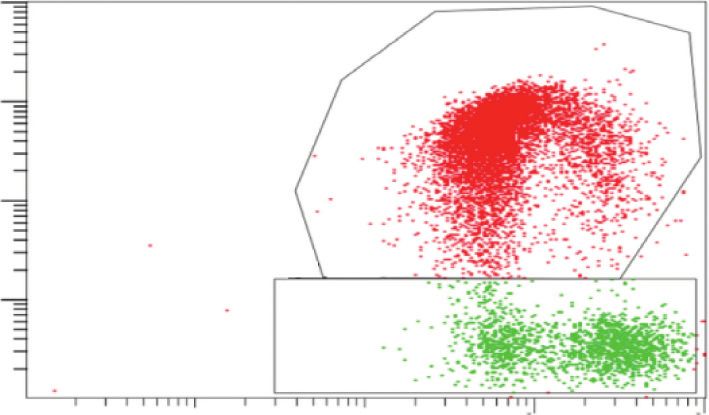
6                                                                                                                                         Journal of Ophthalmology

                                                                                                                              150

                                                                                                 Mean fluorescence intensity
                                                                                                                              100

                                                                                                       Rhod-2/AM
                                                                                                                               50

                                                                                                                               0
             Control                         BL                           BL+NFD                                                    Control   BL BL+NFD A2E+ A2E+BL+
                                                                                                                                                         BL    NFD

                           A2E+BL                       A2E+BL+NFD
                                             (a)                                                                                               (b)

Figure 3: The calcium level in mitochondria. (a) For the determination of Ca2+ levels in mitochondria, the fluorescence intensity of calcium
in RPE cells was assessed by confocal microscopy using the calcium-sensitive dye Rhod-2/AM. Scale bar � 20 μM. (b) Data are presented as
the mean ± SD (n � 3). An LSD test following one-way ANOVA was performed for the statistical analysis. ▲P < 0.05, compared with the
controls; ★P < 0.05, compared with the BL group; ●P < 0.0505, compared with the BL + NFD group; and ◇P < 0.05, compared with the A2E
group.

              A

              B

              C                                                                        →
                                                                                       →

                                                                                    → →→→
                                                                                 → → →     → → →
                                                                                    → →
                                                                                    →

                                                                                                                     →
                                                                                →
                                                                                 → →
                                                                                       →
                                                                                       →
                                                                                           →

              D

              E

            A: Control   B: BL   C: BL+NFD       D: A2E+BL     E: A2E+BL+NFD
                                           (a)                                                                                  (b)
                                                             Figure 4: Continued.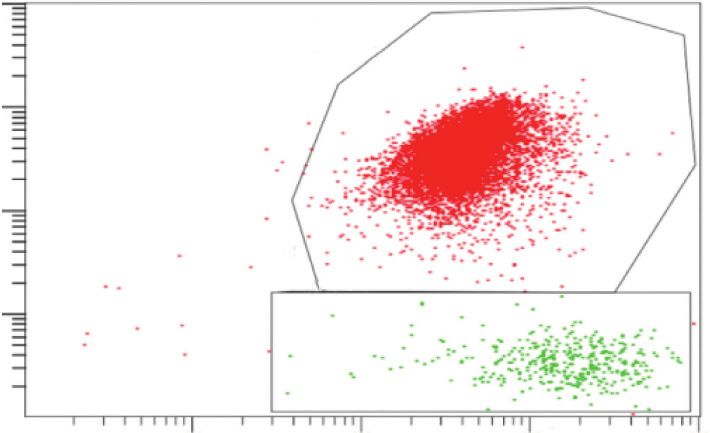
Journal of Ophthalmology                                                                                                                                                                7

                                               colocalization of Fluo-3/AM and Lysotracker red
                                                          Mean fluorescence intensity
                                                                                                 100

                                                                                                 50

                                                                                                  0
                                                                                                       Control   BL   BL+NFD A2E+ A2E+BL+
                                                                                                                              BL    NFD

                                                                                                                  (c)

Figure 4: The level of calcium in lysosomes. (a) The green fluorescence is the intracellular Ca2+ fluorescence labeled with Fluo-3/AM, the red
fluorescence is the lysosome labeled by LysoTracker Red, and the yellow fluorescence is the Ca2+ fluorescence in the lysosome after the two
fluorescence signals are colocalized. Scale bar � 20 μM. (b) The zoom of colocalization between Fluo-3/AM and LysoTracker Red-treated
cultured RPE cells. (c) Data are presented as the mean ± SD (n � 3). An LSD test was conducted following one-way ANOVA. Compared to
the control group, ▲P < 0.05; compared to the BL group, ★P < 0.05; compared to the BL + NFD group, ●P < 0.05; and compared to the A2E
group, ◇P < 0.05.

the level of Ca2+ in lysosomes increased after illumination,                                                                 Mitochondria and the endoplasmic reticulum are closely
which may be related to the enhanced Ca2+ release upon                                                                  connected and form dynamic platforms called mitochondrial-
endoplasmic reticulum stress; this phenomenon, in turn,                                                                 associated endoplasmic reticulum membranes (MAMs),
increases Ca2+ uptake by lysosomes to maintain intracellular                                                            which facilitate the transfer of Ca2+ from the endoplasmic
calcium homeostasis. To internalize Ca2+, lysosomes need to                                                             reticulum to mitochondria [38]. In this study, BL increased
overcome the pH gradient; however, much is unknown                                                                      the Ca2+ level in mitochondria, but exposure to light after A2E
about how lysosomes take up Ca2+, and there may be ly-                                                                  treatment led to a reduced Ca2+ level. This finding may be due
sosomal Ca2+ transporters similar to those in mitochondria.                                                             to the release of Ca2+ from the endoplasmic reticulum after BL
When the cells were loaded with A2E and then illuminated,                                                               irradiation, which increases the cytosolic Ca2+ level. The
the Ca2+ level in the lysosomes decreased. This phenomenon                                                              internalization of Ca2+ by mitochondria increases to prevent
may be attributed to A2E damaging the lysosomal mem-                                                                    an excessive increase in cytosolic Ca2+. In this case, the uptake
brane and leading to the leakage of Ca2+ from lysosomes.                                                                of Ca2+ by mitochondria is considered a defense mechanism
A2E is a photosensitizer that generates free radicals with                                                              that plays an important role in protecting cells [39]. However,
radiation, inducing a decrease in the lysosomal membrane                                                                when mitochondria are overloaded with Ca2+ to the point that
integrity, with consequent release of lysosomal molecules                                                               their own tolerance limits are exceeded, Ca2+ causes sub-
(including enzymes and Ca2+) into the cytoplasm. Thus, A2E                                                              stantial changes in mitochondrial function and irreversible
also increases the pH in lysosomes, which may hinder pH-                                                                damage, including defects to the mitochondrial electron
dependent activities and block Ca2+ uptake by lysosomes                                                                 transport chain (ETC), reduced ATP production, and in-
[9, 33].                                                                                                                creased ROS production [40]. Ca2+ and ROS are the most
    The mitochondrial membrane potential is necessary to                                                                important drivers inducing the opening of mitochondrial
synthesize ATP, and a decrease in membrane potential is a                                                               permeability transition pores (MPTPs). The opening of
characteristic event in early apoptosis [34]. Measurements                                                              MPTPs can cause the mitochondrial transmembrane po-
of the mitochondrial membrane potential in human RPE                                                                    tential to disappear, leading to the release of accumulated
cells revealed that both BL and A2E reduced the mito-                                                                   Ca2+, cytoplasmic Ca2+ overload, release of mitochondrial
chondrial membrane potential and had a synergistic ef-                                                                  proteins such as cytochrome C and AIF into the cytoplasm,
fect. RPE cells produce a large amount of ROS under BL                                                                  and the activation of caspase-9 and caspase-3, which induces
and A2E stress, and these ROS may damage the mito-                                                                      cell death [34, 41]. NFD can inhibit Ca2+ influx and attenuate
chondrial membrane structure, resulting in a decrease in                                                                the oxidative stress response.
membrane potential and mitochondrial dysfunction                                                                             The present study has several limitations. Since there are no
[35, 36]. In addition, it was described that 25 μM A2E-                                                                 simple A2E-treated cells, it is not possible to explore the effect
laden cells under both dark and light conditions exhibited                                                              of A2E alone on intracellular Ca2+ level. For the detection of
a fragmented mitochondrial network, a feature from                                                                      Ca2+ level in lysosomes, because the Ca2+ fluorescence probe in
dysfunctional mitochondria, which could ultimately                                                                      cells is sensitive to pH, other detection methods can be explored
trigger apoptotic cell death [37].                                                                                      in the later stage to obtain more accurate results.
8 Journal of Ophthalmology
103 103 B
B
98.8% 94.5%
102 102
FL3 INT LOG
FL3 INT LOG
101 101
C C
1.1% 5.3%
100 100
100 101 102 103 100 101 102 103
FL1 INT LOG FL1 INT LOG
Control BL
103 B 103
B
96.6%
83.9%
102 102
FL3 INT LOG
FL3 INT LOG
101 101
C C
3.2% 15.9%
100 100
100 101 102 103 100 101 102 103
FL1 INT LOG FL1 INT LOG
A2E A2E+BL
20
Percentage of cell with low
membrane potential (%)
15
10
5
0
Control BL A2E A2E+BL
Figure 5: Mitochondrial membrane potential. The mitochondrial membrane potential in the indicated groups was analyzed by flow
cytometry with JC-1-stained RPE cells. The decrease in the mitochondrial membrane potential was detected by the transition of JC-1 red
fluorescence (FL-3) to JC-1 green fluorescence (FL-1). Statistical analysis of RPE cells with low Δѱm (%) (the percentage of the cells in C).
Data are shown as the mean ± SD (n � 3). An LSD test following one-way ANOVA was performed. Compared to the control group,
▲P < 0.05; compared to the BL group, ★P < 0.05; compared to the BL + NFD group, ●P < 0.05; and compared to the A2E group, ◇P < 0.05.
5. Conclusion future to obtain more accurate results, which may help
elucidate human RPE cell apoptosis induced by blue light.
The present study reveals that upon blue light irradiation,
intracellular Ca2+ levels increase and the mitochondrial
membrane potential decreases. Our findings suggest that Abbreviations
mitochondria and lysosomes can internalize excessive cyto-
solic Ca2+ to prevent cell damage. However, when the cells A2E: N-Retinylidene-N-retinylethanolamine
were loaded with A2E and then exposed to light, due to the RPE: Retinal pigment epithelial
loss of membrane integrity, the Ca2+ and other molecules AMD: Age-related macular degeneration
involved in apoptosis are released from these organelles in- ROS: Reactive oxygen species.
ducing the activation of several pathways involved in cellular
death. In this process, both blue light and A2E can reduce the Data Availability
mitochondrial membrane potential, and they have a syner-
gistic effect. However, since intracellular calcium fluorescence The data that support the findings of this study are available
probes are sensitive to pH, other detection methods to from the corresponding author (Shan-Jun Cai) upon rea-
measure Ca2+ levels in lysosomes should be explored in the sonable request.Journal of Ophthalmology 9
Disclosure [10] G. Su, S. J. Cai, X. Gong, L. L. Wang, H. H. Li, and L. M. Wang,
“Establishment of a blue light damage model of human retinal
Mao-Mei Luo and Lin Chen are the co-first authors. pigment epithelial cells in vitro,” Genetics and Molecular
Research, vol. 15, 2016.
Conflicts of Interest [11] J. Feng, X. Chen, and X. Sun, “Expression of endoplasmic
reticulum stress markers GRP78 and CHOP induced by
The authors declare no conflicts of interest. oxidative stress in blue light-mediated damage of A2E-con-
taining retinal pigment epithelium cells,” Ophthalmic Re-
search, vol. 52, pp. 224–233, 2014.
Authors’ Contributions [12] B. Lu, P. Zhang, M. Zhou et al., “Involvement of XBP1s in blue
Mao-Mei Luo and Lin Chen contributed equally to this light-induced A2E-containing retinal pigment epithelium cell
death,” Ophthalmic Research, vol. 57, pp. 252–262, 2017.
work.
[13] J. Z. Nowak, “Oxidative stress, polyunsaturated fatty acids-
derived oxidation products and bisretinoids as potential in-
Acknowledgments ducers of CNS diseases: focus on age-related macular de-
generation,” Pharmacological Reports, vol. 65, pp. 288–304,
The authors thank the Cell Engineering Laboratory and 2013.
Anesthesia Laboratory of Zunyi Medical University and [14] G. Y. Sui, G. C. Liu, G. Y. Liu et al., “Is sunlight exposure a risk
Shanghai General Hospital (Shanghai First People’s Hos- factor for age-related macular degeneration? A systematic
pital) of Shanghai Jiaotong University for their supply of review and meta-analysis,” British Journal of Ophthalmology,
experimental reagents. This work was supported by grants vol. 97, pp. 389–394, 2013.
from the National Natural Science Foundation of China, [15] T. Schick, L. Ersoy, Y. T. Lechanteur et al., “History of sunlight
2017 (no. 81760174), and the Science and Technology In- exposure is a risk factor for age-related macular degenera-
novation Talent Team Project of Guizhou Province (no. tion,” Retina, vol. 36, pp. 787–790, 2016.
Qian Ke He Platform Talent [2018]5601). [16] M. A. Mainster and P. L. Turner, “Blue-blocking IOLs decrease
photoreception without providing significant photoprotection,”
Survey of Ophthalmology, vol. 55, pp. 272–289, 2010.
References [17] E. Loane, C. Kelliher, S. Beatty, and J. M. Nolan, “The rationale
[1] R. K. Crouch, Y. Koutalos, M. Kono, K. Schey, and and evidence base for a protective role of macular pigment in
Z. Ablonczy, “A2E and lipofuscin,” Progress in Molecular age-related maculopathy,” British Journal of Ophthalmology,
Biology and Translational Science, vol. 134, pp. 449–463, 2015. vol. 92, pp. 1163–1168, 2008.
[2] A. Höhn and T. Grune, “Lipofuscin: formation, effects and [18] M. Rózanowska, A. Pawlak, B. Rózanowski et al., “Age-related
role of macroautophagy,” Redox Biology, vol. 1, no. 1, changes in the photoreactivity of retinal lipofuscin granules:
pp. 140–144, 2013. role of chloroform-insoluble components,” Investigative
[3] H. Takeshima, E. Venturi, and R. Sitsapesan, “New and no- Ophthalmology & Visual Science, vol. 45, pp. 1052–1060, 2004.
table ion-channels in the sarcoplasmic/endoplasmic reticu- [19] E. R. Gaillard, S. J. Atherton, G. Eldred, and J. Dillon,
lum: do they support the process of intracellular “Photophysical studies on human retinal lipofuscin,” Pho-
Ca2+release?” The Journal of Physiology, vol. 593, no. 15, tochemistry and Photobiology, vol. 61, pp. 448–453, 1995.
pp. 3241–3251, 2015. [20] J. Blasiak, “Senescence in the pathogenesis of age-related
[4] B. R. Hammond, V. Sreenivasan, and R. Suryakumar, “The macular degeneration,” Cellular and Molecular Life Sciences,
effects of blue light-filtering intraocular lenses on the pro- vol. 77, pp. 789–805, 2020.
tection and function of the visual system,” Clinical Oph- [21] V. M. Parmar, T. Parmar, E. Arai, L. Perusek, and A. Maeda,
thalmology, vol. 13, pp. 2427–2438, 2019. “A2E-associated cell death and inflammation in retinal pig-
[5] M. Nita and A. Grzybowski, “The role of the reactive oxygen mented epithelial cells from human induced pluripotent stem
species and oxidative stress in the pathomechanism of the age- cells,” Stem Cell Research, vol. 27, pp. 95–104, 2018.
related ocular diseases and other pathologies of the anterior [22] S. M. Yoon, B. L. Lee, Y. R. Guo, and S. Y. Choung, “Pre-
and posterior eye segments in adults,” Oxidative Medicine and ventive effect of Vaccinium uliginosum L. extract and its
Cellular Longevity, vol. 2016, Article ID 3164734, 23 pages, fractions on age-related macular degeneration and its action
2016. mechanisms,” Archives of Pharmacal Research, vol. 39,
[6] F. A. Shamsi and M. Boulton, “Inhibition of RPE lysosomal pp. 21–32, 2016.
and antioxidant activity by the age pigment lipofuscin,” In- [23] Z. Y. Cheng, X. P. Wang, K. L. Schmid, X. G. Han, H. Song,
vestigative Ophthalmology & Visual Science, vol. 42, and X. Tang, “GABAAα1 and GABAAρ1 subunits are expressed
pp. 3041–3046, 2001. in cultured human RPE cells and GABAA receptor agents
[7] G. C. Brailoiu and E. Brailoiu, “Modulation of calcium entry modify the intracellular calcium concentration,” Molecular
by the endo-lysosomal system,” Advances in Experimental Vision, vol. 21, pp. 939–947, 2015.
Medicine & Biology, vol. 898, pp. 423–447, 2016. [24] B. Schwaller, “Cytosolic Ca2+ buffers,” Cold Spring Harbor
[8] M. Brini, T. Calı̀, D. Ottolini, and E. Carafoli, “The plasma Perspectives in Biology, vol. 2, no. 11, Article ID a004051, 2010.
membrane calcium pump in health and disease,” FEBS [25] A. Raffaello, C. Mammucari, G. Gherardi, and R. Rizzuto,
Journal, vol. 280, pp. 5385–5397, 2013. “Calcium at the center of cell signaling: interplay between
[9] C. I. López-Sanjurjo, S. C. Tovey, D. L. Prole, and endoplasmic reticulum, mitochondria, and lysosomes,”
C. W. Taylor, “Lysosomes shape Ins(1,4,5)P3-evoked Ca2+ Trends in Biochemical Sciences, vol. 41, pp. 1035–1049, 2016.
signals by selectively sequestering Ca2+ released from the [26] H. L. Roderick, M. J. Berridge, and M. D. Bootman, “Calcium-
endoplasmic reticulum,” Journal of Cell Science, vol. 126, induced calcium release,” Current Biology, vol. 13, p. 425,
pp. 289–300, 2013. 2003.10 Journal of Ophthalmology
[27] C. Cui, R. Merritt, L. Fu, and Z. Pan, “Targeting calcium
signaling in cancer therapy,” Acta Pharmaceutica Sinica B,
vol. 7, pp. 3–17, 2017.
[28] E. J. Dickson, B. H. Falkenburger, and B. Hille, “Quantitative
properties and receptor reserve of the IP(3) and calcium
branch of G(q)-coupled receptor signaling,” The Journal of
General Physiology, vol. 141, pp. 521–535, 2013.
[29] W. H. Xiong, J. J. Pang, M. E. Pennesi, R. M. Duvoisin,
S. M. Wu, and C. W. Morgans, “The effect of PKCα on the
light response of rod bipolar cells in the mouse retina,” In-
vestigative Ophthalmology & Visual Science, vol. 56,
pp. 4961–4974, 2015.
[30] H. Xu and D. Ren, “Lysosomal physiology,” Annual Review of
Physiology, vol. 77, pp. 57–80, 2015.
[31] B. S. Kilpatrick, E. R. Eden, A. H. Schapira, C. E. Futter, and
S. Patel, “Direct mobilisation of lysosomal Ca2+ triggers
complex Ca2+ signals,” Journal of Cell Science, vol. 126,
pp. 60–66, 2013.
[32] E. R. Eden, I. J. White, A. Tsapara, and C. E. Futter,
“Membrane contacts between endosomes and ER provide
sites for PTP1B-epidermal growth factor receptor interac-
tion,” Nature Cell Biology, vol. 12, pp. 267–272, 2010.
[33] M. Bermann, F. Schütt, F. G. Holz, and J. Kopitz, “Does A2E, a
retinoid component of lipofuscin and inhibitor of lysosomal
degradative functions, directly affect the activity of lysosomal
hydrolases?” Experimental Eye Research, vol. 72, pp. 191–195,
2001.
[34] X. Li, F. Fang, Y. Gao et al., “ROS induced by killerred tar-
geting mitochondria (mtKR) enhances apoptosis caused by
radiation via cyt c/caspase-3 pathway,” Oxidative Medicine
and Cellular Longevity, vol. 2019, Article ID 4528616,
11 pages, 2019.
[35] M. Mélanie, B. Karine, A. Claire et al., “Light action spectrum
on oxidative stress and mitochondrial damage in A2E-loaded
retinal pigment epithelium cells,” Cell Death & Disease, vol. 9,
p. 287, 2018.
[36] T. Nakanishi-Ueda, H. J. Majima, K. Watanabe et al., “Blue
LED light exposure develops intracellular reactive oxygen
species, lipid peroxidation, and subsequent cellular injuries in
cultured bovine retinal pigment epithelial cells,” Free Radical
Research, vol. 47, pp. 774–780, 2013.
[37] A. Agustina, G. L. Guadalupe, M. B. Juan et al., “Toxicity of
blue led light and A2E is associated to mitochondrial dy-
namics impairment in ARPE-19 cells: implications for age-
related macular degeneration,” Archives of Toxicology, vol. 93,
pp. 1401–1415, 2019.
[38] S. Missiroli, S. Patergnani, N. Caroccia et al., “Mitochondria-
associated membranes (MAMs) and inflammation,” Cell
Death & Disease, vol. 9, p. 329, 2018.
[39] B. Badone, C. Ronchi, M. C. Kotta et al., “Calmodulinopathy:
functional effects of CALM mutations and their relationship
with clinical phenotypes,” Frontiers in Cardiovascular Med-
icine, vol. 5, p. 176, 2018.
[40] A. Rimessi, M. Previati, F. Nigro, M. R. Wieckowski, and
P. Pinton, “Mitochondrial reactive oxygen species and in-
flammation: molecular mechanisms, diseases and promising
therapies,” The International Journal of Biochemistry & Cell
Biology, vol. 81, pp. 281–293, 2016.
[41] N. Tajeddine, “How do reactive oxygen species and calcium
trigger mitochondrial membrane permeabilisation?” Bio-
chimica et Biophysica Acta, vol. 1860, pp. 1079–1088, 2016.You can also read