Optimizing Electrolyte Additive Loadings in NMC532/Graphite Cells: Vinylene Carbonate and Ethylene Sulfate
←
→
Page content transcription
If your browser does not render page correctly, please read the page content below
Journal of The Electrochemical
Society

OPEN ACCESS

Optimizing Electrolyte Additive Loadings in NMC532/Graphite Cells:
Vinylene Carbonate and Ethylene Sulfate
To cite this article: T. Taskovic et al 2021 J. Electrochem. Soc. 168 010514

View the article online for updates and enhancements.

                                This content was downloaded from IP address 46.4.80.155 on 08/10/2021 at 07:01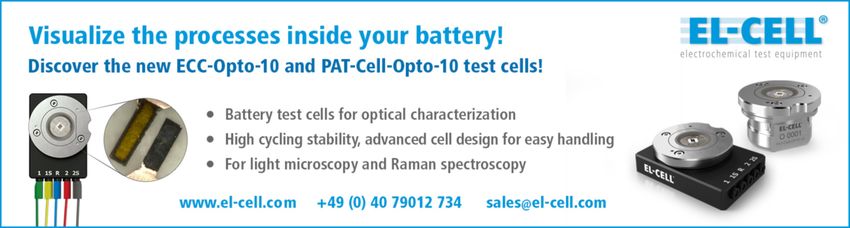
Journal of The Electrochemical Society, 2021 168 010514

                             Optimizing Electrolyte Additive Loadings in NMC532/Graphite
                             Cells: Vinylene Carbonate and Ethylene Sulfate
                             T. Taskovic,1 L. M. Thompson,1 A. Eldesoky,1 M. D. Lumsden,1 and J. R. Dahn1,2,z,*
                             1
                                 Department of Chemistry, Dalhousie University, Halifax B3H 4R2, Canada
                             2
                                 Department of Physics and Atmospheric Science, Dalhousie University, Halifax B3H 4R2, Canada

               A matrix of LiNi0.5Mn0.3Co0.2O2/graphite cells filled with 1.33 molal LiPF6 in EC:EMC:DMC (ethylene carbonate: ethyl methyl
               carbonate: dimethyl carbonate) (25:5:70 by volume) electrolyte and different weight percentages of vinylene carbonate (VC) and
               ethylene sulfate (DTD) electrolyte additives underwent prolonged charge-discharge cycling at 20 °C and 40 °C. The volume of gas
               produced during formation and cycle testing was measured. The impedance spectra of the cells before and after cycling was
               measured. After testing, the electrolyte was extracted for study by nuclear magnetic resonance spectroscopy (NMR) and gas
               chromatography/mass spectroscopy (GC-MS) to determine what changes in electrolyte composition had occurred. Some cells had
               their negative electrodes studied by scanning micro-X-ray fluorescence to quantify the amount of transition metals that transferred
               from the positive electrode to the negative electrode during the testing. Cells containing 1% VC or 2% VC with an additional 1%
               DTD by weight had the best capacity retention and lowest impedance growth. NMR and GC-MS suggest that these additive
               combinations promote increased electrolyte salt consumption which may represent a source of lithium to replenish the lithium
               inventory. Only a small amount of transition metals (0.03% or less) originating from the positive electrode active material was
               found on the negative electrode after testing. Most cells had over 1500 cycles at both 20 °C and 40 °C conditions.
               © 2021 The Author(s). Published on behalf of The Electrochemical Society by IOP Publishing Limited. This is an open access
               article distributed under the terms of the Creative Commons Attribution 4.0 License (CC BY, http://creativecommons.org/licenses/
               by/4.0/), which permits unrestricted reuse of the work in any medium, provided the original work is properly cited. [DOI: 10.1149/
               1945-7111/abd833]

               Manuscript submitted November 20, 2020; revised manuscript received December 18, 2020. Published January 11, 2021.
               Supplementary material for this article is available online

    Lithium-ion batteries are currently found in smartphones, wear-                    The 2% VC + 1% DTD additive combination is, for lack of a
able technology, power tools, grid energy storage applications, and                better word, “wonderful” in single crystal NMC532/graphite cells.14
vehicles.1,2 Improving the calendar and cycle lifetime of batteries                However, investigating a wide range of VC and DTD combinations
used in these applications is important to alleviate the need for                  is recommended in order to determine the optimal additive blend.
replacement.3 Modifying the negative electrode, positive electrode                 Studies of additive optimization are rare in the literature but in 2014,
and electrolyte in Li-ion cells can improve lifetime and energy                    Wang et al. studied several different combinations of the additives
density.4–6 Parasitic reactions that occur between the charged                     VC, DTD, tris(trimethylsilyl)phosphate (TTSP) and tris(trimethyl-
electrode materials and the electrolyte in Li-ion cells are known to               silyl)phosphite (TTSPi).20 The aim of Wang’s work was to see what
contribute to cell failure.7–9 Electrolyte oxidation at the positive               combination of additives produced cells with the longest lifetime.
electrode, reduction at the negative electrode, decomposition of                   Here we limit the consideration to only combinations of VC and
electrolyte salt(s), and transition metal dissolution from the positive            DTD because a significant amount of work is required to optimize
electrode are some examples of reactions that may lead to a change                 only a binary combination. In addition, several experiments on
in performance or ultimately to cell failure.10–13                                 cycled cells were undertaken to determine how the electrolyte
    Recently, Harlow et al. demonstrated that single crystal                       changed after testing and how that was affected by the VC and
NMC532/graphite cells with appropriate electrolyte additives could                 DTD content.
have exceptional lifetime.14 Some of those cells contained carbo-                      In addition to the cycling and electrochemical impedance results,
nate-based electrolytes with the additives vinylene carbonate (VC)                 this study introduces a novel electrolyte extraction method that
and ethylene sulphate (DTD), in a 2% VC +1% DTD weight percent                     allows quantitative organic and inorganic component analysis via
combination. This combination, initially discussed by Li et al.,                   nuclear magnetic spectroscopy (NMR) and gas-chromatography-
works synergistically to improve cell lifetime.5 VC is an additive                 mass spectrometry (GC-MS). These techniques were applied to cells
known to form a passivating film on the graphite electrode that is                  that were heavily cycled and showed correlations between changes
relatively thick, providing robust protection against lithium inven-               in the electrolyte compositions and additive content. Lastly, micro
tory loss and electrolyte consumption during cycling.15 One theory is              X-ray fluorescence spectroscopy (μXRF) was used to probe the
that VC in the presence of EC is sacrificially reduced to form the                  surface of the negative electrode after cycling to observe the degree
passivating film. Ushirogata and colleagues also found another                      of transition metal deposition. The results from the analytical
possible mechanism that VC may preferentially react with the EC                    techniques used in this study are compared with the cell performance
anion radical favoring the one-electron reduction of EC than the two,              results.
thus improving the initial SEI formation.16 Cells containing VC in
combination with other additives like DTD mitigate against im-                                                   Experimental
pedance growth seen in cells only containing VC.17 Cells only
                                                                                       Pouch cell specifications.—Dry Li(Ni0.5Mn0.3Co0.2)O2 (NMC532)/
containing DTD have been shown to have shorter lifetimes
                                                                                   graphite pouch cells (215 mAh at 4.3 V) arrived sealed from Li-FUN
compared to dual additive cells.18 DTD has been shown through
                                                                                   Technology (Xinma Industry Zone, Golden Dragon Road, Tianyuan
cyclic voltammetry that it is mechanistically similar to VC. Where
                                                                                   District, Zhuzhou City, Hunan Province, China, 412000). The positive
DTD is preferentially reduced over EC and its reduction products are
                                                                                   electrodes used single-crystal NMC532 (94% by weight), 4% con-
found to be incorporated into the SEI.19 It is still unclear what the
                                                                                   ducting diluents and 2% polyvinylidene fluoride (PVDF) binder.
mechanism(s) is when the VC and DTD are both present in a cell’s
                                                                                   The NMC532 particles were coated with a Ti-based coating. The
electrolyte.
                                                                                   negative electrode consisted of 95.4% artificial graphite (15–30 μm
                                                                                   particle size), 2% carbon black and 2.6% sodium carboxy methylcel-
  *Electrochemical Society Fellow.                                                 lulose (NaCMC)/styrene butadiene rubber (SBR) binder. The positive
  z
    E-mail: jeff.dahn@dal.ca                                                       and negative electrode single side loadings were 21.1 mg cm−2 and
Journal of The Electrochemical Society, 2021 168 010514

                                                                               Electrochemical impedance spectroscopy (EIS).—A Biologic
                                                                           VMP3 (Seyssient-Pariset, France) electrochemical test station per-
                                                                           formed the EIS tests. The measurements done on the cell were at
                                                                           (10.0 ± 0.1) °C in a controlled temperature box (Novonix, Bedford,
                                                                           N.S., Canada). Data were collected with ten points per decade from
                                                                           100 kHz to 10 mHz with a signal amplitude of 10 mV. The sum of
                                                                           charge transfer resistance (Rct) (both ion and electron) from the full
                                                                           cell is reported. This data is extracted from Nyquist plots as the total
                                                                           diameter from the “semi-circular” portion of the spectrum. An
                                                                           example for each additive blend is included in the supplementary
                                                                           section (S1 and S2 is available online at stacks.iop.org/JES/168/
                                                                           010514/mmedia).

                                                                               20 °C and 40 °C long term cycling.—Prepared cells were tested
                                                                           for long-term cycling following the same long-term cycling (Neware
                                                                           chargers were used) protocol described in Ma et al.,17 however, with
                                                                           only one upper cut-off potential (4.3 V). The tests were made at
                                                                           (20.0 ± 0.5) °C in a climate-controlled room or (40.0 ± 0.1) °C in a
                                                                           temperature-controlled box. Neware (Shenzhen, China) chargers
                                                                           were used for these tests.

                                                                               Ex-situ gas measurements.—The amount of gas produced in the
                                                                           cells during formation and cycling was measured using the
                                                                           Archimedes principle. The cells were at 3.8 V for the volume
                                                                           measurements. The procedure used is described in Aiken et al.22
Figure 1. Calculated Voltage profile of cells used in this study.
                                                                               Comment on electrolyte extraction.—Often, when trying to
11.5 mg cm−2, respectively. Before filling with the designed electro-       extract electrolyte from a heavily cycled pouch cell, the amount of
lytes, pouch cells were cut open and dried at 100 °C under vacuum for      electrolyte remaining, compared to that initially added, is severely
14 h to remove residual moisture. Figure 1 shows the voltage profile for    diminished. The cell is practically dry upon opening. However, long-
the cell type used in this study. The fits were done by dVdQ analysis.21    lived cells are some of the most valuable and analyzing their
                                                                           electrolytes is important in understanding the reason behind their
   Electrolyte.—All electrolytes were prepared to contain 1.33 m           longevity. This method was developed to ensure that the analysis
LiPF6 in EC:EMC:DMC 25:5:70 (by volume). The two additives                 would not be limited by extraction volume.
used in this study were VC and DTD. In total, eight electrolytes were
prepared by varying the combinations of VC and DTD by weight.                  Electrolyte extraction.—After cycling, cells were discharged to
1% VC, 1% VC + 1% DTD, 1% VC + 2% DTD, 1% VC + 3%                          2.5 V and moved into an Ar-filled glovebox.23 A small opening was
DTD were created along with the same DTD weight percentages                made in the pouch cell using scissors where 0.6 ml of acetonitrile
except with 2% VC.                                                         (Sigma, HPLC grade) was added using a syringe. (Acetonitrile can
                                                                           only be used in the cases where no Li plating is expected). The
   Cell filling.—Pouch cells were filled with 0.85 ml (∼1.0 g)               solvent was then massaged into the pouch cell to promote mixing.
electrolyte in an Ar-filled glove box and sealed with a pouch sealer        To prevent evaporation of the solvent-electrolyte mixture, the
(MSK-115A Vacuum Sealing Machine, MTI Instruments) at 170 °C               opening in the cells was sealed with atactic polypropylene using a
under vacuum at −90 kPa of pressure.                                       Mastercraft (Canadian Tire, Canada) dual-temperature glue gun.
                                                                           Cells were weighed after sealing, then stored upright in the Ar glove
    Cell formation.—After filling, sealed cells were held at 1.5 V for      box for 24 h to allow for thorough mixing of the electrolyte and
24 h at room temperature to ensure the full wetting of the electrodes.     solvent throughout the jellyroll. Before unsealing, cells were
The cells were then transferred to a 40 °C temperature-controlled          weighed again to verify that no mass loss occurred. Once reopened,
box to undergo formation. Cells were charged using a Maccor 4000           a 1 ml syringe was used to remove as much of the extract as
series charger to their upper cut-off voltage at C/20 then discharged      possible, normally between 0.5 and 0.8 ml.
at the same rate to 3.8 V. The cells were transferred back to an Ar-           To confirm that acetonitrile was not reacting with the electrolyte
filled glovebox, degassed and vacuum-sealed again in the same               or electrodes, a simple NMR experiment was performed. An NMR
manner previously described. Table I shows the average first cycle          technique reported by Schwenke et al. was used to see if acetonitrile
efficiencies for the cells created grouped by additive blend.               would dissolve any SEI (solid electrolyte interphase) components.24
                                                                           In this case, tests were performed using a single pouch cell that was
   Table I. Average first cycle efficiencies of cells used in this study     completely discharged after cycling and dismantled. The negative
   grouped by additive blend.                                              electrode pieces (from the same cell) were all washed with DMC 3
                                                                           times, then left to dry in a fumehood. After drying, they were
   Additive Used (215 mAh cells)         First Cycle Efficiency       σ     immersed in 0.5 ml acetonitrile or water for 30 min. Samples washed
                                                                           with water had a few drops of D2O added, and samples washed with
   1VC                                           0.86              0.03    acetonitrile had a few drops of d-acetonitrile for shimming. The
   1VC   + 1DTD                                  0.86              0.04    results of the 1H NMR experiment are in Fig. S2 and show that
   1VC   + 2DTD                                  0.85              0.03    acetonitrile does not dissolve any SEI components. It should be
   1VC   + 3DTD                                  0.86              0.04    noted that acetonitrile has high chemical and oxidative stability.25
   2VC                                           0.86              0.03        The cell electrolyte extraction method was also verified using 1H
   2VC   + 1DTD                                  0.87              0.04    NMR and 7Li NMR by comparing extracted electrolyte from a cell
   2VC   + 2DTD                                  0.88              0.03    held at 1.5 V for 24 h to that of a fresh sample. Table II shows that
   2VC   + 3DTD                                  0.884             0.001   no distinguishable differences between the measured original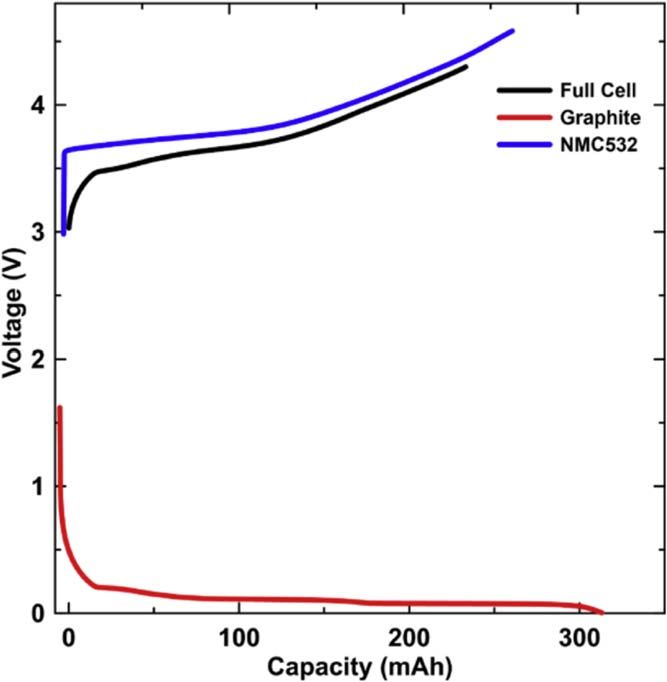
Journal of The Electrochemical Society, 2021 168 010514
Table II. Comparing the results from 1H and 7Li NMR between fresh electrolyte (1.4 m LiPF6 in EC:EMC:DMC (20:47:33 wt%) electrolyte) and the same composition extracted from a wetted cell.

                                 Li conc/m          σ          EC Conc/% total solvent         σ         EMC Conc/% total solvent          σ          DMC Conc/% total solvent          σ

Fresh Electrolyte n = 3            1.36           0.07                  20.7                 0.20                   47.4                  0.30                  32.0                   0.50
Extracted Electrolyte n = 2        1.368          0.003                 17.8                 0.30                  44.90                  0.14                  37.4                   0.50
Journal of The Electrochemical Society, 2021 168 010514
Table III. Showing the accuracy and precision of Li measurements using a sample of known LiPF6 concentration of 24.8 ± 0.3 mM prepared from a
1.35 m LiPF6 in EC:EMC (3:7 wt%) electrolyte by dilution.
Trial Li+ concentration in NMR sample reported by the spectrometer (mM) % Error from Expected
1 24.79 0.15
2 24.77 0.23
3 24.81 0.07
σ 0.02
Table IV. NMR sample containing 16.1 ± 0.3 mM LiPF6, internal standard (1,4-bis(trifluoromethyl)benzene), d-DMSO and acetonitrile. Tested once
a day over 4 d. Prepared from a 1.35 m LiPF6 in EC:EMC (3:7) electrolyte by dilution.
Day Li+ Concentration Result from NMR (mM) % Error from Expected
1 16.25 0.82
2 16.29 1.04
3 16.36 1.50
4 16.30 1.12
σ 0.05
electrolyte, and the sample obtained from the wetted cell, as well as Table V shows that 1H NMR and 19F NMR experiments on a
expected Li, EC, EMC and DMC concentrations at 95% confidence known sample found small differences between the measured and
level. No distinguishable difference in composition is seen between expected organic compound concentrations. These measurements
the two samples also no other products were observed in the were done consecutively.
extracted electrolyte sample. The same sample was also measured over four days to verify
instrument stability. Table VI shows that low variations were seen
NMR sample preparation.—The extracted electrolyte mixture over the 4-day period.
was added to a 10.00 ml glass volumetric flask containing 1.00 ml of
acetonitrile, 0.50 ml of deuterated acetonitrile (Sigma), and 0.20 ml GC-MS sample preparation.—The remaining extracted electro-
of 1,4 bis(trifluoromethyl)benzene (Sigma, internal standard) before lyte was removed from the Ar-filled glovebox for GC-MS analysis.
final dilution to 10.00 ml. 0.70 ml of the mixed solution was Potentially damaging lithium salt and HF was removed from the GC-
transferred to a Wilmad glass NMR tube (Wilmad 506-PP-8) and MS sample using a salt assisted liquid-liquid extraction (SALLE)
capped with a gas-tight Wilmad NMR cap (WG-3891-100). method.28 First, a 3.0 ml aliquot was transferred to a 15 ml
polypropylene vial with the addition of 0.4 ml of highly concentrated
NMR measurements.—A Bruker Avance 300 MHz spectrometer aqueous ammonium salt solution (∼3 M), capped and mixed for
was used to collect 7Li, 1H, and 19F NMR spectra. A pulse length- 30 s. The salt was added to ensure that no lithium was left in the
based concentration determination (Pulcon) method was used, organic layer. The tube was then centrifuged at 920 g at 12 °C for
allowing for an external standard to be used for quantitative 7Li 20 min to separate the organic and aqueous layers. Three drops of
analysis.26 For the 7Li NMR measurements, 16 scans were done with a the organic top layer were further diluted with ∼1.5 ml acetonitrile
pulse delay time of 2 s. The external standard used was of the same in a small, 1.5 ml GC vial.
composition described in Table IV. The Pulcon set up was done using Standard solutions were created to quantify and determine the
Bruker Topspin software 2.1.27 The Pulcon method was used for 7Li detection limits of degraded electrolyte components. A calibration
NMR measurements due to the difficulty in finding an internal standard solution with known amounts of EC, DMC, DEC, EMC, VC, DEOHC
that is inert to the lithium salt found in electrolytes. 1H NMR and 19F (diethyl-2,5-dioxahexane carboxylate) and DMOHC (dimethyl-2,5-
NMR experiments used the internal standard, 1,4-bis(trifluoromethyl) dioxahexane carboxylate) was added to a known amount of
benzene, for quantitative analysis. For purposes of quantification and acetonitrile.
based upon relaxation time (T1) measurements, the pulse delay time
was increased to 80 s for 1H NMR and 10 s for 19F NMR to ensure GC-MS sample measurements.—An Agilent 7890 gas chroma-
complete relaxation of the spins. The long relaxation times improve the tograph (Bruker BR-5MS, 30 m column) coupled to an Agilent
accuracy of the results. 1H NMR and 19F NMR spectra were collected, 5977b single-quadrupole mass spectrometer was used for organic
accumulating 16 and 32 scans, respectively. To avoid the risk of HF analysis. The carrier gas was helium (99.999%) at a constant flow of
etching of the glassware the samples were promptly removed from the 0.68 ml min−1. 1.5 ul of the sample was injected into the inlet
NMR tubes after the required tests were made. (260 °C, split ratio 100:1) then carried onto the column at 35 °C for
NMR samples of known composition and concentration went 5 min before ramping column temperature to 100 °C at 15 °C min−1,
through testing to verify the precision and accuracy of the measure- then to 240 °C at 30 °C min−1 where the oven was held for the
ments. Samples were prepared from 1.35 m LiPF6 in EC:EMC duration of the 20-minute run. Samples were ionized via electron
(3:7 wt%) and diluted using the above-mentioned compounds. impact in the mass spectrometer.
Consecutive 7Li NMR measurements of a known solution were Calibration standards were measured for each sample set. Each
accurate ( 0.98) from linearity.Journal of The Electrochemical Society, 2021 168 010514
Table V. Prepared extraction solution containing (16.2 ± 0.3) mM of LiPF6 in EC(66.3 ± 0.3 mM):EMC, internal standard (1,4-Bis(trifluoromethyl)
benzene), d-DMSO and acetonitrile. Prepared from a 1.35 m LiPF6 in EC:EMC (3:7 wt%) electrolyte by dilution.
PF6- concentration % Error from EC concentration reported % Error from
Trial Number reported by 19 F NMR (mM) expected by 1H NMR (mM) expected
1 16.8 3.5 65.5 1.2
2 16.6 2.3 69.7 5.1
3 16.6 2.2 64.7 2.5
σ 0.1 3.0
Table VI. NMR sample containing 16.2 ± 0.3 mM of LiPF6 in EC (66.3 ± 0.3 mM):EMC, internal standard (1,4-bis(trifluoromethyl)benzene),
d-DMSO and acetonitrile tested once a day over 4 days. Prepared from a 1.2 m LiPF6 in EC:EMC (3:7 wt%) electrolyte by dilution.
PF6- concentration
19
Day from F NMR measurements (mM) % Error from expected EC Concentration from 1H NMR (mM) % Error from expected
1 16.83 4.40 65.7 0.9
2 16.98 5.33 63.2 4.7
3 16.45 2.05 68.5 3.3
4 16.52 2.48 65.3 1.5
σ 0.3 2.2
Calculating salt concentrations.—To calculate LiPF6 concentra- lead to cycle lifetimes reaching over 2000 cycles with less than 20%
tions, quantitative results from NMR and semi-quantitative results capacity losses. At 40 °C, cells with 1% VC or 2% VC + 3% DTD
from GC-MS were combined. GC-MS can only report the concen- showed the largest capacity losses. At 20 °C, cells with 2% VC or
trations of analytes within the GC vial. Therefore, the ratios between 2% VC + 3% DTD had the largest capacity losses, which had the
known components are only used for analysis. First, GC-MS mass largest changes in ΔV during cycling. Cells containing high
ratios were used to determine the mol ratios of EC, EMC and DMC. amounts of VC and DTD (sum being 4% by weight or greater)
This was necessary as electrolyte systems for LIB’s often comprise displayed higher capacity losses than those with less additive. As
several organic carbonates with similar chemical structures varying expected, cells solely containing VC underperformed.29 The under-
even just by a single methyl group (i.e. methyl group on EMC vs performing cells had the commonality that their respective ΔV
DMC) and are difficult to distinguish with this NMR instrumenta- values increased during cycling, signifying an increase in internal
tion. The mass ratios from GC-MS are applied to the EC concentra- resistance.
tion (determined from 1H NMR) to determine the concentration of The best performing cells were those that contained 1% DTD
EMC and DMC. Using 19F NMR or 7Li NMR acquired spectra, the with either 1% VC or 2% VC at 20 °C and 40 °C. In Fig. 3, the
number of mols of the PF6- (d, −72.71 ppm) anion or Li+ cation are influence of the amount of DTD on capacity retention in a cell is
determined, respectively. The molality is then able to be calculated clearly demonstrated. Cells with 1% DTD had the best capacity
using moles of salt and total mass of solvent (uncertainty propagated retention at cycle 1700. Cells containing greater than 1% DTD had
appropriately). similar results to cells with only VC. This suggests that excess DTD
is not desirable. Madec et al. also showed that cells with only DTD
μXRF analysis of negative electrode after cycling.—μXRF have a similar fate.30 Li et al. also studied DTD without VC in Li/
calibrants for Ni. Mn and Co were prepared as previously graphite half cells and reached a similar conclusion that 1% DTD
described.23 The transition metal (TM) signal to known mass loading had the best cycling performance.19 DTD has been shown to be
ratio was determined at four different positions on the calibrant and beneficial to the formation of the SEI. DTD has been described to go
their average determined the signal count to mass ratio used to through a ring-opening reduction similar to EC, producing lithium
convert TM net counts from each sample to a mass loading in terms sulphite, ethylene gas and other lithium alkyl sulphites that are
of μg cm−2. The fractional error in the data was taken to be the same involved in the creation of a robust SEI.31 Computational work by
as the ratio of the standard deviation of the four calibration Ren et al.32 also describes how the energy barrier to this reductive
measurements divided by their average. Cells were discharged to ring-opening can be increased due to the presence of other co-
2.5 V and were cut open in a fume hood. The cell stack was unrolled solvents (EC, DMC and EMC) but lowered when VC is present. VC,
and allowed to dry completely before μXRF analysis. A portion of therefore, may act as a “catalyst” for DTD reduction, working
the negative electrode was cut and mounted on a flat polyacrylic synergistically as it also plays a role in the formation of a robust SEI.
plate with double-sided tape, which was placed on the μXRF stage. When DTD is in excess (over 1%, as it is in this work) cell
Sample scanning was carried out using a 45 μm step size with a performance suffers possibly due to an excess of DTD reduction
25 μm spot size, a scanning rate of 4.00 mm s−1 and a 200 μA tube products. Further work is needed to determine the fate of the
current in the range of 0 to 50 keV under vacuum (Journal of The Electrochemical Society, 2021 168 010514 Figure 2. Normalized discharge capacity (cycle 5) and voltage polarization (ΔV) vs cycle count results for the prepared cells. (a)–(d), show the results for the 20 °C cycling. (e)–(h), show the results for the 40 °C.
Journal of The Electrochemical Society, 2021 168 010514

                                                                           Figure 4. (a) Average volume of gas produced (ml) after formation.
                                                                           (b) Average volume change of cells (ml) after cycling for each electrolyte
                                                                           blend. Separated by temperature.

Figure 3. Normalized capacity at cycle 1700 (Q1700) taken from the
normalized capacity (Q5) data seen in Fig. 1 vs the percent amount of
DTD in the cell. Panel (a) shows results for 1VC cells. Panel (b) shows
results for 2VC, results are shown for both 20 °C and 40 °C cycling.

The excess gas is a result of the decomposition of DTD and most
likely this gas is ethylene. The cells with 2% VC had slightly less
gas production on average. There are no correlations between the
cycling results and the amount of gas produced during formation,
which was removed from the cells after formation by degassing.
Further analysis is needed to identify and quantify the various gasses     Figure 5. (a) EIS results for all cells after formation (red) and post-cycling.
formed after the initial cycle. Figure 4b shows the gas volumes of         Post-cycling results are differentiated, 20 °C cells are in green and 40 °C
cycled cells sorted by temperature. Overall, for all electrolyte blends,   cells are in blue. (b) The percent increase in ΔV over 1700 cycles for each
less gas was produced during cycling than during formation. More           cell type, separated by temperature.
gas is produced for the cells cycled at 40 °C compared to 20 °C
because increased temperature promotes the kinetics of parasitic           increase in ΔV per cycle which occurred during the testing in Fig. 2.
reactions. Cells containing 1% DTD and either 1% VC or 2% VC               There is little correlation between Figs. 5a and 5b which suggests the
show less gas production than the other additive combinations;             change in DC resistance of the cell is not dominated by changes in
however, this is more noticeable at 40 °C.                                 charge transfer resistance. All cells with 1% DTD and either 1 or 2%
    Figure 5a shows EIS results for the cells before and after cycling.    VC show very little increase in ΔV during testing at either 20 °C or
The graph displays the average Rct (Ω cm−2) measured for each cell         40 °C.
type. The results are further separated by cycling temperature.
Results for 20 °C are in green and for 40 °C in blue. Cells containing         NMR and GC-MS results.—Figure 6 shows the Li+ and PF6
DTD in most cases had lower Rct values on average after cycling            molality in the electrolytes of the cells displayed in Fig. 2 after
when compared to the results after formation. Cells without DTD            testing as measured by NMR No evidence of LiPO2F2 (lithium
saw Rct increase after cycling. Figure 5b shows the percentage             difluorophosphate) was seen in any of the samples measured. The
Journal of The Electrochemical Society, 2021 168 010514
Figure 6. The average calculated Li and PF−6 concentrations for each Figure 7. The ratio of EC:(EMC + DMC) (linear carbonates) found in cells
electrolyte blend. (A) Results are shown for cells cycled at 20 °C. (B) Results after cycling using GC-MS. (A) Results are shown for cells cycled at 20 °C.
are shown for cells cycled at 40 °C. (B) Results are shown for cells cycled at 40 °C.
black dotted line in each panel is the initial molality of the salt viscosity, potentially causing the cell to fail.36 More work is needed
(1.33 m). In most cases, the Li+ and PF6 − results are statistically the to properly understand the results in Fig. 5, specifically whether this
same due to the confidence intervals for the 19F NMR and 1H NMR salt consumption happened initially after the first few cycles or was
measurements. Both the 20 °C and 40 °C results show that there was continuing at a slow rate over the 2000 + cycles.
a significant decrease in salt molality during cycling for cells with Figure 7 shows the ratio of EC to EMC + DMC in these cells
1% DTD and either 1 or 2% VC. Salt consumption was more after the testing period. The results are further separated by
significant in the 40 °C cells than the 20 °C cycled cell, suggesting temperature, and the original ratio is denoted by the black dotted
that temperature may be promoting the kinetics of the reaction line. Most cells showed the consumption of linear carbonates over
causing the removal of Li+ ions. This is rather surprising given that EC, and cells with a higher percentage of DTD typically had a
these same cells were those with the best capacity retention and the greater EC to a linear carbonate ratio. No DEC or transesterification
smallest impedance growth. It is known that electrolyte oxidation products (like DMOHC and DEOHC) were detected by the GC-MS,
involving PF6− can remove Li+ ions from the electrolyte in order to as well as no VC or DTD. Overall, no major changes were found to
maintain charge neutrality.34 These removed lithium ions would then occur in the electrolytes of the cells analyzed. This speaks to the
contribute to the lithium inventory of the cell, hence increasing robustness of the electrolyte, being able to withstand a relatively
capacity. high charging rate and over 2000 cycles without major changes
If a cell contains 1 ml of electrolyte with 1.5 M LiPF6, then the observed in the electrolyte.
electrolyte contains 1.5 × 10⁻³ moles of Li+. Figure 6 suggests that
approximately 0.2 M of Li+ from the electrolyte could possibly be μXRF results.—The transition metal deposition on the negative
added to the inventory for the cells with 1% DTD. This would need electrode was examined using scanning μXRF. Figure 8 shows the
to occur via a redox process. The capacity of extra lithium would be results of the μXRF measurements for Ni, Co, and Mn for cells of
8 mAh corresponding to 3 × 10⁻⁴ moles of Li+. Figure 2 shows that each electrolyte type. The results are further separated by the cell
the fractional capacity retention for cells tested at 40 °C is improved cycling temperature. It is found that 0.01%–0.03% of the total
by about 0.05 between cells with 1% VC + 1% DTD or 2% VC + original amounts of transition metals in the positive electrode were
1% DTD compared to cells with 1% VC or cells with 2% VC. Since deposited onto the negative electrode from the samples tested. The
the cells have an initial capacity of 215 mAh, this 0.05 improvement levels of transition metals are in agreement with the levels reported
in fractional capacity retention corresponds to 11 mAh which is by Thompson et al. who included additives in their cells, and much
close to the 8 mAh that could be due to the inventory added from the lower than the levels reported by Gilbert et al. who did not include
loss of salt. This simple calculation does not prove that the loss of Li additives in their cells.23,37 The overall amount of transition metal
salt is the reason for the improved capacity retention of cells with deposition was higher for the 20 °C samples than the 40 °C samples.
VC + 1% DTD, but it is certainly very suggestive. It is possible that small amounts of lithium plating could be
This is not the first time that salt consumption has been correlated occurring in cells tested at 1C at 20 °C. Perhaps the plated lithium
to better cycling performance. In a completely different cell can undergo ion exchange effectively with dissolved transition
chemistry, Weber et al. showed that consumption of LiDFOB in metals as xLi + Mx+ → xLi+ + M, hence leading to higher
“anode-free” NMC532 cells led to vastly improved Li plating and amounts of transition metals on the negative electrode in cells tested
stripping and a corresponding increase in cycle life.35 When the at 20 °C. However, if no Li plating is present M can still be
LiDFOB was consumed, the cells rapidly failed. In the NMC532/ deposited onto the graphite surface due to the low potential of the
graphite cells studied here, continued consumption of the salt in the negative electrode. In most samples, Co and Mn comprised most of
electrolyte will result in significant changes to the conductivity and the transition metal dissolution. Ni concentrations were small,Journal of The Electrochemical Society, 2021 168 010514
determine which combination of the two additives yielded cells with
the least amount of capacity fade and lowest internal resistance
changes. Quantitative analysis of the electrolytes after cycling
determined the composition changes. Finally, the transition metal
loading on the negative electrode was measured.
At both 20 °C and 40 °C, the cells with the additives 1% VC +
1% DTD and 2% VC + 1% DTD showed the best capacity retention.
Most of the cells attained over 2000 cycles with the best performing
cells showing no indication of imminent failure. EIS measurements
showed that cells with DTD had lower charge transfer impedance
after cycling than cells without DTD. The additive choice, 1% VC
+1% DTD would be a good option for an application that favours
lower impedance. It was also shown that the more DTD added to a
cell, the more gas would be produced during formation. Cells with
1% VC or 2%VC + 3%DTD had some of the worst cycling
performances and also the largest volumes of gas produced during
formation. During cycling these cells produced volumes of gas only
slightly larger than that of the best performing cells.
NMR results suggested that the cells containing 1% DTD had
more significant salt consumption from the electrolyte than cells
without or with more than 1% DTD. This was surprising as these
cells had the best performance. We suggest that this salt loss may
add Li to the cycling inventory but further work will need to be done
to verify the mechanism. Future work will include probing the SEI
of this particular additive combination using NMR techniques as
developed by Schwenke et al.24 Also, qualitative and quantitative
gas analysis from cycled cells will be done to understand the
relationship between the additive combination and gas production.
GC-MS work showed no transesterification by-products or other
post-cycling products. The EC to linear carbonate ratio increased
when compared to the original electrolyte suggesting the consump-
tion of linear carbonates during the long term cycling. In most cases,
change in the EC:linear carbonate ratio was more significant for cells
containing more than a total of 3% of the additives. Since no other
products were seen (at the sensitivity of the instruments used), it is
assumed the reacted solvent and salt contributed to the SEI
formation at one or both electrodes. This is opposite to what is
seen in the literature where studies of the thermal and electroche-
mical degradation of electrolytes produced several decomposition
products.9,38,39 However, these papers studied electrolyte systems
without any additives, showing the importance of additives to
electrolyte stability.
Transition metals transferred to the negative from the positive
electrode represented 0.03% or less of the original transition metals
Figure 8. μXRF results of negative electrode pieces for each electrolyte
blend. Results are reported for Ni, Mn and Co. (A) Result shown for cells
in the positive electrode. Cells cycled at 20 °C had a higher loading
cycled at 20 °C. (B) Results are shown for cells cycled at 40 °C. of transition metal on the negative electrode surface compared to the
40 °C cells. The reason behind this is unclear and warrants further
investigation. Due to the limited amount of transition metal
especially at 40 °C. For the 20 °C measurements, the VC only samples transferred to the negative electrode, it is unlikely that transition
had the highest Mn concentrations compared to the other samples metal dissolution contributed significantly to the capacity loss seen.
containing DTD. However, this observation does not replicate in the
40 °C samples, where the 1% VC sample was very similar to the other Acknowledgments
DTD samples. If one only looks at the 20 °C samples, the presence of The authors thank NSERC and Tesla Canada under the auspices
DTD may somehow prevent transition metal dissolution. Again, this of the Industrial Research Chair Program for financial support. TT,
observation is not seen for the 40 °C samples. LT and AE thank the Nova Scotia Graduate Scholarship program for
When comparing the μXRF results in Fig. 8 to the cycling results financial support. TT and AE thank NSERC for scholarship support.
seen in Fig. 2, the capacity fade seen does not correlate well with the
amount of transition metal dissolution. The capacity fade is caused ORCID
by a different mechanism. Harlow et al. showed that for cells of the
same chemistry as those considered here tested at 40 °C, the major J. R. Dahn https://orcid.org/0000-0002-6997-2436
contributors to the capacity loss were lithium inventory loss and References
impedance growth.14
1. G. E. Blomgren, “The development and future of lithium ion batteries.”
Conclusions J. Electrochem. Soc., 164, A5019 (2017).
2. J. B. Goodenough and M. H. Braga, “Batteries for electric road vehicles.” Dalt.
NMC532/graphite cells made with a variety of combinations of Trans., 47, 645 (2017).
3. X. Zeng, J. Li, and N. Singh, “Recycling of spent lithium-ion battery: a critical
the electrolyte additives VC and DTD went through a prolonged review.” Crit. Rev. Environ. Sci. Technol., 44, 1129 (2014).
charging/discharging protocol at 1C between 3.0 V to 4.3 V at both 4. W. Li, B. Song, and A. Manthiram, “High-voltage positive electrode materials for
20 and 40 °C. This allowed for a thorough screening of the cells to lithium-ion batteries.” Chem. Soc. Rev., 46, 3006 (2017).Journal of The Electrochemical Society, 2021 168 010514
5. J. Li, H. Li, W. Stone, S. Glazier, and J. R. Dahn, “Development of electrolytes for 23. L. M. Thompson, W. Stone, A. Eldesoky, N. K. Smith, C. R. M. McFarlane,
single crystal NMC532/artificial graphite cells with long lifetime.” J. Electrochem. J. S. Kim, M. B. Johnson, R. Petibon, and J. R. Dahn, “Quantifying changes to the
Soc., 165, A626 (2018). electrolyte and negative electrode in aged NMC532/graphite Lithium-ion cells.”
6. D. L. Wood, J. Li, and C. Daniel, “Prospects for reducing the processing cost of J. Electrochem. Soc., 165, A2732 (2018).
lithium ion batteries.” J. Power Sources, 275, 234 (2015). 24. K. U. Schwenke, S. Solchenbach, J. Demeaux, B. L. Lucht, and H. A. Gasteiger,
7. M. Woody, M. Arbabzadeh, G. M. Lewis, G. A. Keoleian, and A. Stefanopoulou, “The impact of CO2 evolved from VC and FEC during formation of graphite anodes
“Strategies to limit degradation and maximize li-ion battery service lifetime—critical in lithium-ion batteries.” J. Electrochem. Soc., 166, A2035 (2019).
review and guidance for stakeholders.” J. Energy Storage, 28, 101231 (2020). 25. Y. Yamada, K. Furukawa, K. Sodeyama, K. Kikuchi, M. Yaegashi, Y. Tateyama,
8. K. Xu, “Electrolytes and interphases in Li-ion batteries and beyond.” Chem. Rev., and A. Yamada, “Unusual stability of acetonitrile-based superconcentrated electro-
114, 11503 (2014). lytes for fast-charging lithium-ion batteries.” J. Am. Chem. Soc., 136, 5039 (2014).
9. J. Henschel, F. Horsthemke, Y. Philipp Stenzel, M. Evertz, S. Girod, C. Lürenbaum, 26. G. Wider and L. Dreier, “Measuring protein concentrations by NMR spectroscopy.”
S. Wiemers-Meyer, M. Winter, and S. Nowak, “ Lithium ion battery electrolyte J. Am. Chem. Soc., 128, 2571 (2006).
degradation of field-tested electric vehicle battery cells-a comprehensive analytical 27. L. Dreier and G. Wider, “Concentration measurements by PULCON using
study.” J. Power Sources, 447, 227370 (2020). X-Filtered or 2D NMR spectra.” Magn. Reson. Chem., 44, 206 (2006).
10. C. R. Birkl, M. R. Roberts, E. McTurk, P. G. Bruce, and D. A. Howey, 28. I. M. Valente, L. Moreira, G. Alves, and J. A. Rodrigues, “Another glimpse over the
“Degradation diagnostics for lithium ion cells.” J. Power Sources, 341, 373 (2017). salting-out assisted liquid-liquid extraction in acetonitrile/water mixtures.”
11. O. C. Harris, S. E. Lee, C. Lees, and M. Tang, “Review: mechanisms and J. Chromatogr. A, 1308, 58 (2013).
consequences of chemical cross-talk in advanced Li-ion batteries.” J. Phys Energy, 29. J. Li, A. R. Cameron, H. Li, S. Glazier, D. Xiong, M. Chatzidakis, J. Allen,
2032002 (2020). G. A. Botton, and J. R. Dahn, “Comparison of single crystal and polycrystalline
12. R. P. Day, J. Xia, R. Petibon, J. Rucska, H. Wang, A. T. B. Wright, and J. R. Dahn, LiNi0.5Mn0.3Co0.2 O2 positive electrode materials for high voltage Li-ion cells.”
“Differential thermal analysis of li-ion cells as an effective probe of liquid J. Electrochem. Soc., 164, A1534 (2017).
electrolyte evolution during aging.” J. Electrochem. Soc., 162, A2577 (2015). 30. L. Madec, J. Xia, R. Petibon, K. J. Nelson, J. P. Sun, I. G. Hill, and J. R. Dahn,
13. M. Stich, M. Gö, M. Kurniawan, U. Schmidt, and A. Bund, “Hydrolysis of LiPF6 in “Effect of sulfate electrolyte additives on LiNi1/3Mn1/3Co1/3O2/graphite pouch
Carbonate-Based Electrolytes for Lithium-Ion Batteries and in Aqueous Media.” cell lifetime: correlation between Xps surface studies and electrochemical test
J. Phys.Chem, 122, 8836 (2018). results.” J. Phys. Chem. C, 118, 29608 (2014).
14. J. E. Harlow et al., “A wide range of testing results on an excellent lithium-ion cell 31. L. D. Ellis, J. P. Allen, L. M. Thompson, J. E. Harlow, W. J. Stone, I. G. Hill, and
chemistry to be used as benchmarks for new battery technologies.” J. Electrochem. J. R. Dahn, “Quantifying, understanding and evaluating the effects of gas
Soc., 166, A3031 (2019). consumption in Lithium-ion cells.” J. Electrochem. Soc., 164, 3518 (2017).
15. Y. Qian et al., “How electrolyte additives work in Li-ion batteries.” Energy Storage 32. F. Ren, W. Zuo, X. Yang, M. Lin, L. Xu, W. Zhao, S. Zheng, and Y. Yang,
Mater., 20, 208 (2019). “Comprehensive understanding of reduction mechanisms of ethylene sulfite in EC-
16. K. Ushirogata, K. Sodeyama, Y. Okuno, and Y. Tateyama, “Additive Effect on based Lithium-ion batteries.” J. Phys. Chem. C, 123, 5871 (2019).
Reductive Decomposition and Binding of Carbonate-Based Solvent toward Solid 33. Z. Wu, S. Li, Y. Zheng, Z. Zhang, E. Umesh, B. Zheng, X. Zheng, and Y. Yang,
Electrolyte Interphase Formation in Lithium-Ion Battery..” J.Am. Chem. Soc, 135, “The roles of sulfur-containing additives and their working mechanism on the
11967 (2013). temperature-dependent performances of li-ion batteries.” J. Electrochem. Soc., 165,
17. X. Ma, J. E. Harlow, J. Li, L. Ma, D. S. Hall, S. Buteau, M. Genovese, M. Cormier, A2792 (2018).
and J. R. Dahn, “Hindering rollover failure of Li[Ni0.5Mn0.3Co0.2]O2/graphite 34. A. J. Smith, J. C. Burns, D. Xiong, and J. R. Dahn, “Interpreting high precision
pouch cells during long-term cycling.” J. Electrochem. Soc., 166, A711 (2019). coulometry results on li-ion cells.” J. Electrochem. Soc., 158, 1136 (2011).
18. J. Li, H. Li, W. Stone, S. Glazier, and J. R. Dahn, “Development of electrolytes for 35. R. Weber, M. Genovese, A. J. Louli, S. Hames, C. Martin, I. G. Hill, and
single crystal NMC532/artificial graphite cells with long lifetime.” J. Electrochem. J. R. Dahn, “Long cycle life and dendrite-free lithium morphology in anode-free
Soc., 165, A626 (2018). lithium pouch cells enabled by a dual-salt liquid electrolyte.” Nat. Energy, 4, 683
19. X. Li, Z. Yin, X. Li, and C. Wang, “Ethylene sulfate as film formation additive to (2019).
improve the compatibility of graphite electrode for Lithium-ion battery.” Ionics 36. E. R. Logan, E. M. Tonita, K. L. Gering, and J. R. Dahn, “A critical evaluation of
(Kiel)., 20, 795 (2014). the advanced electrolyte model.” J. Electrochem. Soc., 165, A3350 (2018).
20. D. Y. Wang and J. R. Dahn, “a high precision study of electrolyte additive 37. J. A. Gilbert, I. A. Shkrob, and D. P. Abraham, “Transition metal dissolution, ion
combinations containing vinylene carbonate, ethylene sulfate, tris(Trimethylsilyl) migration, electrocatalytic reduction and capacity loss in Lithium-ion full cells.”
phosphate and tris(trimethylsilyl) phosphite in Li[Ni1/3Mn1/3Co1/3]O2 /graphite J. Electrochem. Soc., 164, A389 (2017).
pouch cells.” J. Electrochem. Soc., 161, A1890 (2014). 38. J. Henschel, J. Luca Schwarz, F. Glorius, M. Winter, and S. Nowak, “ Further
21. H. M. Dahn, A. J. Smith, J. C. Burns, D. A. Stevens, and J. R. Dahn, “User-friendly insights into structural diversity of phosphorus-based decomposition products in
differential voltage analysis freeware for the analysis of degradation mechanisms in lithium ion battery electrolytes via liquid chromatographic techniques hyphenated
Li-ion batteries.” J. Electrochem. Soc., 159, A1405 (2012). to ion trap-time-of-flight mass spectrometry.” Anal. Chem., 91, 11 (2019).
22. C. P. Aiken, J. Xia, D. Y. Wang, D. A. Stevens, S. Trussler, and J. R. Dahn, “An 39. R. Sahore, F. Dogan, and I. D. Bloom, “Identification of electrolyte-soluble organic
apparatus for the study of in situ gas evolution in Li-ion pouch cells.” cross-talk species in a Lithium-ion battery via a two-compartment cell.” Chem.
J. Electrochem. Soc., 161, A1548 (2014). Mater., 31, 2884 (2019).You can also read