50 Years of Antarctic Research Expeditions by the Geographical Survey Institute Planning Department, Geodetic Department, and Topographic Department
←
→
Page content transcription
If your browser does not render page correctly, please read the page content below
50 Years of Antarctic Research Expeditions by the Geographical Survey Institute                     1

      50 Years of Antarctic Research Expeditions by the Geographical Survey Institute

          Planning Department, Geodetic Department, and Topographic Department

                                                             Abstract

       The Japanese Antarctic Research Expedition (JARE) started in conjunction with the International
Geophysical Year (IGY) research program implemented from July 1957 to December 1958. From the first
Japanese Antarctic Research Expedition (JARE-1) in 1956 to the latest one, JARE-48, the Geographical Survey
Institute (GSI) has dispatched a total of 83 survey engineers to conduct geodetic surveys and take aerial
photographs for preparing maps of Antarctica. This report summarizes the changes of surveying and mapping
technology, and the achievements during the 50 years’ history.

1. Introduction                                                       phenomena, and GSI published the survey results in
       The Japanese Antarctic Research Expedition                     order to build a foundation on which future expeditions
(JARE) started in conjunction with the third International            could expand their research fields. With the development
Polar Year (IPY) in which the survey coverage area                    of survey technology, GSI set up continuous Global
established by the International Geophysical Year (IGY)               Positioning System (GPS) observation stations including
research program was expanded to the whole globe.                     Syowa Station in order to conduct highly precise observation
       On November 8, 1956, 53 people from the 1st                    on such subjects as crustal movement, post-glacial rebound
Japanese Antarctic Research Expedition (JARE-1) left                  (upheaval of the Earth’s crust due to glacial retreat), and
Tokyo aboard the Soya and took their first step on                    performed on absolute gravity measurements for further
Antarctica on January 29, 1957. In the fall of 2006,                  analysis of geophysical phenomena. In response to the
JARE celebrated its 50th anniversary and marked its                   recommendation from the Scientific Committee on Antarctic
tremendous achievements including the discovery of the                Research, we also engaged in control point surveys for
ozone hole, analysis of aurora generation mechanism,                  transition from the old geodetic datum based on
analysis of 320,000 years of climate change from ice                  astronomical surveys to the Geodetic geodetic datum.
cores, and so on.                                                               In this report, the achievements during the 50
       GSI has dispatched 83 survey engineers in total                years’ history and the changes of surveying and mapping
for the last 50 years, at least one engineer dispatched               technology, are described.
to every JARE.
       During the Antarctic expeditions, GSI has                      2. History from the initiation of Antarctic expeditions
conducted control point surveys and taken aerial                         to the present
photographs for preparation of maps, and undertaken                   2.1 IGY and IPY
gravity and geomagnetic surveys. The achievements                               Geophysical research started with a year-long
include preparation of topographic maps and satellite                 international joint expedition in 1882, the first IPY.
image maps of the area of the Prince Olav Coast to the                Twelve countries, including Japan, participated in the
east, the Sor Rondane Mountains to the west, and the                  expedition during which 34 observatories at mid-latitude
Yamato Mountain Range to the south as well as Syowa                   areas and 14 observatories at the North and South Poles
Station and its vicinity, impossible to attain before                 were built in order to conduct observations mainly on
landing on Antarctica.                                                meteorology, ocean phenomena, terrestrial magnetism
       In addition, GSI has conducted geophysical                     and aurora. Fifty years later, the second IPY was held
observations for analysis of landforms and geophysical                and 44 countries conducted geophysical research on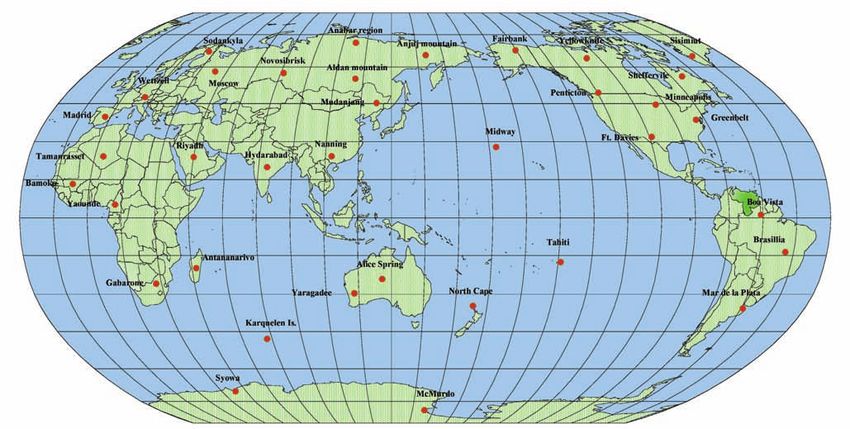
2                                    Bulletin of the Geographical Survey Institute, Vol.54 March, 2007

a global scale. Emphasis was placed on the Arctic                                 Japan was assigned with observation in the
for the research surveys, and thus no surveys were                      vicinity of 35°E where the Prince Harald Coast lies. The
conducted in the interior of Antarctica. However, surveys               6th Expedition of Christiansen of Norway mapped this
were conducted on neighboring islands of Antarctica                     area at a scale of 1:250,000 using oblique aerial
including South Georgia Island and Kerguelen Island. In                 photographs in 1937 and the 68th Mechanized Unit of
1951, the International Council for Scientific Union                    the U.S. Navy took aerial photographs of this area
(ICSU, now the International Council for Science)                       between 1946 and 1947. However, ground survey was
adopted a resolution to hold the IGY from 1957 to 1958,                 not conducted, and thus the shape of the Prince Olav
25 years after the second IPY. It was decided that 12                   Coast beyond 40°E was not clarified. As an immediate
fields would be covered: aurora, airglow (night airglow),               task, the expedition was to determine the longitude and
cosmic rays, geomagnetism, glaciers, gravity, ionosphere                latitude of the area. The second task was to take aerial
physics, longitude and latitude determinations (precision               photographs for advance research on land shape and ice
mapping), meteorology, oceanography, seismology and                     conditions of the area to be covered by the expedition.
solar activity. This IGY was positioned as the third IPY,                         Starting with the astronomical survey at Syowa
and expeditions to inland Antarctica made a formal start.               Station in January 1957, various surveys were continued
Japan, Argentina, Australia, Belgium, Chile, France,                    even after the close of the IGY and ended with the aerial
New Zealand, Norway, Union of South Africa, Union of                    photography conducted on JARE-6 in January 1962.
Soviet Socialist, United Kingdom of Great Britain and                   During this period, 29 control points including
Northern Ireland, and United States of America were the                 astronomical points were established, and the total
twelve countries that built a scientific station in Antarctica.         distance covered by vertical photographs reached 1,700
Thus, IGY’s global expedition under international                       km. Thus, it became possible to prepare small-scale
collaboration that started on July 1, 1957 and ended on                 maps of the coastal area between 38°E and 45°E. The
December 31, 1958 was initiated for global expeditions                  use of aerial photographs for preparation of maps was
including Antarctica.                                                   demonstrated on this expedition before it was practically
        With the closing of the IGY in 1959, discussions                introduced for domestic works.
ensued on the importance of continuing expeditions in                             In the meantime, JARE-2 (1957) and later
many fields in polar science except expeditions to mid-                 expeditions conducted gravity surveys at the ports of call
and low-latitude regions, and it was decided that the                   for the expedition ship on the way to and from Antarctica,
Special Committee on Antarctic Research (SCAR, now                      the area surrounding the station, and the interior region of
the Scientific Committee on Antarctic Research) that had                the continent. In the 3rd SCAR in March 1958, it was
been established within the ICSU in 1958 would take                     proposed that the area to be mapped by Japan should
over the expeditions to the polar region. It was also                   cover between 30°E and 45°E for mapping. Responding
decided that in addition to geophysical research,                       to this proposal, the expedition expanded the mapping
emphasis would be placed on physical, geological,                       area westward beyond 38°E. In addition, mapping of
biological, geodetic and topographic surveys.                           ice-free areas in the inland region, triangulation and
                                                                        traversing of the area surrounding Syowa Station, and
2.2 Participation in Antarctic expeditions                              surveys on interannual changes of coastal areas were
        The Antarctic expeditions were launched as part                 conducted. Observations on gravity and addition of the
of the IGY global project conducted between July 1957                   points were continued and aeromagnetic surveys were
and December 1958, and GSI was assigned with the                        conducted. JARE-7 that resumed in 1965 and subsequent
survey of geomagnetism and gravity, as well as longitude                JAREs continued conducting surveys.
and latitude determination (precise mapping), all of
which are closely related to its activities.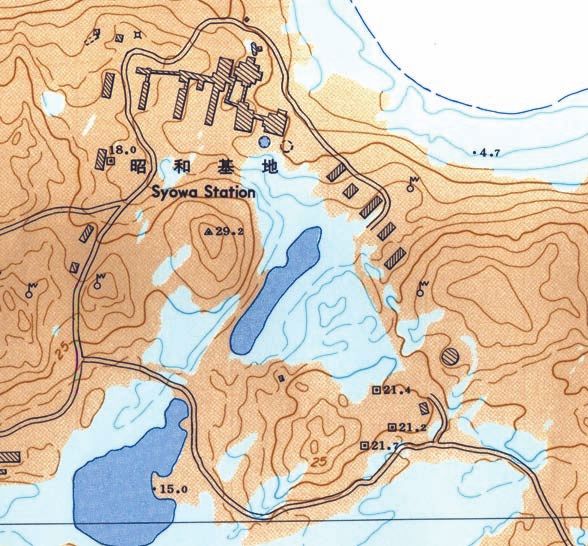
50 Years of Antarctic Research Expeditions by the Geographical Survey Institute                          3

                                                                        February.       This period,            however,   faced extreme
                                                                        congestion due to the transport of supplies for the
                                                                        wintering party and the construction work to build
                                                                        stations, which severely restricted survey activities and
                                                                        made it difficult to stay on schedule. Fortunately, when it
                                                                        was decided to end the Antarctic expeditions with
                                                                        JARE-6, the transportation by air reserved for its aerial
                                                                        photography became available and the planned works on
                                                                        survey activities were completed.
                                                                                  In this six-year Soya period, the main task was
                                                                        preparation of large-scale maps based on aerial
                                                                        photographs of the area surrounding Ongul Island, which
                                                                        were taken for advance research on candidate locations
                                                                        for a station and the surrounding areas. Thus, control
              Fig. 1 Entire Area of Antarctica                          point surveys were conducted only in the areas
                                                                        surrounding East and West Ongul Island at the early
                                                                        stage.
                                                                                  On and after JARE-4 (1959), the network of
                                                                        control points was extended to the opposite coast, and
                                                                        subsequently covered the Langhovde region, Padda
                                                                        Island, New South Rock, and to the ice-free areas on the
                                                                        continent. A small-scale map was prepared based on the
                                                                        control point surveys and aerial photographs taken by
                                                                        JARE-6 (1961).
                                                                                  It was JARE-4 (1959) that first used a microwave
                                                                        distance meter (Photo 1) for control point surveys. With
                                                                        this newly developed meter, it became possible to survey
                                                                        a wider area with greater efficiency and improved
                                                                        precision.
                                                                                  The achievements accomplished up to JARE-6
                                                                        (1961) include the coverage of a total distance of aerial
          Fig. 2 Location of four Japanese stations                     photography exceeding 1,700 km and the establishment
                                                                        of more than 29 control points including astronomical
3. Outline of Antarctic expeditions of GSI                              points. In the coastal area between 37°E and 45°E, data
3.1 1st - 6th Expedition                                                from these achievements and data available from the
       Surveys of the Antarctic region started with an                  Australian party responsible for the east neighboring area
astronomical survey at Syowa Station in January 1957                    satisfied the number of control points necessary for
for the purpose of establishing a geodetic datum, and                   mapping by photographic survey. It thus became possible
ended with aerial photography on JARE-6 in January                      to prepare maps for Prince Olav Island and Holm Gulf at
1962. These years are referred to as the Soya period as                 a scale of 1:100,000–250,000. Based on the data, two
every survey was conducted while the icebreaker Soya                    1:250,000-scale maps were prepared in 1963.
was in service. All survey activities were done during the                        JARE-6 (1961) conducted detailed gravity
summer season in Antarctica from late December to early                 surveys during the round trip between Cape Town and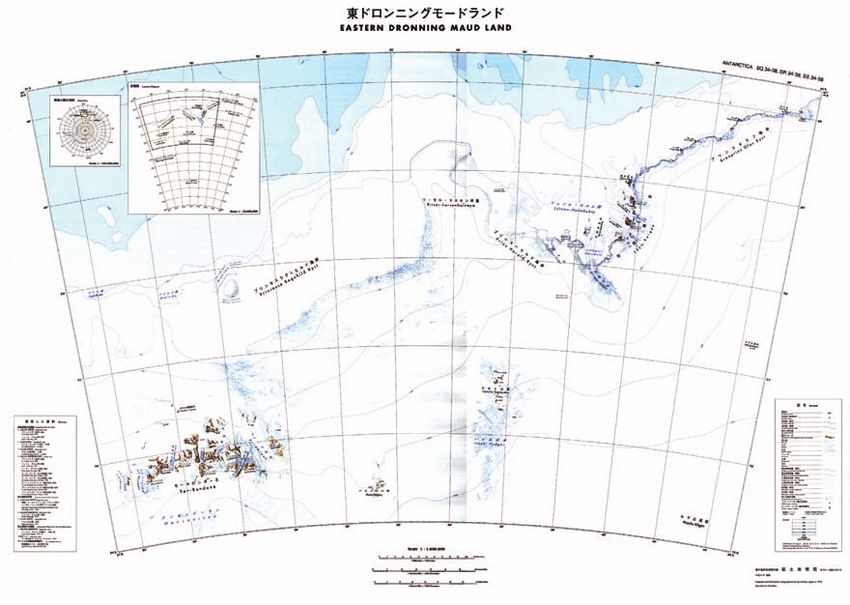
4                                    Bulletin of the Geographical Survey Institute, Vol.54 March, 2007

Syowa Station. Using a GSI-type gravity pendulum, the                   were introduced. Accordingly, transportation capability
standard gravity value at Syowa Station (Photo 2) was                   was significantly upgraded. In addition, the decision to
determined.                                                             continue the Antarctic expeditions made it possible for
         Furthermore, marine magnetic surveys began                     each JARE to conduct observations on a long-term basis.
by JARE-2 in 1957, and were continuously conducted                      With this decision, expedition items were allocated to the
up to JARE-9 in 1967, except for JARE-7 in 1965.                        research observation programs and the continuous
                                                                        monitoring observation programs. The continuous
                                                                        monitoring observation programs are used to obtain
                                                                        basic data and specimens which are indispensable for
                                                                        academic research, and are conducted over extended
                                                                        periods of time, often as part of an international
                                                                        monitoring network. These continuous monitoring
                                                                        observation programs are governed by international
                                                                        reporting standards and have been conducted since
                                                                        JARE-7 (1965). GSI took charge of the geodetic
                                                                        observation program comprising control point surveys
                                                                        and aerial surveys, the geomagnetic observation program
                                                                        focusing on air photo measurement, and the gravity
Photo 1 Observation by          microwave     distance     meter,       observation program engaged in land gravity and marine
  Tellurometer (JARE-4)
                                                                        gravity surveys as parts of the continuous monitoring
                                                                        observation programs. The Meteorological Agency, the
                                                                        Hydrographic and Oceanographic Department of the
                                                                        Japan Coast Guard, and the Radio Research Laboratory
                                                                        (now the National Institute of Information and
                                                                        Communications Technology) also took charge of parts
                                                                        of the continuous monitoring observation programs. The
                                                                        National Institute of Polar Research (NIPR) affiliated
                                                                        with the Ministry of Education (now Ministry of
                                                                        Education, Culture, Sports, Science and Technology) that
                                                                        was established in 1970 took charge of the coordination
                                                                        for these observations.

    Photo 2 Observation by gravity pendulum at Syowa Station                      In its May 1960 recommendations, the Science
                                                                        Council of Japan placed particular importance on

3.2 7th - 17th Expedition                                               mapping among the activities of JARE. In March 1967,

         The    Antarctic expeditions were suspended                    the Antarctic Special Committee of the Science Council

beginning with JARE-6 (1961). In 1963, however, upon                    of Japan drew up a basic policy for future Antarctic

conclusion of various arrangements under Cabinet                        expeditions and indicated that “Japan shall conduct

approval, a decision was made “On the resumption of the                 topographic survey of the sectoral area between 30°E

Antarctic expeditions.” The expeditions resumed in 1965.                and 45°E. In particular, aerial survey of the coastal area

With the revision of the Self-Defense Forces Act, the                   and the neighboring area of inland mountains should be

Defense Agency was assigned with transportation, the                    conducted at the earliest possible time.” This sectoral

expedition ship Fuji was built, and two large helicopters               area was one of the regions proposed by the Soviet
                                                                        Union at the meeting of the Map Subcommittee of the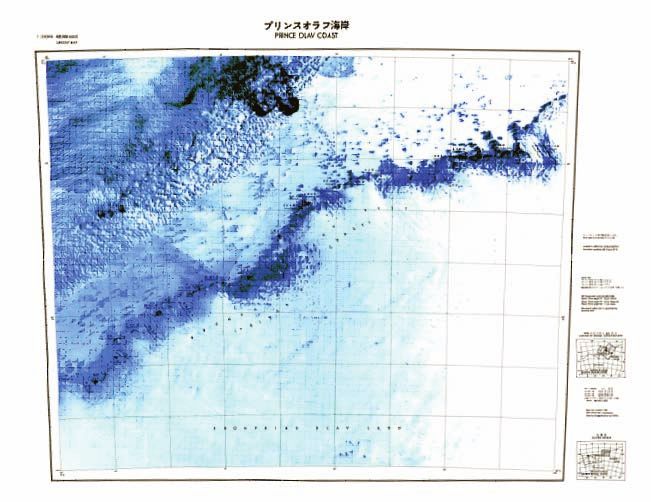
50 Years of Antarctic Research Expeditions by the Geographical Survey Institute                   5

3rd SCAR in March 1959. Since the region contains                           were conducted up to JARE-16 (1974), covering the
Belgium Station and Syowa Station, the Subcommittee                         area from 43°E (around Hinode Misaki on the Prince
recommended that redundant works should be avoided.                         Olav Coast) to 34°E (from Karamete Misaki to
However, Belgium conducted almost no work on                                Riiser-Larsenhalvoya), and Lutzow-Holm Bay and the
geodesy at the time. Japan decided to conduct geodetic                      Yamato Mountain Range. In 1974, GSI produced and
and mapping programs as planned.                                            published the “Contours of total magnetic intensity
       The major achievements by GSI between JARE-7                         (the coast area from Hinode Misaki to Langhovde)”
and JARE-17 (1965–1975) are the following.                                  (Tazima, et al., 1972) prepared from aeromagnetic
1) The wintering party conducted geodetic expeditions                       surveys of JARE-15 (1973), and clarified the
  for the first time on JARE-7 (1975). This made it                         distribution of magnetism in the region.
  possible to conduct control point surveys necessary for                6) As for equipment, (the microwave distance meter was
  preparation of large- and medium-scale maps not only                      replaced with the electro-optical distance meter (Photo
  in summer but also in spring and winter.                                  4), the electro-optical distance meter was used with
2) The survey engineer from GSI joined the wintering                        the T-3 theodolite), the super-wide-angle aerial camera
  party of JARE-9 on the round trip between Syowa                           was introduced to cover expanded shooting areas,
  Station and the South Pole. He navigated the party                        and the Worden gravimeter was replaced with the
  using the pilot surveys and traversing. He also                           Lacoste gravimeter that has stable constants with less
  conducted geophysical observations such as of gravity                     drift. JARE-2 (1957) started with the Zeiss RMK
  and geomagnetism during the trip.                                         11.5/18 aero camera, but JARE-11 (1969) replaced
3) With the development of a GSI-type ocean gravimeter,                     it with the Wild RC-9 (Photo 5) that has 30° wider
  the survey engineer conducted gravity surveys on the                      angle than the existing aero camera. Thus, it became
  expedition ship (photo 3).                                                possible to reduce the shooting time and decrease the
4) Aerial photographs of the inland Yamato Mountain                         number of paths and distribution density of control
  Range were taken and control point surveys were                           points.
  conducted. On JARE-16, a fixed-wing aircraft became
  available and the necessary crew was permitted to
  overwinter. Because a relay station was built inland,
  aerial photographs of inland mountains including the
  Belgica Mountains and the Riiser-Larsenhaivoya area
  up to 30°E were successfully taken.
  Infrared aerial and color aerial photographs of glacier
  basins and biological habitat areas were also taken for
  the purpose of analysis from the viewpoint of
  glaciology and biology.
5) For aeromagnetic surveys, JARE-8 (1966) first used a
  helicopter, and JARE-11 (1969) used a fixed-wing                                 Photo 3 Ocean gravity observation (JARE-13)
  aircraft. This allowed us to locate a geomagnetic
  anomaly exceeding several hundred nanotesla (nT) on
  the sea west of West Ongul Island. The achievements
  in aerial photography were published in January 1972
  as the “Contours of total magnetic intensity over
  Lutzow-Holm Bay and its vicinity” (Tazima, et al.,
  1972, Fig. 3). Subsequently, aeromagnetic surveys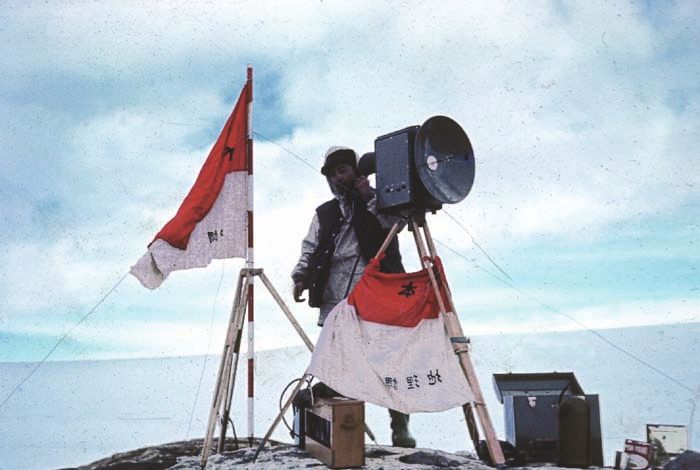
6                                   Bulletin of the Geographical Survey Institute, Vol.54 March, 2007

                                                                       3.3.1 Mid-term Antarctic expedition plan
                                                                                 The Antarctic research expeditions are carried out
                                                                       in accordance with the “Basic Policy of Japan Antarctic
                                                                       Research Expeditions (March 1976)” and the “Policy of
                                                                       Activities toward the 21st Century (June 2000)” drawn
                                                                       up by the Headquarters for the Japanese Antarctic
                                                                       Research Expedition (JARE Headquarters.) Five years
                                                                       was set as the unit for the expedition plan beginning with
                                                                       JARE-18 (1976) and observation activities were to be
                                                                       effectively and efficiently implemented. Details of each
Fig. 3 Contours of total magnetic intensity over Lutzow-Holm           expedition plan are presented in Appendix 1.
  Bay and its vicinity
                                                                                 Please note, however, that four years instead of
                                                                       five years was adopted as the unit for FY 2009, because
                                                                       the observation ship succeeding the Shirase will be put
                                                                       into service in 2009 and a new expedition support system
                                                                       will be introduced, and the end of the mid-term Antarctic
                                                                       expedition plan should coincide with the end of present
                                                                       mid-term plan of NIPR.

                                                                       3.3.2 Implementation outline of each observation item
                                                                                 The outline of the expedition items implemented
                                                                       on and after JARE-18 (1976) to the present is as follows:

Photo 4 Observation by electro-optical distance meter,                 (1) Control point survey
  Geodimeter 8 (JARE-14)
                                                                                 The method used for determining the position of
                                                                       coordinates was astronomical survey up to the summer
                                                                       party of JARE-24 (1982). Exceptionally the wintering
                                                                       party of JARE-26 (1984) also partly used solar
                                                                       observation for control point surveys. From the
                                                                       wintering party of JARE-24 (1982) until JARE-30
                                                                       (1982), the positioning system used was the Navy
                                                                       Navigation Satellite System (NNSS), which utilizes the
                                                                       Doppler effect. The NNSS was later replaced with GPS,
                                                                       which has been used for control point surveys up to the
                                                                       present.

                                                                       (a) Navy Navigation Satellite System
                                                                                 JARE-24 (1982) started with a control point
                                                                       survey in Sor Rondane, a huge mountain range in East
                                                                       Antarctica about 700 km west-southwest of Syowa
     Photo 5 Aerial camera, RC-9, installed in a Cessna
                                                                       Station, with the objective of preparing topographic
                                                                       maps at a scale of 1:50,000. For the first time, NNSS
3.3 On and after the 18th Expedition
                                                                       (Photo 6) replaced the astronomical survey in Antarctica.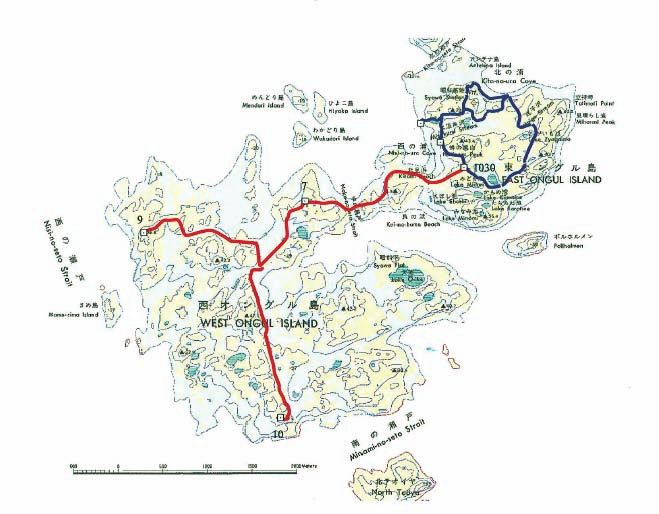
50 Years of Antarctic Research Expeditions by the Geographical Survey Institute                            7

GSI conducted control point surveys in collaboration                   more than three hours at each control point at intervals of
with the expeditionary party to Sor Rondane Mountains                  five seconds. Because GPS survey does not take as much
on JARE-24 (1982), with the geoscience preliminary                     time as NNSS survey, operating efficiency improved
research party to Sor Rondane on JARE-25 (1983), and                   considerably.
the geoscience research party to Sor Rondane between                             Under the proposal of the SCAR Campaign,
JARE-26 (1984) and JARE-32 (1990).                                     JARE-33 (1991) conducted a continuous survey for 21
       In those days, NNSS determined the longitude,                   days at the GPS observation point at Syowa Station.
latitude, and ellipsoidal height of an observation point by            With this international collaborative observation, the
receiving radio waves from 7–8 satellites that went                    longitude and latitude of Syowa Station became linked
around the polar orbit at an altitude of about 1,100 km                on the global geodetic network with a high degree of
over a period of about 107 minutes. The system freed                   accuracy. JARE-34 and JARE-36 took over the
observers from long hours of outdoor survey in a frigid                international      collaborative        observation    under   this
climate. However, this system was not an effective way                 Campaign, and it was replaced with the continuous GPS
to observe all control points because it required                      observation station beginning with JARE-37 (1994).
continuous observation over several days to determine                            In conjunction with the GPS international
longitude and latitude with a high degree of accuracy.                 collaborative observation, JARE from the 33rd (1991) to
Given this fact, GSI used NNSS for observation in the                  the 37th (1994) conducted joint observation of the
vicinity of the base camp. Based on the control points                 geodetic network with the help of the existing control
determined by NNSS, GSI conducted traversing or                        points at ice-free areas and carrier phase differential GPS.
triangulation using an electro-optical distance meter and              At the same time, GSI set up new control points in order
theodolite.                                                            to prepare color photo maps at a scale of 1:10,000.
                                                                                 Since the International GPS Service (IGS, now
                                                                       the International GNSS service) point “SYOG” was set
                                                                       at Syowa Station on JARE-36 (1994), it was designated
                                                                       as the substantial point of origin on and after JARE-37
                                                                       (1994). As for the control point survey (Photo 7) of each
                                                                       ice-free area, GSI established or resurveyed control
                                                                       points using carrier phase differential GPS based on this
                                                                       point as the origin.
                                                                                 JARE-40 (1998) revised the survey results of IGS
                                                                       points with those based on both the International
                                                                       Terrestrial Reference System (ITRF) and GRS80
      Photo 6 NNSS observation equipment (JMR-4A)                      ellipsoid.
                                                                                 On and after JARE-41 (1999), observation and
(b) Global Positioning System                                          analysis were based on ITRF2000 the origin of which is
       As GPS became available in the late 1980s,                      the IGS point “SYOG.”
JARE-30 (1988) conducted trial observation by GPS in                             The coordinates of the IGS point “SYOG” are
the Sor Rondane Mountains. Based on the observation                    determined        based      on     ITRF2000      by    combined
results, JARE-31 (1989) and JARE-32 (1990) conducted                   observation with the Very Long Baseline Interferometry
independent control point surveys by GPS in the Sor                    (VLBI) observation point and the Doppler Orbitography
Rondane Mountains. Back then, there were not as many                   and Radiopositioning Integrated by Satellite (DORIS)
GPS satellites, and the time allowed for observation was               observation points. The IGS point “SYOG” was
4–5 hours per day. However, GSI conducted surveys for                  registered with ITRF in March 2001 together with the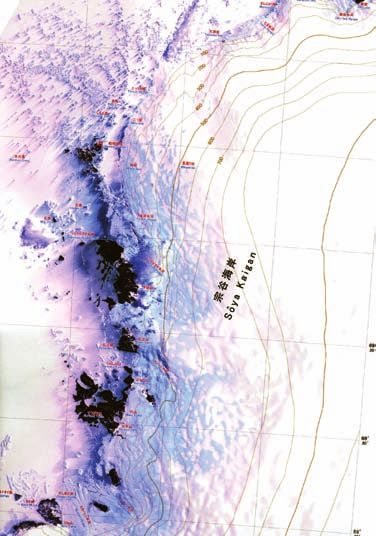
8                                   Bulletin of the Geographical Survey Institute, Vol.54 March, 2007

VLBI observation point.                                                measurement was carried out on JARE-33 (1991), the
                                                                       new gravimeter room was set up, and the new gravity
                                                                       value of the International Absolute Gravity Base Station
                                                                       Network (IAGBN) point was determined.
                                                                                 In March 1986, GSI compiled the report
                                                                       “Records of Antarctic observation data – gravity and
                                                                       geomagnetism” and it was included in “Records of
                                                                       Antarctic observation data – control point survey, gravity,
                                                                       geomagnetism,            aerial        photograph     and     map”
                                                                       (Geographical Survey Institute, 1985.)
                                                                                 On and after JARE-34 (1992), gravity surveys
                                                                       were conducted on each control point in Syowa Station
        Photo 7 GPS observation in the ice-free area                   and its vicinity based on the gravity value of the IAGBN
                                                                       point in the gravimeter room. JARE-35 (1995) used the
(2) Gravity survey                                                     Scintrex gravity meter, which is a digital relative gravity
       The Lacoste gravimeter introduced on JARE-8                     meter introduced in 1995 for surveying ice-free areas
(1966) is still being used together with the Scintrex                  and observing vertical slopes. Thereafter, gravity surveys
gravimeter introduced on JARE-37 (1995). On and after                  on ice-free areas were mainly conducted by Scintrex
JARE-33 (1991), highly precise absolute gravity                        gravity meter, although the Lacoste gravimeter is also
measurement was conducted every 3–6 years with                         used on some expeditions.
Sakuma-type and FG5 absolute gravimeters (hereinafter
referred to as FG5).                                                   (b) Absolute gravity measurement
                                                                                 The General Assembly of the 19th IUGG/IAG
(a) Relative gravity measurement                                       reached a resolution to establish IAGBN.
       JARE-19 (1977) conducted gravity surveys in                               IAGBN        aims       to   distribute   gravity   points
Ryugu Misaki and in the area surrounding Syowa Station.                worldwide and construct a network on which gravity
For the measurement, gravity values based on the                       observation is based (Fig. 4). There are two kinds of
International Gravity Standard Network 1971 (IGSN71)                   points: IAGBN-A is a point set up in regions with stable
and the Japan Gravity Standard Network 1975 (JGSN75)                   crustal structure, and IAGBN-B is a point set up in
were applied in place of the Potsdam gravity series for                regions where crustal activity is expected. There are
the first time in JARE. Because absolute gravity                       three points in Esashi, Tsukuba and Kyoto, all of which
measurement conducted worldwide during this period                     are classified as IAGBN-B points. Syowa Station in
gradually clarified that the Potsdam gravity series had                Antarctica was among the 36 IAGBN-A points.
had systematic errors, IGSN71 was adopted by the                       McMurdo Station of the U.S. is the only another point in
International Union of Geodesy and Geophysics (IUGG)                   Antarctica other than Syowa Station that is classified as
as the gravity standard network in place of the Potsdam                IAGBN-A.
series, and the replacement was announced in 1974.                               The gravimeter room was built on JARE-32
JGSN75 is based on IGSN71 and the domestic gravity                     (1990) on an ice-free area close to the large multipurpose
standard network. With this replacement, the gravity                   antenna (Photo 8). The first measurement was conducted
standard network entered a new era.                                    by JARE-33 (1991), and GSI conducted absolute gravity
       The gravity value based on IGSN71 in Syowa                      measurement between January 4 and 8, 1992 for the first
Station had been adopted as the standard value of Syowa                time in JARE history. Introduced by GSI in 1980, the
Station and its vicinity, before the absolute gravity                  upcast-type absolute gravimeter (GA60), generally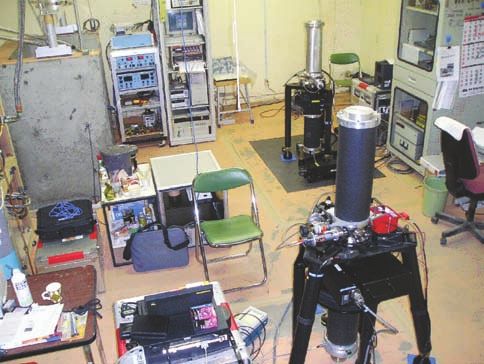
50 Years of Antarctic Research Expeditions by the Geographical Survey Institute                     9

called the Sakuma type, was used in this measurement. It                        Later, JARE-42 (2000) conducted the second
uses the measurement principle to determine acceleration              absolute gravity measurement using FG5 (No. 203
(absolute value of gravity) by precisely measuring the                machine) and obtained data for comparison with that
height of an upcast object (corner cubic mirror) in                   using the same equipment for the first time. The
vacuum with a laser interferometer. Observation results               comparison data agreed with the gravity values observed
at Syowa Station were superior to those in Japan because              by JARE-36 (1994) with an error of 0.001 mGal,
the gravity room at Syowa Station is nearly free from                 indicating highly reproducible values. However, no
ground vibration.                                                     temporal change in gravity beyond the detection limit
       JARE-36 (1994) conducted observation using                     was observed at Syowa Station. JARE-45 (2003)
FG5 (No. 104 machine) that GSI introduced in 1992.                    conducted the third survey using the FG5 (No. 203
Because FG5 measures gravity in a free-fall system, it is             machine) and observed a secular change of gravity.
characterized by the ability to conduct automatic                               At Syowa Station and its vicinity, ground
continuous    measurement     and     allow      for     many         deformation is assumed to be due to post-glacial rebound.
measurements. It is currently used worldwide as the de                The results obtained by FG5 agree with model estimates
facto standard gravimeter, and joint observation under                and the results of VLBI and GPS observation regarding
international cooperation confirmed that it can be used to            the uplift of crust, although there remains a large error as
observe gravity values compatible with absolute                       a secular change.
gravimeters used worldwide.

                          Fig. 4 International Absolute Gravity Basestation Network (IAGBN)
                                 [A points only]
10                                  Bulletin of the Geographical Survey Institute, Vol.54 March, 2007

                                                                                 The published chart was composed of seven
                                                                       sheets displaying the distribution and its annual change
                                                                       rate of each magnetic component using the azimuthal
                                                                       equidistant projection with the Magnetic South Pole in
                                                                       the center, and one sheet displaying anomalies of total
                                                                       magnetic force. The scale is 1:15,000,000 (Fig. 5). GSI
                                                                       sent the chart to relevant organizations both at home and
                                                                       abroad in 1978.

         Photo 8 Gravimeter room at Syowa Station

          Photo 9 Measurement scene on JARE-45
                                                                        Fig. 5 Antarctic magnetic chart (Part of the magnetic dip chart)
(3) Geomagnetic survey
       As of JARE-47 (2005), GSI has accumulated                       (4) Leveling
geomagnetic observation data of 1,757 points in                                  Leveling was conducted on East Ongul Island in
conjunction with ice-free areas research and inland                    order to detect the uplift rate of post-glacial rebound
research excluding data obtained by aeromagnetic survey,               confirmed by the crustal activity of the Antarctic area
and GSI has been conducting geomagnetic observation at                 and the coastal area of Antarctica. Leveling was planned
Syowa Station as well.                                                 because the water’s edge of uplift land was observed in
       At the request of SCAR and Working Group on                     ice-free areas and it was assumed that slopes would be
Solid Earth Geophysics, GSI prepared charts of the                     detected between on the west and east sides of Ongul
geomagnetic distribution in the Antarctic region in 1978.              Island due to the difference in uplift rate. All leveling
GSI requested deta of observatory and field survey from                was conducted in conformity with the first-order leveling
each country through SCAR in order to compile and                      specification used in Japan by GSI.
create the chart. As a result, GSI obtained data from                            JARE-20 (1979) and JARE-23 (1982) established
eight countries including Japan, and the number of data                the leveling route and conducted leveling on East Ongul
items finally used for publication of the chart was 9,583              Island (8.2 km). The first resurvey of benchmarks on
including those of three-component observation, and                    East Ongul Island was made by JARE-32 (1991) and
total magnetic force observation.                                      JARE-33 (1992); nine benchmarks were resurveyed
50 Years of Antarctic Research Expeditions by the Geographical Survey Institute 11
including the benchmark at the tide observation station. to West Ongul Island to improve the detection of slope
JARE-43 (2002) subsequently resurveyed all changes between both islands due to post-glacial
benchmarks using a digital level. rebound. JARE-47 (2005) surveyed all newly built
Post-glacial rebound is assumed to be ongoing on leveling routes on West Ongul Island (6.5 km) and
East Ongul Island, and observations were conducted resurveyed the leveling routes on East Ongul Island (6.3
three times there. However, any change great enough to km), and added a leveling point to the IGS point
prove post-glacial rebound has not yet been observed. “SYOG” (Fig. 6).
JARE-46 (2004) extended the leveling route up
: Leveling route before JARE-45
: Leveling route established by JARE-46
Fig. 6 Map of leveling routes on East and West Ongul Islands
(5) Continuous GPS observation analysis were used to calculate coordinates and velocity
In the fourth Five-Year Plan (FY 1990–1995), vectors to estimate the movement of the Antarctic plate
continuous GPS observation was planned. In accordance (Fig. 8).
with this Five-Year Plan, JARE-33 (1991) started The continuous GPS observation station set up in
participating in the SCAR Campaign observations. Syowa Station was registered with IGS on May 16, 1999.
JARE-36 (1994) set up a IGS station “SYOG” inside It is the fifth station of this kind in Antarctica.
Syowa Station, from which observation data is There are not so many IGS stations in the
transmitted to Japan daily (Figs. 7 and Photo 10). southern hemisphere. In particular, because there are few
Data from continuous GPS observation was observation stations on the east coast of Antarctica, the
analyzed together with that from other observation continuous GPS observation station in Syowa Station
stations in the Antarctic region in 1997. Results of plays an important role in the IGS network.12 Bulletin of the Geographical Survey Institute, Vol.54 March, 2007
Astronomical point
Point where receivers are installed
Continuous GPS observation point
Benchmark point (No. 23-16)
Fig. 7 Location of the continuous GPS observation point
Fig. 8 Velocity vector of the GPS stations in Antarctica and the
Euler Pole of the Antarctica plate (Yamada, 1998)
Multipurpose antenna dome
(6) GPS survey for measuring movements of ice sheet
Gravimeter room and detecting crustal movements
JARE-37 (1995) started crustal movement
surveys by GPS in Langhovde. JARE-38 (1996) set up
observation point “S16” on the ice sheet, and JARE-39
(1997) added observation points “S15” and “S17” on the
ice sheet to obtain additional data. Movement of the ice
sheet around each observation point has been annually
observed by GPS survey (Fig. 9). The results of surveys
during JARE-38 (or JARE-39) and JARE-47 show that
the points “S15” and “S16” are moving west-northwest
at 5.0 m per year, and point “S17” is moving
west-northwest at 4.7 m per year. GSI schedules to
start measuring rates of ice sheet movements by
Synthetic Aperture Radar (SAR) Interferometry in 2007.
This method enables wide area movements to be
detected. These observation points on the ice sheet will
be used for evaluating accuracy.
JARE-41 (1999) established an automatic
continuous GPS observation station “LANG” at Yukidori
Zawa in Langhovde (Fig. 10 and Photo 11) in order to
Photo 10 Pillar antenna of continuous GPS observation station
detect post-glacial rebound. The station is located in an
and other observation facilities of the surrounding area
ice-free area and has solar batteries and a wind power
generator to supply electricity for GPS observation. This50 Years of Antarctic Research Expeditions by the Geographical Survey Institute 13
continuous GPS observation station is the first
unattended one in the coastal area near Syowa Station,
and continuous observation has been conducted since the
station was built. Because the observation data is
accumulated in a compact memory flash card and
processed offline, the recorded data card is picked up
once a year in the summer period and brought back to
Japan. The observed data is analyzed together with IGS
“SYOG” and other IGS points.
Photo 11 Automatic continuous GPS observation station with
solar battery panels at Langhovde
(7) VLBI observation
S15 S17 JARE started regular VLBI observation at Syowa
Syowa Station Station in 1998. There is another VLBI observation
Continuous GPS S16 station in the Antarctic Peninsula (O’Higgins Station).
observation point
Since 1992, observations have been conducted by
10km O’Higgins Station and most VLBI observation stations
in the southern hemisphere, which are currently referred
Fig. 9 Syowa Station and observation points around S16 to as OHIG sessions. Syowa Station started to participate
in the OHIG session in 1999. This is the first observation
using the baseline between Syowa and O’Higgins in
Antarctica. Figure 11 shows the distribution of VLBI
stations in the southern hemisphere.
VLBI observation at Syowa Station is conducted
using the multipurpose antenna installed inside the
station. This antenna is parabolic one (11 m in diameter)
and used for receiving signals from aurora observation
satellites and earth observation satellites (Photo 12).
VLBI observation at Syowa Station initially
started as a research observation program of NIPR
(currently replaced by the monitoring observation
program of NIPR). However, because NIPR did not have
any experts on VLBI, GSI dispatched an expert to
support the startup of VLBI observation during JARE-40
(1998–2000).
Fig. 10 Location map of continuous GPS observation stations, Data obtained at Syowa Station is brought back
“SYOG” and “LANG”
to Japan once a year, and GSI and NIPR jointly perform
the data conversion, correlation processing, and baseline
analysis.14 Bulletin of the Geographical Survey Institute, Vol.54 March, 2007
photography to the S�r Rondane Mountains about 600
km west-southwest of Syowa Station.
A Pilatus Porter PC-6 was deployed on JARE-21
(1979). This plane can cover a longer distance compared
to the Cessna, making it possible to take aerial
photographs of distant areas that could not previously be
covered. In addition, its ability to climb up to 7,000 m
made it possible to take aerial photographs of a smaller
scale (Photo 13). At the same time, JARE-22 (1980)
changed the aerial camera from the Wild RC-9 to the
more user-friendly Wild RC-10, successfully increasing
efficiency.
In order to ensure that every area was covered by
aerial photography, a film-developing machine was
Fig. 11 Distribution map of VLBI observation stations in the transported to Syowa Station, and developing and
southern hemisphere (The epoch time of baseline length is
November 8, 1999.) printing of the photographs was carried out at the site.
Color films were processed after being brought back to
Japan because processing equipment was not available at
the site.
Since Asuka Camp (now Asuka Station) was
settled on Sor Rondane Mountains, JARE-28 and
JARE-29 conducted aerial photography covering that
area. On and after JARE-32 (1990), when filming of the
Sor Rondane Mountains was almost finished, color aerial
photographs of the Ongul Island area, Langhovde area,
and Skarvsnes area started to be taken in order to
produce color aerial photograph maps.
Along with the aerial photography, pre-marking
and post-marking were also carried out (Photo 14).
Photo 12 Multipurpose antenna at Syowa Station
(In the redome at the back, the GPS continuous observation
station is at the forefront.)
(8) Aerial photography
Between JARE-17 (1975) and JARE-24 (1982),
GSI conducted principal and supplementary projects of
aerial photography in the area between 37°E and 45°E in
accordance with the plan of 1:25,000 topographic
mapping. Thus, the coastal and ice-free areas necessary
to map the topography beyond 37°E were successfully Photo 13 Pilatus Porter (left) and Cessna (right) at Syowa
covered. Photography was discontinued at that stage, and Station. Far left is the observation ship Shirase.
JARE-24 (1982) changed the target area for aerial50 Years of Antarctic Research Expeditions by the Geographical Survey Institute 15
Two topographic maps at a scale of 1:250,000
were published in 1963 to make them compatible with
the existing maps prepared by Australia neighboring to
the east and Belgium neighboring to the west. The
published map was, however, low in precision because
of the small number of control points. It was revised in
1990 compiling the 1:25,000 scale maps which had been
produced to cover most of the coastal area by 1986
(Fig.13).
Photo 14 Three-blade photogrammetric target painted in white The topographic map produced in 1970 at a scale
of 1:1,000,000 was the only map that covered the
(9) Mapping fan-shaped area located between 30°E and 45°E. It was
Maps of Antarctica were prepared by, in order: based on a route map that contains various geographic
aerial photography, astronomical survey for features including observed positions, terrain, and
determination of position and direction, setting of control terrestrial magnetism obtained along the previous
points necessary for mapping, pricking, aerial expedition routes, and was not based on “Standard
triangulation, mapping, and editing. Symbols for Use on Maps of Antarctica.” In 1997, a map
The first map of Antarctica covered East Ongul covering Eastern Queen Maud Land was drawn in
Island where Syowa Station is located. It was produced conformity with “Standard Symbols for Use on Maps of
at a scale of 1:5,000 using a 2nd class high-precision Antarctica” and “International Map of the World on the
plotter using nine control points (including astronomical Million Scale.” It was published in 1998 with the name
points) set up by the first JARE in 1957 and aerial changed to Eastern Dronning Maud Land in addition to
photographs (Fig. 12). partially revised contents (Fig. 14).
Because ice-free areas are not covered with Between FY 1981 and FY 1988, GSI produced a
plants, it was basically easy to draw contour lines. total of eight satellite image maps at a scale of 1:250,000
However, considerable effort was needed to plot the using image data of the Multi Spectral Scanners (MSS,
snow covered areas, for which there is no stereoscopic resolution 80 m) taken by Landsat-1 and Landsat-2, in
effect due to halation. The ice free exposed area is the ice-free areas and Sor Rondane Mountains. Figure 15
sometimes very complex terrain created by wind and is one of the satellite image maps created in 1988. In
snow. response to the increased demand for new and more
In addition, it is not easy to read coastlines precise satellite image maps to ensure safe expedition
precisely because they are covered with snow. Thus, tide operations, GSI published new satellite image maps (27
cracks are mapped as the shore line in most cases. As for image maps at a scale of 1:250,000 and a single image
mapping Antarctica, the Antarctic Observation Plans map at 1:2,000,000) using color images of the Enhanced
drawn up by the Antarctic Special Committee in March Thematic Mapper Plus (ETM+, resolution 30 m) taken
1967 advocated in its basic policy that topographic by Landsat-7 and SAR images (resolution 50 m) taken
survey should cover the fan-shaped area located between by RADARSAT (Fig. 16 and 17). By using satellite
30°E and 45°E. Topography at a scale of 1:25,000 images, it has become possible to produce wide area
covering Lutzow-Holm Bay, the ice-free areas facing the image maps economically even in Antarctica where
Prince Olav Coast, and the Yamato Mountains was aerial photography is not an easy job.
mapped between 1965 and 1987. A topographic map at a When topographic mapping finished in 1993,
scale of 1:50,000 covering most of the Sor Rondane color photo maps were prepared for the purpose of
Mountains was prepared in 1992. obtaining detailed knowledge and conducting thorough16 Bulletin of the Geographical Survey Institute, Vol.54 March, 2007
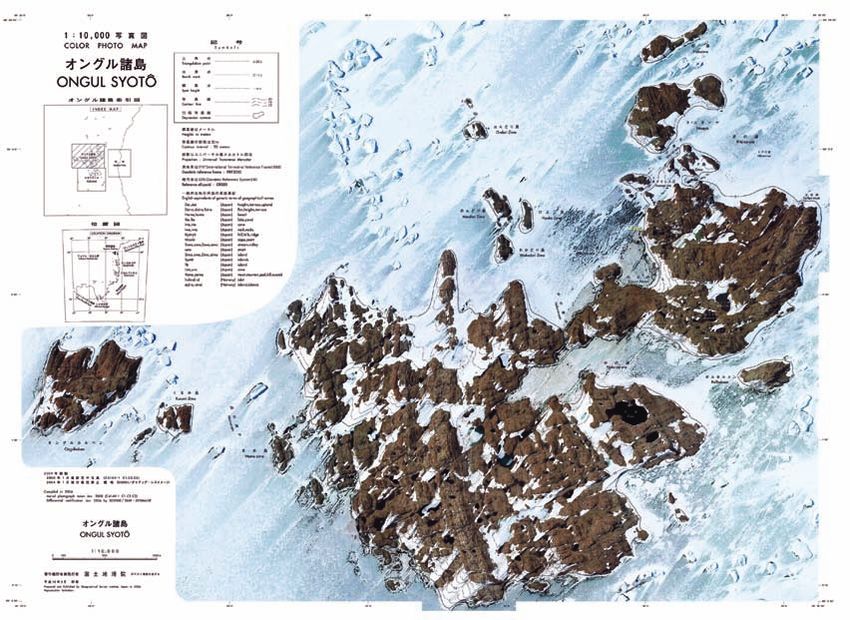
research on the ice-free areas. Color photo maps at a
scale of 1:2,500 and 1:10,000 were successfully
produced in Antarctica (Fig. 18).
Basically, these maps prepared by GSI comply
with the “Standard Symbols for Use on Maps of
Antarctica” approved by SCAR. Geographical names
displayed in the maps are those approved by JARE
Headquarters based on the drafts prepared by the
Antarctic Place-names Committee within NIPR.
Index maps and lists of the prepared maps by GSI
are shown in Appendix 2 and Appendix 3.
GSI exchanges these maps with the agencies
responsible for preparation of Antarctic maps in foreign
countries in compliance with the recommendation from
SCAR’s Working Group on Geodesy and Geographic
Information (now Standing Scientific Group on Fig. 12 Topographic map (Scale 1:5,000)
Four colors, duodecimo, printed in 1993
Geosciences and Standing Committee on Antarctic
Geographic Information).
Fig. 13 Topographic map (Scale 1:250,000)
Four colors, duodecimo, printed in 199050 Years of Antarctic Research Expeditions by the Geographical Survey Institute 17
Fig. 14 Topographic map (Scale 1:1,000,000)
Seven colors, Lambert conformal conic projection, printed in 1998
Fig. 15 Satellite image map from Landsat-1 and Landsat-2 (1998)18 Bulletin of the Geographical Survey Institute, Vol.54 March, 2007
Fig. 16 Coverage of satellite image map from Landsat-7 and
RADARSAT (2005)
Fig. 17 Part of a satellite image map prepared at a scale of
1:250,000 (2005)
Fig. 18 Color photo map (Scale 1:10,000) of Ongul Island50 Years of Antarctic Research Expeditions by the Geographical Survey Institute 19
3.4 Outline of annual expedition 1976, the Survey Guidance Division of the Planning
The dispatched personnel, type of survey and Department was established and took over this task.
remarkable topics on JARE are depicted by year in Then, in 1995, the International Affairs Office of the
Appendix 4. Planning Department was established and took over the
task.
4. Organization of GSI As of March 2007, the International Affairs
GSI has participated in every JARE since the Office of the Planning Department is in charge of
beginning. GSI has promoted JARE as one of the planning and coordinating JARE operations of GSI. As
activities without establishing a special section within in the past, the Geodetic Department and Topographic
the organization. Department are responsible for observation business,
Because GSI is mainly engaged in control point whereas the Geoinformation Department manages maps
surveys, geophysical surveys, aerial surveys, and of Antarctica sent to GSI from abroad. The Head of the
mapping, JARE is well suited to the Geodetic Basic Information Division of Topographic Department
Department and Topographic Department, both of which is a member of the Antarctic Place-names Committee
participated in JARE with their own business plans. under NIPR.
In the initial stage, GSI underwent several Maps prepared by GSI are distributed to JARE
organizational changes, but the system to support JARE and researchers through NIPR.
remained unchanged. The Geodetic Department took In compliance with the recommendations from
charge of the control point and geophysical surveys, SCAR, GSI exchanges maps with agencies in charge of
while the Topographic Department was responsible for Antarctic maps in foreign countries. GSI organizes the
aerial surveys and mapping. Because of this, GSI had results of JARE such as geodetic surveys as technical
two windows for JARE, making it difficult for people to reports, and publishes the results of analysis as needed.
decide which department they should contact. The The organization and activities on JARE of GSI
Planning Section (now the Planning Department) was as of March 2007 are shown in Fig. 19. Appendix 5
established in 1967, and was placed in charge of illustrates the system of JARE.
planning and coordinating JARE operations of GSI. In20 Bulletin of the Geographical Survey Institute, Vol.54 March, 2007
Fig. 19 Organizational chart for Antarctic expeditions by GSI
5. Conclusion information for future Antarctic research expeditions.
Fifty years have passed since GSI first This is the condensed edition of the
participated in the JARE. During this period, some corresponding report carried in the Journal of the
independent observation results have been reported in Geographical Survey Institute, No. 111. Although the
English, but no comprehensive English report has been original Japanese edition lists numerous references, we
published. We decided to publish this report to mark the have listed here mainly English references and only the
50th anniversary. Although each project is not covered in essential Japanese ones.
detail, we believe that this report will provide useful50 Years of Antarctic Research Expeditions by the Geographical Survey Institute 21
Acknowledgements Processing of the data of Syowa VLBI experiment by
We are grateful to the National Institute of Polar copying between the different recording systems and
Research, the Hydrographic and Oceanographic the result, International VLBI Service for Geodesy
Department of the Japan Coast Guard, the Ministry of and Astrometry 2002 General Meeting Proceedings,
Education, Culture, Sports, Science and Technology, and 184-188, NASA/CP-2002-210002,
other related organizations, and many individuals who Fukuzaki, Y., K. Shibuya, K. Doi, T. Ozawa, A.
are/were engaged in JARE for their support of GSI Nothnagel, T. Jike, S. Iwano, D.L. Jauncey, G.D.
activities. Nicolson and P.M. McCulloch (2005): Results of the
VLBI experiments conducted with Syowa Station,
References Antarctica, Journal of Geodesy, 79, 379-388.
Abe, Y. (1975): Gravity data, JARE data reports, 28 Fukuzaki, Y., K. Shibuya and K. Doi (2006): Status and
(Glaciology 3), 114-119. results of JARE Syowa Station, Antarctica,
Abe, Y. (1975): Geomagnetic data, JARE data reports, International VLBI Service for Geodesy and
28 (Glaciology 3), 120-121. Astrometry 2006 General Meeting Proceedings,
Abe, Y., A. Yoshimura and R. Naruse (1978): Gravity 177-181, NASA/CP-2006-214140.
anomalies and bedrock relief in Mizuho Plateau, Geographical Survey Institute (1979): Records of
Memoirs of National Institute of Polar Research, Antarctic observation data – control point, aerial photo
Special Issue, 7, 37-43, National Institute of Polar and map. (in Japanese)
Research. Geographical Survey Institute (1985): Records of
Chiba, H. and H. Kobayashi (1973): Seismological Antarctic observation data – control point, gravity,
bulletin of Syowa Station, Antarctica, 1971, JARE geomagnetism, aerial photo and map. (in Japanese)
data reports, 19 (Seismology 6), 1-65. Geographical Survey Institute (2002): Records of
Doi, K., T. Ozawa, K. Shibuya, H. Nakagawa, M. Omura Antarctic observation data (2) – control point, gravity,
and K. Koike (1998): Preliminary study to generate a geomagnetism, aerial photo and map, Technical
DEM of Amunsen Bay of the Antarctica by Report of the Geographical Survey Institute,
interferometric SAR, Polar Geoscience, 11, 14-22. B1-No.32. (in Japanese)
Fujiwara, S., K. Watanabe and Y. Fukuda (1993): Geographical Survey Institute (2007): 50 Years of
Absolute gravity measurement at Syowa Station, Antarctic research expedition by the Geographical
Antarctica, Proceedings of the NIPR Symposium on Survey Institute, Journal of the Geographical Survey
Antarctic Geosciences, 6, 137. Institute, 111. (in Japanese)
Fujiwara, S., K. Watanabe and Y. Fukuda (1994): Harada, Y., H. Suzuki, S. Ohashi and S. Kakinuma
Measurement of absolute gravity at Syowa Station, (1960): Determination of the difference in gravity
Antarctica, Bulletin of the Geographical Survey between Chiba, Singapore, Cape Town and Syowa
Institute, 40, 1-5. Station in Antarctica, Bulletin of the Geographical
Fukuda, Y., S. Iwano, H. Ikeda, Y. Hiraoka and K. Doi Survey Institute, 6, 135-156.
(2005): Calibration of the superconducting gravimeter Haruyama, H. (1980): Compilation of "Magnetic Maps
CT#043 with an absolute gravimeter FG5#210 at 1975 of the Antarctic", Bulletin of the Geographical
Syowa Station, Antarctica, Polar geoscience, 18, Survey Institute, 24, 26-36.
41-48. Inoue, E. (1960): A new GSI pendulum apparatus,
Fukuzaki, Y. (2002): First precise results of VLBI Bulletin of the Geographical Survey Institute, 6,
observation of the baseline in Antarctic Plate, Bulletin 167-200.
of the Geographical Survey Institute, 48, 17-24. Inoue, E. (1960): Pendulum determinations of the gravity
Fukuzaki, Y., K. Shibuya, K. Doi and T. Jike (2002): difference between Tokyo and Melbourne, Bulletin of22 Bulletin of the Geographical Survey Institute, Vol.54 March, 2007 the Geographical Survey Institute, 6, 201-211. Moriwaki, K. (ed.) (2000): Gazetteer of eastern Iwano, S., K. Isao and Y. Fukuda (2003): Calibration of Dronning Maud Land, Antarctica First edition, the superconducting gravimeter TT70 #016 at Syowa National Institute of Polar Research. Station by parallel observation with the absolute Murakami, M. and K. Tajima (1982): Transportable gravimeter FG5 #203, Polar geoscience, 16, 22-28. absolute gravity meter, Bulletin of the Geographical Jike, T., T. Tanaka, K. Shibuya, S. Manabe, Y. Tamura, Survey Institute, 27, 1-10. K. Sato, P.M. McCulloch, M. Costa, G.D. Nicolson, Nakagawa, I., S. Nakai, H. Fujimoto, M. Funaki, R. J.F.H. Quick, K.M. Shibata, K. Doi, Y. Fukuzaki, D.L. Shichi, H. Tajima, S. Izutuya, Y. Kono, T. Higashi, M. Jauncey and J. Reynolds (1999): VLBI experiments at Murakami and K. Tajima (1983): Gravimetric Syowa Station, Antarctica, Proceedings of the connection between Tokyo and McMurdo Sound, International workshop on GEodetic Measurements by Memoirs of National Institute of Polar Research, the collocation of Space Tecnique ON Earth Special issue, 28, 70-80. (GEMSTONE), 150-156. Nakada, M., R. Kimura, J. Okuno, K. Moriwaki, H. Jike, T., S. Manabe, Y. Tamura, K. Shibuya, K. Doi, T. Miura and H. Maemoku (2000): Late Pleistocene and Tanaka, P.M. McCulloch, M. Costa, G.D. Nicolson, Holocene melting history of the Antarctic ice sheet J.F.H. Quick, K. Sato, K.M. Shibata, K. Doi, Y. derived from sea-level variations, Marine Geology, Fukuzaki, D.L. Jauncey and J. Reynolds (2002): The 167, 85-103. Antarctic VLBI experiments during JARE39 and Nakawo, M., Y. Ageta and A. Yoshimura (1978): geodetic analyses by the Mitaka FX correlator, Discharce of ice across the Soya Coast, Memoirs of International VLBI Service for Geodesy and National Institute of Polar Research, Special issue, 7, Astrometry 2002 General Meeting Proceedings, 235-244. 324-328, NASA/CP-2002-210002. Nakawo, M., H. Narita and T. Isobe (1984): G Jike, T., Y. Fukuzaki, K. Shibuya, K. Doi, S. Manabe, laciological research program in East Queen Maud D.L. Jauncey, G.D. Nicolson and P.M. McCulloch Land, East Antarctica, Part 2, 1983, JARE data reports, (2005): The First Year of Antarctic VLBI observations, 96 (Glaciology 11), 1-82. Polar Geoscience, 18, 26-40. Naruse, R., A. Yoshimura and H. Shimizu (1972): Kakinuma, S. and T. Ishida (1971): Geomagnetic survey Installation of triangulation chain and a traverse along the traverse route Syowa-South Pole, Japanese survey line on the ice sheet in the Mizuho Antarctic Research Expedition scientific reports, Plateau-West Enderby Land Area, east Antarctica, Special issue, 2, 151-182. 1969-1970, JARE data reports, 17(Glaciology 1), Kakinuma, S., T. Oguti and S. Kokubun (1971): 111-131. Latitudinal survey of VLF emissions during the JARE Nogi, Y., N. Seama, N. Isezaki, T. Hayashi and K. South Pole Traverse 1968-69, Japanese Antarctic Kaminuma (1991): Vector anomalies of the Research Expedition scientific reports, Special issue, 2, geomagnetic field around the Kerguelen Plateau, 183-187. Proceedings of the NIPR Symposium on Antarctic Kaminuma, K. and I. Kimura (1997): Leveling survey on Geosciences, 5, 160. East Ongul Island, Antarctica and its implications, Ootaki, O. and S. Fujiwara (1998): Measurement of ice Proceedings of NIPR Symposium on Antarctic sheet movement at S16, East Antarctica using GPS, Geosciences, 10, 19-25. Polar Geoscience, 11, 9-13. Kazuo, S., K. Doi, Y. Fukuzaki and M. Iwata (2005): Science Committee on Antarctic Research (1980): Geodesy reference points within Syowa Station, Standard symbols for use on maps of Antarctica Antarctica, and their local geodetic ties, Polar Edition 2, Scientific Committee on Antarctic Research, geoscience, 18, 130-161. Working Group on Geodesy and Cartography.
50 Years of Antarctic Research Expeditions by the Geographical Survey Institute                            23

Shibuya, K., K. Doi, Y. Fukuzaki and M. Iwata (2005):                      Gravimetrique International, 75, 41-56.
  Geodesy reference points within Syowa Station,                        Yamada, A., K. Maruyama, O. Ootaki, A. Itabashi, Y.
  Antarctica, and their local geodetic ties, Polar                         Hatanaka, S. Miyazaki, H. Negishi, T. Higashi, Y.
  Geoscience, 18, 130-161.                                                 Nogi, M. Kanao and K. Doi (1998): Analysis of GPS
Shimizu, H., R. Naruse, K. Omoto and A. Yoshimura,                         data at Syowa Station and IGS tracking stations, Polar
  (1972): Position of stations, surface elevation and                      Geoscience, 11, 1-8.
  thickness of the ice sheet, and snow temperature at                   Yamada, A., K. Maruyama, O. Ootaki, A. Itabashi, Y.
  10m depth in the Mizuho Plateau-West Enderby Land                        Hatanaka and S. Miyazaki (1998): Wide area analysis
  Area, East Antarctica, 1969-1971, JARE data reports,                     of    GPS      data     in   Antarctica,      Bulletin   of   the
  17 (Glaciology 1), 12-37.                                                Geographical Survey Institute, 44, 37-43.
Shimizu, H., A. Yoshimura, R. Naruse, O. Watanabe, M.                   Yamagishi, H., I. Ayukawa, S. Matsumura, H. Sakurai
  Nakawo and F. Okuhira (1975): Movement of ice                            and N. Sato (1987): Upper atmosphere physics data,
  sheet and glaciers in Soya Coast in 1969-1972, JARE                      Syowa Station, 1985, JARE data reports 128(Upper
  data reports, 27 (Glaciology 2), 162-174.                                atmosphere Physics 5), 1-272.
Shimizu, H., A. Yoshimura, R. Naruse and K. Yokoyama                    Yanai, K. and S. Kakinuma (1971): Measurement of
  (1978): Morphological feature of the ice sheet in                        gravity along the Traverse Route Syowa-South Pole,
  Mizuho Plateau, Memoirs of National Institute of                         Japanese Antarctic Research Expedition scientific
  Polar Research, Special issue, 7, 14-25.                                 reports, Special issue, 2, 131-150.
Takahashi, H. (1983): Preparation of Antarctic maps by                  Yoshida, M. and A. Yoshimura (1972): Gravimetric
  the Geographical Survey Institute, Bulletin of the                       survey in the Mizuho Plateau-West Enderby Land
  Geographical Survey Institute, 28, 64-72.                                Area, East Antarctica, 1969-1971, JARE data reports,
Tazima, M., S. Kakinuma, M. Yoshida, M. Masuda and                         17 (Glaciology 1), 168-203.
  A. Yoshimura (1972): Aeromagnetic survey in the                       Yoshida, M. and A. Yoshimura (1972): Geomagnetic
  vicinity of Lutzow-Holm Bay, Antarctica, Nankyoku                        survey in the Mizuho Plateau-West Enderby Land
  Shiryou, 44, 69-78. (in Japanese)                                        Area, East Antarctica, 1969-1971, JARE data reports,
Tazima, M. and H. Haruyama (1979): Compilation of                          17 (Glaciology 1), 204-217.
  magnetic maps of Antarctic Region for 1975,                           Yoshimura, A., Y. Abe and R. Naruse (1977):
  Memoirs of National Institute of Polar Research,                         Distribution of three geomagnetic components over
  Special issue, 14, 18-27.                                                Mizuho Plateau, Antarctica, Antarctic record, 60,
Working Group for Syowa Station Absolute Gravimetry                        38-46.
  (1994): Absolute gravity measurements at Syowa                        Yoshimura,        A.     and    T.      Kimura   (1975):    Surface
  Station during the Japanese Antarctic Research                           topography of Mizuho Camp area in 1970-1971,
  Expedition,     Bulletin       D'Information,          Bureau            JARE data reports, 27 (Glaciology 2), 175-176.
You can also read


