Google Scholar, Web of Science, and Scopus: a systematic comparison of citations in 252 subject categories - arXiv
←
→
Page content transcription
If your browser does not render page correctly, please read the page content below
Journal of Informetrics (In Print)

Google Scholar, Web of Science, and
Scopus: a systematic comparison of
citations in 252 subject categories
Alberto Martín-Martín 1 , Enrique Orduna-Malea 2                                    , Mike
Thelwall 3 , Emilio Delgado López-Cózar1
Version 1.3
September 3, 2018

Abstract
Despite citation counts from Google Scholar (GS), Web of Science (WoS), and Scopus being
widely consulted by researchers and sometimes used in research evaluations, there is no recent
or systematic evidence about the differences between them. In response, this paper investigates
2,448,055 citations to 2,299 English-language highly-cited documents from 252 GS subject
categories published in 2006, comparing GS, the WoS Core Collection, and Scopus. GS
consistently found the largest percentage of citations across all areas (93%-96%), far ahead of
Scopus (35%-77%) and WoS (27%-73%). GS found nearly all the WoS (95%) and Scopus (92%)
citations. Most citations found only by GS were from non-journal sources (48%-65%), including
theses, books, conference papers, and unpublished materials. Many were non-English (19%-
38%), and they tended to be much less cited than citing sources that were also in Scopus or WoS.
Despite the many unique GS citing sources, Spearman correlations between citation counts in
GS and WoS or Scopus are high (0.78-0.99). They are lower in the Humanities, and lower
between GS and WoS than between GS and Scopus. The results suggest that in all areas GS
citation data is essentially a superset of WoS and Scopus, with substantial extra coverage.

Keywords
Google Scholar; Web of Science, Scopus; bibliographic databases; academic search engines;
coverage; citation analysis; unique citations; citation overlap; bibliometrics; scientometrics

Acknowledgements
Alberto Martín-Martín is funded for a four-year doctoral fellowship (FPU2013/05863) granted by
the Ministerio de Educación, Cultura, y Deportes (Spain). An international mobility grant from
Universidad de Granada and CEI BioTic Granada funded a research stay at the University of
Wolverhampton.

1
  Facultad de Comunicación y Documentación, Universidad de Granada, Granada, Spain.
2
  Universitat Politècnica de València, Valencia, Spain.
3
  Statistical Cybermetrics Research Group, School of Mathematics and Computer Science,
University of Wolverhampton, Wolverhampton, UK.

✉   Alberto Martín-Martín
    albertomartin@ugr.es

            This accepted manuscript is licensed under a CC BY-NC-ND 4.0 license.
1. Introduction
The launch of Google Scholar (GS) in November of 2004 brought the simplicity of Google
searches to the academic environment, and revolutionized the way researchers and the public
searched, found, and accessed academic information. Until that point, the coverage of academic
databases depended on lists of selected sources (usually scientific journals). In contrast, and
using automated methods, Google Scholar crawled the web and indexed any document with a
seemingly academic structure. This inclusive approach gave GS potentially more comprehensive
coverage of the scientific and scholarly literature compared to the two major existing
multidisciplinary databases with selective journal-based inclusion policies, the Web of Science
(WoS) and Scopus (Orduna-Malea, Ayllón, Martín-Martín, & Delgado López-Cózar, 2015).

Although citation data in Google Scholar was originally intended to be a means of identifying the
most relevant documents for a given query, it could also be used for formal or informal research
evaluations. The availability of free citation data in Google Scholar, together with the free software
Publish or Perish (Harzing, 2007) to gather it made citation analysis possible without a citation
database subscription (Harzing & van der Wal, 2008). Nevertheless, GS has not enabled bulk
access to its data, reportedly because their agreements with publishers preclude it (Van Noorden,
2014). Thus, third-party web-scraping software is currently the only practical way to extract more
data from GS than permitted by Publish or Perish.

Despite its known errors and limitations, which are consequence of its automated approach to
document indexing (Delgado López-Cózar, Robinson-García, & Torres-Salinas, 2014; Jacsó,
2010), GS has been shown to be reliable and to have good coverage of disciplines and
languages, especially in the Humanities and Social Sciences, where WoS and Scopus are known
to be weak (Chavarro, Ràfols, & Tang, 2018; Mongeon & Paul-Hus, 2016; van Leeuwen, Moed,
Tijssen, Visser, & Van Raan, 2001). Analyses of the coverage of GS, WoS, and Scopus across
disciplines have compared the numbers of publications indexed or their average citation counts
for samples of documents, authors, or journals, finding that GS consistently returned higher
numbers of publications and citations (Harzing, 2013; Harzing & Alakangas, 2016; Mingers &
Lipitakis, 2010; Prins, Costas, van Leeuwen, & Wouters, 2016). Citation counts from a range of
different sources have been shown to correlate positively with GS citation counts at various levels
of aggregation (Amara & Landry, 2012; De Groote & Raszewski, 2012; Delgado López-Cózar,
Orduna-Malea, & Martín-Martín, 2018; Kousha & Thelwall, 2007; Martín-Martín, Orduna-Malea,
& Delgado López-Cózar, 2018; Meho & Yang, 2007; Minasny, Hartemink, McBratney, & Jang,
2013; Moed, Bar-Ilan, & Halevi, 2016; Pauly & Stergiou, 2005; Rahimi & Chandrakumar, 2014;
Wildgaard, 2015). See the supplementary materials 4 , Delgado López-Cózar et al. (2018),
Orduña-Malea, Martín-Martín, Ayllón, & Delgado López-Cózar (2016), and Halevi, Moed, & Bar-
Ilan (2017) for discussions of the wider strengths and weaknesses of GS.

A key issue is the ability of GS, WoS, and Scopus to find citations to documents, and the extent
to which they index citations that the others cannot find. The results of prior studies are confusing,
however, because they have examined different small (with one exception) sets of articles. A
summary of the results found in these previous studies is presented in Table 1. For example, the
number of citations that are unique to GS varies between 13% and 67%, with the differences
probably being due to the study year or the document types or disciplines covered. The only
multidisciplinary study (Moed et al., 2016) checked articles in 12 journals from 6 subject areas,
which is still a limited set.

4
    Supplementary materials available from https://dx.doi.org/10.31235/osf.io/pqr53

                                                  2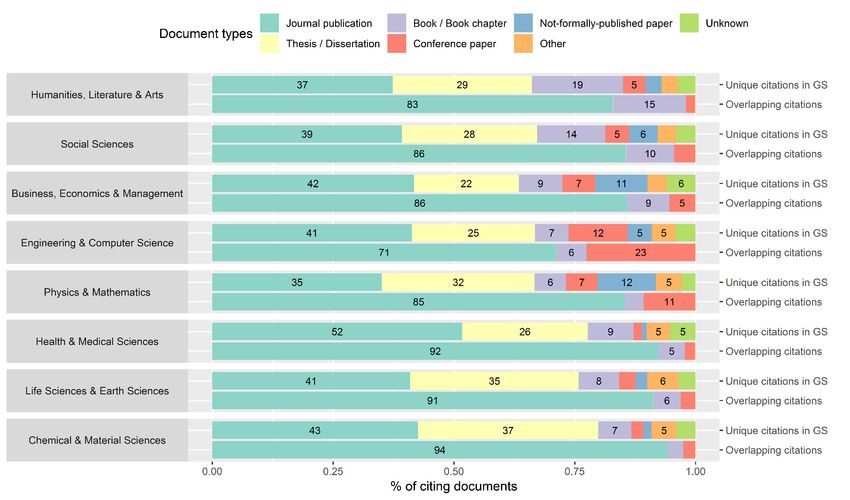
Table 1. Results of studies that analysed unique and overlapping citations in GS, WoS, and Scopus
% % only % only % only % GS & %
N % only % only % GS (all % WoS % WoS cit. in % Scopus
Study Sample only GS & GS & WoS & WoS & Scopus
citations WoS Scopus cit.) (all cit.) GS cit. in GS
GS WoS Scopus Scopus Scopus (all cit.)
50 journal articles covered 215/431 = 220/469 =
614 13 7 12 4 5 28 31 53 70 76
Bakkalbasi, in JCR Oncology 50% 47%
Bauer, Glover, 50 journal articles covered
& Wang (2006) 72/162 =
in JCR Physics, Cond. 296 17 20 8 9 3 22 21 50 72 54 84/212 = 40%
44%
Matter
Scientific production of two
Yang & Meho Library & Information 137/295 = 124/218 =
385 10 23 6 10 7 18 25 52 77 57
(2007) Science (LIST) 46% 57%
researchers
Meho & Yang 1,457 articles published by Only (WoS or GS-(WoS or % (WoS or Scopus) cit. in GS
5,285 48 NA NA 79 38 44
(2007) 25 LIS researchers Scopus): 21 Scopus): 31 1,629/2,733 = 60%
262 WoS-covered Biology 847/1288 =
1,554 17 28 55 72 83
journal articles 66%
276 WoS-covered 218/668 =
729 8 62 30 38 92
Chemistry journal articles 33%
Kousha & 262 WoS-covered Physics 690/1111 =
1,734 36 24 NA 40 NA 76 64 NA NA
Thelwall (2008) journal articles 62%
82 WoS-covered 632/1117 =
3,369 67 14 19 86 33
Computing journal articles 57%
Total WoS-covered journal 2387/4184 =
7,386 43 24 32 76 57
articles (882) 57%
Jacimovic,
158 articles published in 39/85 = 43/94 =
Petrovic, & 249 58 4 6 1 2 15 15 76 34 39
Serbian Dental Journal 46% 46%
Zivkovic (2010)
Book “Introduction to
177/259 = 174/218 =
Bar-Ilan (2010) Informetrics” by L. Egghe 397 27 12 2 6 5 9 39 77 66 55
68% 80%
and R. Rousseau
Lasda Bergman 5 top journals in the field 1042/1741 = 1285/2126 =
4,308 44 5 8 2 8 12 22 76 41 50
(2012) of Social Work 60% 60%
Garfield, E. (1955).
de Winter,
Citation indexes for 453/606 =
Zadpoor, & 1,309 33 41 NA 35 NA 68 76 NA NA
science. Science, 75%
Dodou (2014)
122(3159), 108-111.
Rahimi & 2,082 WoS-covered
20532/31778 25180/37272
Chandrakumar articles in General and 62,900 29 10 11 2 9 8 31 71 51 59
= 65% = 68%
(2014) Internal Medicine
Articles published in 12
Moed, Bar-Ilan, 3246/3651 =
journals from 6 subject 6,941 47 NA 6 NA 47 NA NA 94 NA 53 NA
& Halevi (2016) 89%
areas
NA = not analysed in the study
Cells with more intense background color represent higher percentages of citations within the same sample of documents.
3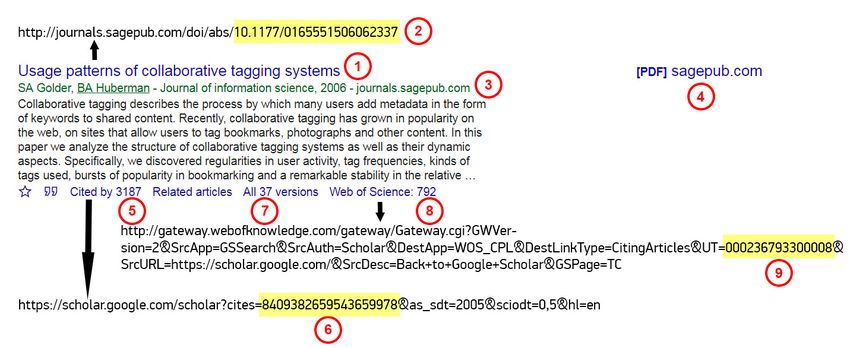
The fields previously compared for citation sources (Table 1) are Library and Information Science
(5 out of 10 articles analyse case studies about LIS documents/journals/researchers), Medicine
(3 papers, analysing oncology, general medicine, and dentistry), Physics (2 articles: general and
condensed matter), Chemistry (2 articles: general and inorganic), Computer Science (2 articles:
general, and computational linguistics), Biology (2 articles: general, and virology), Social Work,
Political Science, and Chinese Studies (1 article each). From this list it is clear that most academic
fields have not been analysed for Google Scholar coverage. The studies used small samples of
documents and citations (9 out of 10 papers analysed less than 10,000 citations), probably
because of the difficulty of extracting data from GS, caused by the lack of a public API (Else,
2018; Van Noorden, 2014). Moreover, the most recent data in these studies was collected in 2015
(three years before the current study), and the oldest data is from 2005 (13 years ago).

Given the limited nature of all prior studies of citing sources for GS and the need to update all
previous research, a comprehensive analysis of citation sources in GS, WoS, and Scopus across
all subject areas is needed. This information is important for those deciding whether to use GS
citation counts for informal or formal research evaluations. The following research questions drive
this investigation.

    RQ1.    How much overlap is there between GS, WoS, and Scopus in the citations that they
            find to academic documents and does this vary by subject?

    RQ2.    Do the citing documents that are only found by GS have a different type to non-unique
            GS citations, and does this vary by subject?

    RQ3.    How similar are citation counts in GS to those found in WoS and Scopus, at the level
            of subjects?

2. Methods
The sample used for this study is taken from GS’s Classic Papers product (GSCP) 5. The 2017
edition of GSCP lists 2,515 highly-cited documents written in English and published in 2006 6.
These documents were classified by GS into 252 subject categories within 8 broad subject areas.
Background about GSCP can be found in Orduna-Malea, Martín-Martín, & Delgado López-Cózar
(2018) and Martín-Martín, Orduna-Malea, & Delgado López-Cózar (2018). This gives a large
sample of highly cited documents classified by subject. This is not a random sample of academic
publications because there is no complete list of these. There is also not a complete list of
documents in GS.

The GSCP sample is suitable because it covers all subject areas and, because the articles are
classified, allows analyses by subject categories. GSCP and Google Scholar Metrics 7 (GSM) are
the only products where GS provides a subject categorization. Taking a sample from one of the
three sources to be compared (GS, Scopus, WoS) is not ideal because it is likely to bias the
results in favour of GS. Nevertheless, the inclusion of 252 categories minimizes the chance of
bias due to a subject area that is not well covered by GS. GS is also a better source than WoS or
Scopus because of its more comprehensive coverage, as found by most prior studies.

2.1. Extraction of data from Google Scholar
The citations to each of the 2,515 GSCP documents were extracted from GS, WoS, and Scopus
between April 22nd and May 6th, 2018. A custom script scraped all the relevant information from
GS SERPs (Search Engine Results Pages) (Figure 1). Searches were submitted from

5
  https://scholar.google.com/citations?view_op=list_classic_articles&hl=en&by=2006
6
  https://osf.io/5zmk7/
7
  https://scholar.google.com/citations?view_op=top_venues&hl=en

                                                  4
Universidad de Granada IP addresses to access the additional information displayed in GS for
WoS subscribers (Clarivate Analytics, 2015). CAPTCHAs were solved manually when GS
requested them. This process found 2,415,072 citations in Google Scholar 8 to the 2,515 highly-
cited documents. The number of citations is reduced to 2,301,997 for the 2,299 highly-cited
documents also covered by WoS and Scopus.

Figure 1. Metadata extracted from Google Scholar

      1. Title of the document.
      2. URL embedded in title of the document. The DOI of the document is sometimes
         embedded in this URL (depending on the host)
      3. Authors, publication venue, publication year, and publisher or web domain that hosts the
         document.
      4. URL to the freely accessible full text of the document, when available.
      5. Times cited according to GS.
      6. URL pointing to list of citing documents according to GS. GS’s internal ID for the
         document is embedded in this URL.
      7. Number of versions of the document found by GS.
      8. Times Cited according to WoS (when the document is also covered by WoS).
      9. URL pointing to list of citing documents in WoS. WoS’s internal ID (UT) for the document
         is embedded in this URL.

The data was processed to clean and enrich the limited metadata available in GS, as follows.

      •   DOI were detected for as many citing documents as possible. The following techniques
          were used, retrieving 1,501,178 DOIs (62%).
              o Extracted from URLs for publishers like Wiley, Springer, and SAGE which embed
                  the DOI in the article’s landing page URL (Figure 1, #2).
              o Looked up with public APIs offered by the publishers (Elsevier, IEEE) or
                  CrossRef 9 (using the alternative-id filter option), when the publisher landing page
                  contained publisher document ID.
              o Extracted from a HTML Meta tag in the webpage from which Google Scholar
                  extracted the document’s metadata.
      •   Metadata was obtained from CrossRef and DataCite APIs when a DOI was available or
          otherwise from HTML Meta tags present in the website hosting the citation, when
          possible.

2.2. Extraction of data from Web of Science and Scopus
Each of the 2,515 highly-cited documents in GSCP was searched for in the WoS (Core Collection)
web interface. The list of citations to each document was extracted (in batches of up to 500

8
    https://osf.io/qg8kb/
9
    https://www.crossref.org/services/metadata-delivery/rest-api/

                                                   5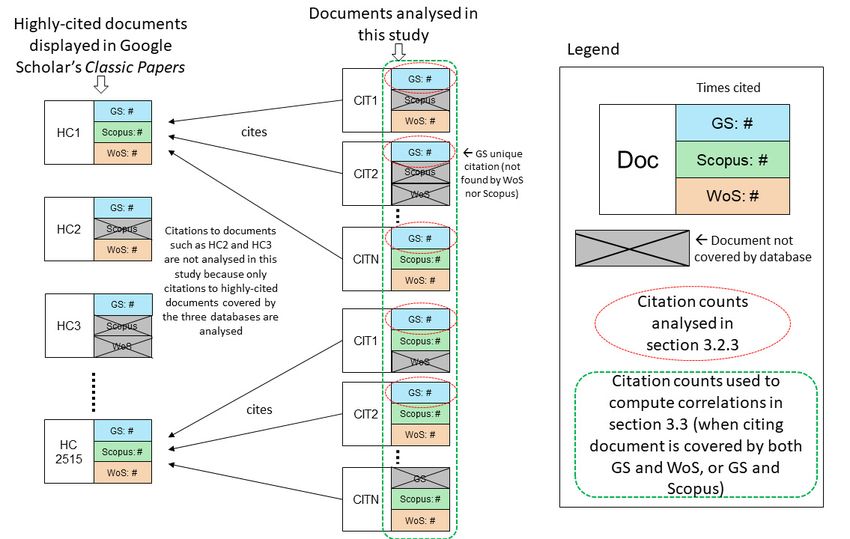
records per download). The exported files were consolidated into a single table using a set of R
functions developed for this purpose (Martín-Martín & Delgado López-Cózar, 2016). Although R
has built-in functions and additional libraries to read tabulated data, none of them seemed to work
with data exported from WoS. A total of 1,270,225 WoS records were collected 10. At the time of
data collection FECYT 11, the Spanish organization that manages the national subscription to
Clarivate Analytics’ services, had not subscribed to the Emerging Sources Citation Index (ESCI)
Backfile for documents published between 2005 and 2014 (Clarivate Analytics, 2017), and so the
results exclude this source.

Each of the 2,515 highly-cited documents in GSCP were also searched for in the Scopus web
interface. This has a limit of 2,000 records when exporting citations. When a highly-cited
document had more than 2,000 citations, these could still be extracted using the alternative email
service, which allows the extraction of up to 20,000 citation records in one go. A total 1,515,436
Scopus records were collected 12.

Most of the highly-cited documents (2,299 out of 2,515) were covered by all three databases, and
the citations to these 2,299 documents are analysed here.

2.3. Identification of document types and languages of citing
documents
Unlike WoS and Scopus, GS does not provide metadata on the document type and the language
of the documents that it covers. The metadata extracted from CrossRef’s API and HTML Meta
tags of the hosting website gave this information for 83% of the citing documents. Adding
metadata from WoS and Scopus increased this percentage to 85%. The following categories were
used.

     •   Journal publication: article, review, letter, editorial…
     •   Conference paper: paper presented at conference, symposium, workshop, society
         meeting…
     •   Book or book chapter: scientific/scholarly monograph
     •   Thesis or dissertation: document presented by student to fulfill the requirements of a
         doctoral, masters’, or bachelor’s degree
     •   Other not-formally-published scientific/scholarly paper: working paper, discussion paper,
         other paper for which no formal publication venue could be found.
     •   Other: report, patent, presentation slides, syllabus, educational materials, errata…
     •   Unknown: document for which no document type could be identified

To identify the distribution of document types in the 15% for which metadata was not available,
eight random samples of 500 citing documents with an unknown document type were selected,
one for each of the broad subject categories in which GSCP are classified. The document types
of these 4,000 citing documents were manually identified by accessing and perusing the full text
of the documents (when possible) or the available metadata. The proportion of document types
found in these random samples were applied as a correction factor to the percentage of citations
with an unknown document type in each broad subject area. For example, in the Social Sciences,
33.5% of the citing documents were classified as journal articles using the available metadata,
but 20% of all citing documents could not be classified with the available metadata. A random
sample of documents from that unknown 20% were selected and analyzed manually, finding that
27.6% of the items in the random sample were journal articles. Therefore, the total percentage of
journal articles in Social Sciences was 33.5% + (27.6% of 20% = 5.5%) = 39%.

The language of 98% of the citing documents was identified by combining data from three sources
(in the order of preference shown below).

10
   https://osf.io/6c7ta/
11
   https://www.fecyt.es/
12
   https://osf.io/n6k9w/

                                                6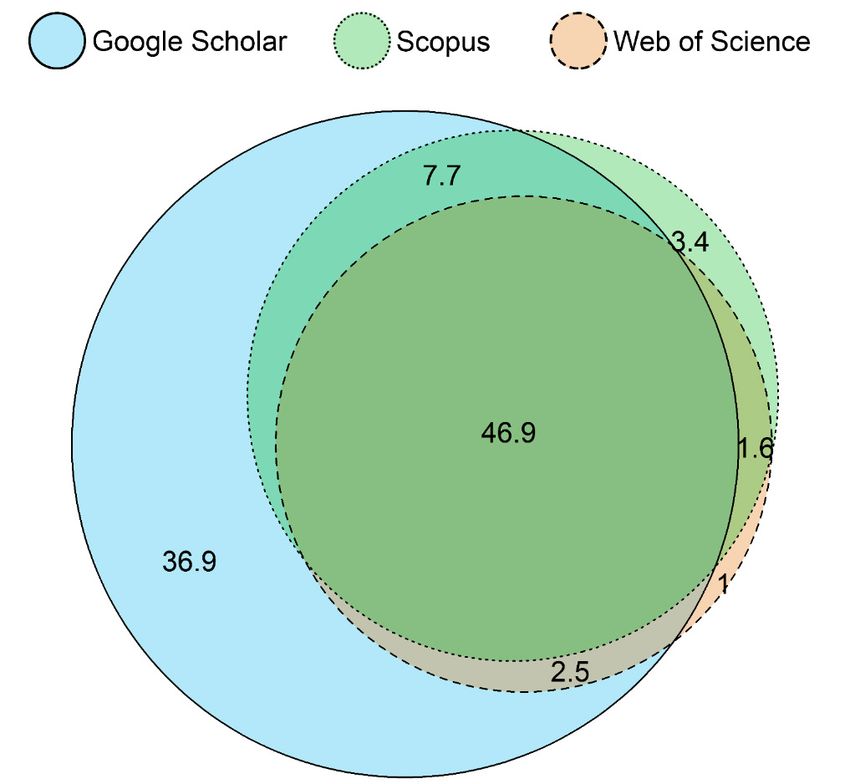
1. Metadata in CrossRef and HTML Meta tags.
      2. Metadata in WoS (Scopus did not provide document language information).
      3. Google’s Compact Language Detector 2 13 applied to the document title.

For RQ1, the citations extracted from GS, WoS and Scopus were matched as follows. Three
pairwise matching processes were carried out: GS–Scopus; GS–WoS; and Scopus–WoS.

      1. For each pair of databases A and B, and a highly-cited document from GSCP X, all
         citing documents with a DOI that cite X according to A where matched to all citing
         documents with a DOI that cite X according to B.
      2. For each of the unmatched documents citing X in A and B, a further comparison was
         carried out. The title of each unmatched document citing X in A was compared to the
         titles of all the unmatched document citing X in B, using the restricted Damerau-
         Levenshtein distance (optimal string alignment) (Damerau, 1964; Levenshtein, 1966).
         The pair of citing documents which returned the highest title similarity (1 is perfect
         similarity) was selected as potential matches. This match was considered successful if
         either of the following conservative heuristics was met.
              o The title similarity was at least 0.8, and the citing document title was at least 30
                   characters long (to avoid matches between titles like “Introduction”).
              o The title similarity was at least 0.7, and the first author of the citing document
                   was the same in A and B.

For RQ2, the document types, languages, and citation counts of the citing documents in our
sample (see Figure 2) were aggregated or averaged by GSCP broad subject areas, differentiating
between unique GS citations and overlapping citations.

For RQ3, Spearman correlation coefficients were calculated for the citation counts of the citing
documents in our sample (GS-WoS, and GS-Scopus), by subject category. Correlation
coefficients are considered useful in high-level exploratory analyses to check whether different
indicators reflect the same underlying causes (Sud & Thelwall, 2014). In this case, however, the
goal is to find out whether the same indicator, based on different data sources, provides similar
relative values. Spearman correlations were used because it is well-known that the distributions
of citation counts and other impact-related metrics are highly skewed (De Solla Price, 1976). For
the GS-WoS comparison, WoS subject categories and (for an additional check) the NOWT
classification (Tijssen et al., 2010) were used. For the GS-Scopus comparison, the ASJC (All
Science Journal Classification) available in the Scopus source list (Elsevier, 2018) was used.

To carry out all these processes, the R programming language (R Core Team, 2014), and several
R packages and custom functions were used (Dowle et al., 2018; Larsson et al., 2018; Martín-
Martín & Delgado López-Cózar, 2016; Ooms & Sites, 2018; van der Loo, van der Laan, R Core
Team, Logan, & Muir, 2018; Walker & Braglia, 2018; Wickham, 2016). The resulting data files are
openly available 14.

13
     https://github.com/CLD2Owners/cld2
14
     https://osf.io/gnb72/

                                                  7
Figure 2. Visual representation of the documents and citation counts analysed in this
study
3. Results
3.1. RQ1: Citing source overlap
Overall, 46.9% of all citations were found by the three databases (Figure 3). GS found the most
citations, including most of the citations found by WoS and Scopus. In contrast, only 6% of all
citations were found by WoS and/or Scopus, and not by GS. An additional 10.2% of all citations
were found by both GS and Scopus (7.7%), or GS and WoS (2.5%). Over a third (36.9%) of all
citations were only found by GS.
Figure 3. Percentage of unique and overlapping citations in google scholar, Scopus,
and Web of Science. n = 2,448,055 citations from all subject areas
8When citations are disaggregated by the broad subject area in which the cited document was
classified according to GSCP, important differences emerge (Figure 4). In Humanities, Literature
& Arts, Social Sciences, and Business, Economics & Management the proportion of unique GS
citations is well over 50% of all citations, surpassing 60% in the case of Business, Economics &
Management. In these categories the proportion of citations found by all three databases ranges
from 21.4% (Humanities, Literature & Arts) to 29.8% (Social Sciences). On the other hand, in
Engineering & Computer Science, Physics & Mathematics, Health & Medical Sciences, Life
Sciences & Earth Sciences, and Chemical & Material Sciences, the proportion of unique GS
citations is much lower (20.3% - 34.3%), and the overlap is higher: percentages of citations found
by all three databases range from 46.8% (Engineering & Computer Science) to 67.7% (Chemical
& Material Sciences).
For the 252 specific subject categories (data and figures for each category are available in the
supplementary materials 15 ), there are more extreme differences (Figure 5). The highest
percentages of unique citations in GS (over 70% of all citations) are found in Educational
Administration 16, Foreign Language Learning 17, Chinese Studies & History 18, and Finance 19. On
the other hand, the highest percentages of overlap in the three databases (over 70% of all
citations) are found in Crystallography & Structural Chemistry 20, Molecular Modeling 21, Polymers
& Plastics 22, and Chemical Kinetics & Catalysis 23.
15
https://osf.io/t3sxh/
16
https://osf.io/xfepy/
17
https://osf.io/wk6se/
18
https://osf.io/q8k3u/
19
https://osf.io/56azc/
20
https://osf.io/ysg2j/
21
https://osf.io/cq8j6/
22
https://osf.io/4jwta/
23
https://osf.io/9hmf3/
9Figure 4. Percentage of unique and overlapping citations in Google Scholar,
Scopus, and Web of Science, by broad subject area of cited documents
10Figure 5. Categories with many unique citations or many overlapping citations
11Overall, GS found 94% of all citations (93%-96% depending on the area), while WoS found 52%
(ranging from 27% in Humanities, Literature & Arts, to 73% in Chemical & Material Sciences), and
Scopus 60% (from 35% in Business, Economics & Management, to 77% in Chemical & Material
Sciences). Additionally, GS found 95% of the citations that WoS found (88%-97% depending on
the area), and 92% of the citations that Scopus found (84-94%) (Table 2). The data also shows
that Scopus found 93% of the citations that Web of Science found (83-96% depending on the
area).
Table 2. Percentage of citations in Google Scholar, Web of Science, and Scopus,
relative to all citations, and relative to citations found by other databases
% % % WoS
% GS % WoS % WoS
Scopus Scopus cit. in
(all cit.) (all cit.) cit. in GS
(all cit.) cit. in GS Scopus
Overall 94 52 60 95 92 93
Humanities, Literature & Arts 93 27 36 88 84 83
Social Sciences 94 35 43 93 89 89
Business, Economics &
96 28 35 93 92 89
Management
Engineering & Computer
93 52 63 94 90 94
Science
Physics & Mathematics 96 59 64 97 94 94
Health & Medial Sciences 94 54 62 95 91 93
Life Sciences & Earth Sciences 95 62 67 96 93 95
Chemical & Material Sciences 94 73 77 95 94 96
The results for the 252 specific subject categories (available in the supplementary materials 24)
show that GS covers at least 90% of all citations in 233 out of 252 categories, the lowest value
being 77% in Visual Arts 25, and the highest values around 98% in Crystallography & Structural
Chemistry 26, Evolutionary Biology 27, Quantum Mechanics 28, and Astronomy & Astrophysics 29.
Relative to the coverage of WoS and Scopus, GS finds at least 90% of the citations that WoS and
Scopus find in 221 and 164 categories, respectively, the lowest values belonging to the
Humanities, such as Film 30, Visual Arts 31, and History 32 (56%-68%).
3.2. RQ2. Unique and non-unique citations
3.2.1. Document types
The distribution of document types of unique GS citations greatly differs from that of citations that
were also found by WoS and/or Scopus. This is true across all eight broad subject categories
(Figure 6). Among non-unique citations, the most common document type by far is the journal
publication (from 71% in Engineering & Computer Science, to 94% in Chemical & Material
Sciences). The other document types present among non-unique citations are books / book
chapters and conference papers, with levels varying by subject area. Among unique GS citations,
however, there is more document type diversity (including many never indexed by WoS or
Scopus). Although journal publications are still the single most frequent document type, other
document types comprise over 50% in all subject areas except Health & Medical Sciences (48%).
The most frequent non-journal document type is the thesis or dissertation (22% in Business,
24
https://osf.io/t3sxh/
25
https://osf.io/7ea63/
26
https://osf.io/ysg2j/
27
https://osf.io/javkb/
28
https://osf.io/cr3k2/
29
https://osf.io/wmn8c/
30
https://osf.io/7dkm3/
31
https://osf.io/7ea63/
32
https://osf.io/fgrp4/
12Economics & Management – 37% in Chemical & Material Sciences), followed by books and book
chapters (especially in Humanities, Literature & Arts and Social Sciences). This trend is different
in Engineering & Computer Science, where conference papers are more common than books,
and in Business, Economics & Management and Physics & Mathematics, where unpublished
scholarly papers (such as working papers and preprints) are also more frequently used than
books for scientific communication.
Considering the 252 specific subject categories 33, the percentage of known document types other
than journal articles in the unique GS citations ranges from approx. 10% in Nonlinear Science,
Heart & Thoracic Surgery, Natural Medicines & Medicinal Plants, and Oral & Maxillofacial
Surgery, to over 55% in Special Education, and Computer Hardware & Design. However, unlike
in the analysis by broad subject categories, a correction factor has not been applied (because no
random samples were selected and analysed at this level), and therefore the document types of
a large percentage of the citations are unknown (from approx. 20% in Special Education, and
Ethnic & Cultural Studies, to over 50% in Quantum Mechanics, Geometry, and Algebra).
Figure 6. Distribution of document types among unique and overlapping citations in
Google Scholar, by broad subject area of cited documents
Considering the citations found by WoS and/or Scopus which GS did not find (the citing document
might be covered by GS without it making the connection between citing and cited document),
most are from journals (Figure 7). Out of the 63,393 citations found by WoS and not by GS (5%
of all citations), 41,052 (64% of the WoS citations that GS misses, or 3.2% of all citations analysed
in this study) are from journals. Among citations from journal publications, there are more that
were published in journals ranked in Q1 and Q4 of their respective JCR categories (0.9% and 1%
of all citations), than in Q2 and Q3 (0.6% and 0.5%, respectively). The remaining missing citations
come from books or book chapters (19% of WoS citations missing from GS, and 1% of all
citations), and conference papers (15% of WoS citations missing from GS, and 0.8% of all
citations). The proportions of Scopus citations missing from GS relative to the number of missing
citations in GS (136,608) are very similar to those in WoS: 68% of journal publications, 19% books
or book chapters, and 13% of conference papers. In this case, the proportion of Scopus citations
missing from GS is 9%.
33
https://osf.io/s5ndm/
13Figure 7. Proportion of document types among citations found by WoS and Scopus,
and not by GS
3.2.2. Languages
The distribution of languages among the unique GS citations is very different from that of non-
unique citations (Figure 8). Whilst for non-unique citations nearly all documents (97%-100%) were
published in English, for unique GS citations the percentage ranges from 62% (Health & Medical
Sciences) to 80% (Humanities, Literature & Arts). This is even though all documents in GSCP
were published in English. The second most frequent language of unique GS citations was
Chinese (4%-12%), and all other languages have a share of 4% or lower across all subject areas.
A few (5%-10%) unique GS citations were published in languages outside the top 11 most
frequently used languages overall (for all citations in our sample).
At the level of the 252 specific subject categories 34, the categories with a large proportion of non-
English unique GS citations are Geochemistry & Mineralogy (59%), Surgery (56%), Radar,
Positioning & Navigation (55%), and Cardiology (53%), whereas the categories with the lowest
34
https://osf.io/xuz6w/
14share of non-English citations are Astronomy & Astrophysics (10%), High Energy & Nuclear
Physics (11%), Quantum Mechanics (11%), and Computer Hardware Design (11%).
Figure 8. Distribution of languages among unique and overlapping citations in
Google Scholar, by broad subject area of cited documents
3.2.3. Citation counts
This section analyses the Google Scholar citation counts of the 2,301,997 citing documents
extracted from Google Scholar. The distributions of log-transformed (ln(1+x) to reduce skewing)
citation counts among unique GS citations, and overlapping citations (those also found by WoS
and/or Scopus) are different (Figure 9). Across all subject areas, the median log-transformed
citation count is always zero and lower than the median of log-transformed citation counts of non-
unique citations. The 95% confidence interval for the mean (represented as a red box in Figure
9) is also significantly lower for unique GS citations than for non-unique citations. Both unique
and non-unique citations include many outliers (blue dots in Figure 9). The same pattern occurs
across the 252 specific subject categories 35, although there are 29 categories in which the median
of the citation counts for the unique GS citations is higher than zero (but still lower than the median
for overlapping citations).
35
https://osf.io/pm3xh/
15Figure 9. Distribution of citation counts among unique and overlapping citations in
google scholar, by broad subject area of cited document
3.3. RQ3. Citation count comparisons
Spearman correlations between citation counts (GS-WoS, GS-Scopus) are close to 1.0 in most
subject categories (Table 3 and Table 4). Correlations between GS and WoS range from .78 in
Literature, to .98 in Basic Life Sciences, Biomedical Sciences, Chemistry and Chemical
Engineering, and Multidisciplinary journals. In 30 out of the 35 areas of research in the NOWT
classification (Tijssen et al., 2010), the Spearman correlation coefficient is over .90. Correlations
between Google Scholar and Scopus are even stronger. The weakest correlation is .92 in
Economics, Econometrics, and Finance, and the strongest is .99 in Chemical Engineering,
Immunology and Microbiology, and Multidisciplinary. In 20 out of 27 categories in the ASJC
scheme, correlation coefficients are above .95. The supplementary materials contain tables of
citation count correlations computed at the level of the 252 WoS subject categories 36, and the
330 ASJC low-level categories 37, which give broadly comparable results. The weakest statistically
significant correlation between GS and WoS at this level 38 is in Medieval & Renaissance Studies
(.69), while the weakest correlation between GS and Scopus 39 is .74 in Classics.
On average, GS finds more citations than WoS and Scopus across all categories (see mean
citation ratios in Table 3 and Table 4). This effect holds even when citation counts are log-
transformed (1+ln(citations)) to reduce skewness. An inverse relationship between strength of
correlation coefficients and mean citation ratios of GS over WoS/Scopus is observed. Strong
correlation coefficients are associated with lower mean ratios, and vice versa.
36
https://osf.io/x6mw7/
37
https://osf.io/4pf9z/
38
https://osf.io/x6mw7/
39
https://osf.io/4pf9z/
16Table 3. Spearman correlation coefficients, mean ratio, and mean log-transformed
citation counts of citing documents between GS and WoS, by subject category
Mean ratio of Mean ln(1+citations)
Category (NOWT) N r citation counts GS WoS
GS/WoS 0 0.75 1.5 2.25 3
Agriculture and Food Science 24,176 .97 1.74
Astronomy and Astrophysics 16,090 .96 1.60
Basic Life Sciences 134,045 .98 1.58
Basic Medical Sciences 23,183 .96 1.76
Biological Sciences 62,094 .97 1.90
Biomedical Sciences 118,817 .98 1.72
Chemistry and Chemical Engineering 129,481 .98 1.30
Civil Engineering and Construction 5,145 .95 1.87
Clinical Medicine 223,309 .97 1.82
Computer Sciences 61,199 .86 3.21
Creative Arts, Culture and Music 1,145 .84 2.80
Earth Sciences and Technology 46,536 .95 1.99
Economics and Business 28,550 .93 3.30
Educational Sciences 13,227 .92 2.92
Electrical Engineering and Telecommunication 68,462 .83 3.18
Energy Science and Technology 19,242 .95 1.86
Environmental Sciences and Technology 64,791 .97 1.86
General and Industrial Engineering 10,757 .92 2.37
Health Sciences 28,371 .95 2.11
History, Philosophy and Religion 5,062 .90 3.15
Information and Communication Sciences 6,214 .94 2.87
Instruments and Instrumentation 6,167 .95 1.74
Language and Linguistics 3,149 .90 3.12
Law and Criminology 4,348 .90 3.37
Literature 368 .78 4.02
Management and Planning 18,477 .94 2.83
Mathematics 17,187 .91 2.65
Mechanical Engineering and Aerospace 17,006 .91 2.24
Multidisciplinary Journals 44,299 .98 1.63
Physics and Materials Science 144,010 .97 1.52
Political Science and Public Administration 8,118 .90 3.22
Psychology 32,875 .95 2.50
Social and Behavioral Sciences, Interdisciplinary 7,001 .93 2.77
Sociology and Anthropology 11,504 .93 2.82
Statistical Sciences 12,955 .92 3.16
Confidence level of Spearman correlations: 99%; p-values < 0.01
Highest and lowest values of Spearman correlations and mean citation ratios are highlighted in
bold
17Table 4. Spearman correlation coefficients, mean ratio, and mean log-transformed
citation counts of citing documents between GS and Scopus, by subject category
Mean ratio of Mean ln(1+citations)
Category (ASJC) N r citation counts GS Scopus
GS/Scopus 0 0.75 1.5 2.25 3
Agricultural and Biological Sciences 109,423 .98 1.45
Arts and Humanities 21,698 .95 2.19
Biochemistry, Genetics and Molecular Biology 216,180 .99 1.43
Business, Management and Accounting 40,539 .94 2.43
Chemical Engineering 56,569 .99 1.27
Chemistry 118,885 .99 1.23
Computer Science 135,932 .94 1.72
Decision Sciences 13,557 .94 2.04
Dentistry 3,933 .97 1.78
Earth and Planetary Sciences 52,356 .97 1.49
Economics, Econometrics and Finance 22,273 .93 2.83
Energy 31,166 .98 1.35
Engineering 146,545 .96 1.49
Environmental Science 66,212 .98 1.50
Health Professions 12,309 .96 1.79
Immunology and Microbiology 50,615 .99 1.44
Materials Science 108,794 .98 1.27
Mathematics 66,239 .94 1.78
Medicine 361,217 .97 1.56
Multidisciplinary 18,851 .99 1.43
Neuroscience 46,462 .98 1.55
Nursing 19,431 .96 1.80
Pharmacology, Toxicology and Pharmaceutics 38,377 .98 1.42
Physics and Astronomy 126,820 .97 1.42
Psychology 42,037 .96 2.09
Social Sciences 81,542 .94 2.22
Veterinary 4,550 .98 1.47
Confidence level of Spearman correlations: 99%; p-values < 0.01
Highest and lowest values of Spearman correlations and mean citation ratios are highlighted in
bold
184. Discussion
4.1. Limitations
This study analyses a large sample of citations to highly-cited documents from all subject areas
published in English. In order to generalize the results to all articles, it must be assumed that the
population of documents that cite highly cited articles is not significantly different from the general
population of documents that cite articles. This may not be fully true since, for example, highly
cited articles are presumably more likely to be in emerging research areas and larger specialisms.
Furthermore, the results may not reflect the citation coverage (in GS, WoS, and Scopus) of
documents that do not usually cite scientific literature written in English, such as documents that
address locally or regionally relevant topics written in vernacular languages.
Because the highly-cited documents from which our sample of citations came were all initially
selected from Google Scholar, this might have provided an advantage to GS in the comparisons:
GS might be better suited than WoS or Scopus to find citations for these specific documents, for
unknown reasons. Nevertheless, the high citation count correlations found in section 3.3 suggest
that this advantage is not substantial, as the three databases provide essentially the same citation
rankings at the document level in most subject categories.
Without access to Clarivate Analytics’ recently created ESCI Backfile for documents published
between 2005 and 2014, an unknown number of citations in this study are listed as found only by
GS and/or Scopus, when they are also captured by ESCI. Thus, the results should not be
interpreted as applying to all possible WoS data.
Additionally, this article describes a methodology to match citations in GS, WoS, and Scopus at
the level of cited articles. The rules chosen to classify a potential match as successful were
intentionally conservative to minimize false positives (citations that are matched by the algorithm,
despite being different). The matching algorithm probably created some false negatives (citations
not matched by the algorithm, despite being the same), especially in categories where DOIs are
less widely used and the matching had to rely more frequently on strict title similarity rules. Thus,
in some cases the percentages of unique citations might be lower, and percentages of overlaps
higher, than reported here.
4.2. Comparison with previous studies
The data from previous studies (Table 1) reveal a growth over time in the coverage of citations in
GS. While these studies reported that GS could find 38%-94% of all citations found by any source,
depending on the discipline(s) of study and the sample analysed, the current study finds values
that are higher and more consistent across subject areas. The results here are more similar to
those of the most recent study (Moed et al., 2016) and least similar to the earliest studies
(Bakkalbasi et al., 2006; Kousha & Thelwall, 2008; Meho & Yang, 2007; Yang & Meho, 2007).
For example, GS found 94.3% of all citations to GSCP in Chemical & Material Sciences. Although
not fully comparable, this figure greatly differs from the 38% of all Chemistry citations found by
GS that Kousha & Thelwall (2008) reported. This is evidence that the citation coverage of GS has
become much more comprehensive over time. On the other hand, the more recent study by Moed
et al., (2016) found that GS contained 94% of all citations in their sample, which is the same as
the current study.
The percentages of WoS and Scopus citations that GS could find are generally higher in the
current study than previously reported. While prior studies varied greatly depending on the sample
(33%-75% of WoS citations, and 44%-89% of Scopus citations), in the current paper GS found
88%-97% of WoS citations, and 84%-94% of Scopus citations (depending on the area). This high
relative overlap is a partial cause of the high correlations for citation counts between GS and
WoS, and GS and Scopus, found by Martín-Martín et al. (2018). Lastly, this study reports lower
percentages of unique citations in WoS (up to 1.9% of all citations) and Scopus (up to 4.3%) than
reported in previous studies (up to 23% 40 in WoS, and 12% in Scopus).
40
Considering studies that analysed the three databases (GS, WoS, and Scopus)
19Regarding the distribution of document types and languages of GS unique citations, there were
substantial percentages of theses and dissertations (from 22% in Business, Economics &
Management, to 37% in Chemical & Material Sciences). These are larger than those found by
Kousha & Thelwall (2008), Bar-Ilan (2010), and Lasda Bergman (2012), which found that up to
14% of GS unique citations belonged to this category. In the case of books and book chapters
(from 7% in Chemical & Material Sciences to 19% in Humanities, Literature & Arts), conference
proceedings (especially in Engineering & Computer Science: 12%), and unpublished materials
such as preprints (11% in Business, Economics & Management, and 12% in Physics and
Mathematics), the results are closer to those found by previous studies. The results also show a
predominance of English for the citing sources, followed by Chinese (4%-12% depending on the
source). These are similar to the results in Kousha & Thelwall (2008) in that Chinese is the second
most used language in the sample of citations, although their study found very different
percentages (approx. 35% in Biology, 25% in Chemistry, and less than 5% in Physics and
Computing).
Lastly, the citation correlations between GS and WoS range from .78 in Literature, to .98 in Basic
Life Sciences, Biomedical Sciences, Chemistry and Chemical Engineering, and Multidisciplinary
journals, and the correlations between GS and Scopus range from .92 to .99. These correlations
are similar to some in previous studies (Amara & Landry, 2012; Delgado López-Cózar et al., 2018;
Martín-Martín et al., 2018; Minasny et al., 2013) but somewhat stronger than the ones found by
others (De Groote & Raszewski, 2012; Kousha & Thelwall, 2007; Meho & Yang, 2007; Moed et
al., 2016; Pauly & Stergiou, 2005; Rahimi & Chandrakumar, 2014; Wildgaard, 2015). This may
be due to the disciplines of previous studies or the use of more recent data in the current paper.
5. Conclusions
This study provides evidence that GS finds significantly more citations than the WoS Core
Collection and Scopus across all subject areas. Nearly all citations found by WoS (95%) and
Scopus (92%) were also found by GS, which found a substantial amount of unique citations that
were not found by the other databases. In the Humanities, Literature & Arts, Social Sciences, and
Business, Economics & Management, unique GS citations surpass 50% of all citations in the
area.
About half (48%-65%, depending on the area) of GS unique citations are not from journals but
are theses/dissertations, books or book chapters, conference proceedings, unpublished materials
(such as preprints), and other document types. These unique citations are primarily written in
English, although a significant minority (19%-38% depending on the area) are in other languages.
The scientific impact of these unique citations themselves is, on average, much lower than that
of citations also found by WoS or Scopus, suggesting that the GS coverage advantage is mostly
for low impact documents. Taken together, these results suggest caution if using GS instead of
WoS or Scopus for citation evaluations. Without evidence, it cannot be assumed that the higher
citation counts of GS are always superior to those of WoS and Scopus, since it is possible that
the inclusion of lower quality citing documents reduces the extent to which citation counts reflect
scholarly impact. For example, some of the citations from Master’s theses may reflect educational
impact. Therefore, depending on the type of evaluation that needs to be carried out, it might be
necessary to remove certain types of citing documents from the citation counts, as suggested by
Prins et al. (2016).
Spearman correlations between GS and WoS, and GS and Scopus citation counts are very strong
across all subject categories but weaker in the Humanities (GS-WoS, Literature: .78) and
Engineering (GS-WoS, Electrical Engineering and Telecommunication: .83). Also, correlations
between GS and WoS (.78 to .98) are weaker than between GS and Scopus (.92 to .99). The
weakest correlations are in the categories where there is a greater difference between the citation
counts provided by GS, and the citation counts provided by WoS/Scopus. Thus, if GS is used for
research evaluations then its data would be unlikely to produce large changes in the results,
despite the additional citations found. It would be particularly useful when there is reason to
believe that documents not covered by WoS or Scopus are important for an evaluation.
20In conclusion, this study gives the first systematic evidence to confirm prior speculation (Harzing,
2013; Martín-Martín et al., 2018; Mingers & Lipitakis, 2010; Prins et al., 2016) that citation data in
GS has reached a high level of comprehensiveness, because the gaps of coverage in GS found
by the earliest studies that analysed GS data have now been filled. It surpasses WoS and Scopus
numerically in all areas of research, and is greatly superior in the areas where WoS and Scopus
have a poor coverage, including the Social Sciences and Humanities. However, at this point there
is no reliable and scalable method to extract data from GS, and the metadata offered by the
platform is still very limited, reducing the practical suitability of this source for large-scale citation
analyses, although manual data collection is possible for small scale uses. Nevertheless,
providing that a reliable method to extract citation data can be found, the lack of metadata could
be solved by combining GS citation data with rich openly accessible data, such as that provided
by CrossRef.
References
Amara, N., & Landry, R. (2012). Counting citations in the field of business and management:
why use Google Scholar rather than the Web of Science. Scientometrics, 93(3), 553–581.
https://doi.org/10.1007/s11192-012-0729-2
Bakkalbasi, N., Bauer, K., Glover, J., & Wang, L. (2006). Three options for citation tracking:
Google Scholar, Scopus and Web of Science. Biomedical Digital Libraries, 3(1), 7.
https://doi.org/10.1186/1742-5581-3-7
Bar-Ilan, J. (2010). Citations to the “Introduction to informetrics” indexed by WOS, Scopus and
Google Scholar. Scientometrics, 82(3), 495–506. https://doi.org/10.1007/s11192-010-
0185-9
Chavarro, D., Ràfols, I., & Tang, P. (2018). To what extent is inclusion in the Web of Science an
indicator of journal ‘quality’? Research Evaluation, 27(2), 106–118.
https://doi.org/10.1093/reseval/rvy001
Clarivate Analytics. (2015). Web of Science & Google Scholar collaboration. Retrieved June 5,
2018, from http://wokinfo.com/googlescholar/
Clarivate Analytics. (2017). Emerging Sources Citation Index Backfile (2005-2014). Retrieved
from https://clarivate.com/wp-content/uploads/2017/10/M255-Crv_SAR_ESCI-infographic-
FA.pdf
Damerau, F. J. (1964). A technique for computer detection and correction of spelling errors.
Communications of the ACM, 7(3), 171–176. https://doi.org/10.1145/363958.363994
De Groote, S. L., & Raszewski, R. (2012). Coverage of Google Scholar, Scopus, and Web of
Science: a case study of the h-index in nursing. Nursing Outlook, 60(6), 391–400.
https://doi.org/10.1016/j.outlook.2012.04.007
De Solla Price, D. (1976). A general theory of bibliometric and other cumulative advantage
processes. Journal of the American Society for Information Science, 27(5), 292–306.
https://doi.org/10.1002/asi.4630270505
de Winter, J. C. F., Zadpoor, A. A., & Dodou, D. (2014). The expansion of Google Scholar
versus Web of Science: a longitudinal study. Scientometrics, 98(2), 1547–1565.
https://doi.org/10.1007/s11192-013-1089-2
Delgado López-Cózar, E., Orduna-Malea, E., & Martín-Martín, A. (2018). Google Scholar as a
data source for research assessment. In W. Glaenzel, H. Moed, U. Schmoch, & M.
Thelwall (Eds.), Springer Handbook of Science and Technology Indicators. Springer.
Delgado López-Cózar, E., Robinson-García, N., & Torres-Salinas, D. (2014). The Google
scholar experiment: How to index false papers and manipulate bibliometric indicators.
21Journal of the Association for Information Science and Technology, 65(3), 446–454.
https://doi.org/10.1002/asi.23056
Dowle, M., Srinivasan, A., Gorecki, J., Chirico, M., Stetsenko, P., Short, T., … Parsonage, H.
(2018). data.table: Extension of “data.frame.” Retrieved from https://cran.r-
project.org/package=data.table
Else, H. (2018, April 11). How I scraped data from Google Scholar. Nature.
https://doi.org/10.1038/d41586-018-04190-5
Elsevier. (2018). Scopus source list (April 2018). Retrieved from
https://www.elsevier.com/__data/assets/excel_doc/0015/91122/ext_list_April_2018_2017_
Metrics.xlsx
Halevi, G., Moed, H., & Bar-Ilan, J. (2017). Suitability of Google Scholar as a source of scientific
information and as a source of data for scientific evaluation—Review of the Literature.
Journal of Informetrics, 11(3), 823–834. https://doi.org/10.1016/J.JOI.2017.06.005
Harzing, A.-W. (2013). A longitudinal study of Google Scholar coverage between 2012 and
2013. Scientometrics, 98(1), 565–575. https://doi.org/10.1007/s11192-013-0975-y
Harzing, A.-W., & Alakangas, S. (2016). Google Scholar, Scopus and the Web of Science: a
longitudinal and cross-disciplinary comparison. Scientometrics, 106(2), 787–804.
https://doi.org/10.1007/s11192-015-1798-9
Harzing, A. W. (2007). Publish or Perish. Retrieved from http://www.harzing.com/pop.htm
Harzing, A. W. K., & van der Wal, R. (2008). Google Scholar as a new source for citation
analysis. Ethics in Science and Environmental Politics, 8(1), 61–73.
https://doi.org/10.3354/esep00076
Jacimovic, J., Petrovic, R., & Zivkovic, S. (2010). A citation analysis of Serbian Dental Journal
using Web of Science, Scopus and Google Scholar. Stomatoloski Glasnik Srbije, 57(4),
201–211. https://doi.org/10.2298/SGS1004201J
Jacsó, P. (2010). Metadata mega mess in Google Scholar. Online Information Review, 34(1),
175–191. https://doi.org/10.1108/14684521011024191
Kousha, K., & Thelwall, M. (2007). Google Scholar citations and Google Web/URL citations: A
multi-discipline exploratory analysis. Journal of the American Society for Information
Science and Technology, 58(7), 1055–1065. https://doi.org/10.1002/asi.20584
Kousha, K., & Thelwall, M. (2008). Sources of Google Scholar citations outside the Science
Citation Index: A comparison between four science disciplines. Scientometrics, 74(2),
273–294. https://doi.org/10.1007/s11192-008-0217-x
Larsson, J., Godfrey, A. J. R., Kelley, T., Eberly, D. H., Gustafsson, P., & Huber, E. (2018).
eulerr: Area-Proportional Euler and Venn Diagrams with Circles or Ellipses. Retrieved from
https://cran.r-project.org/package=eulerr
Lasda Bergman, E. M. (2012). Finding Citations to Social Work Literature: The Relative Benefits
of Using Web of Science, Scopus, or Google Scholar. The Journal of Academic
Librarianship, 38(6), 370–379. https://doi.org/10.1016/j.acalib.2012.08.002
Levenshtein, V. I. (1966). Binary codes capable of correcting deletions, insertions, and
reversals. In Soviet physics doklady (Vol. 10, pp. 707–710).
Martín-Martín, A., & Delgado López-Cózar, E. (2016). Reading Web of Science data into R.
Retrieved from https://github.com/alberto-martin/read.wos.R
22Martín-Martín, A., Orduna-Malea, E., & Delgado López-Cózar, E. (2018). Coverage of highly-
cited documents in Google Scholar, Web of Science, and Scopus: a multidisciplinary
comparison. Scientometrics, 116(3), 2175–2188. https://doi.org/10.1007/s11192-018-
2820-9
Meho, L. I., & Yang, K. (2007). Impact of data sources on citation counts and rankings of LIS
faculty: Web of science versus scopus and google scholar. Journal of the American
Society for Information Science and Technology, 58(13), 2105–2125.
https://doi.org/10.1002/asi.20677
Minasny, B., Hartemink, A. E., McBratney, A., & Jang, H.-J. (2013). Citations and the h index of
soil researchers and journals in the Web of Science, Scopus, and Google Scholar. PeerJ,
1, e183. https://doi.org/10.7717/peerj.183
Mingers, J., & Lipitakis, E. A. E. C. G. (2010). Counting the citations: a comparison of Web of
Science and Google Scholar in the field of business and management. Scientometrics,
85(2), 613–625. https://doi.org/10.1007/s11192-010-0270-0
Moed, H. F., Bar-Ilan, J., & Halevi, G. (2016). A new methodology for comparing Google
Scholar and Scopus. Journal of Informetrics, 10(2), 533–551.
https://doi.org/10.1016/j.joi.2016.04.017
Mongeon, P., & Paul-Hus, A. (2016). The journal coverage of Web of Science and Scopus: a
comparative analysis. Scientometrics, 106(1), 213–228. https://doi.org/10.1007/s11192-
015-1765-5
Ooms, J., & Sites, D. (2018). cld2: Google’s Compact Language Detector 2. Retrieved from
https://cran.r-project.org/package=cld2
Orduna-Malea, E., Ayllón, J. M., Martín-Martín, A., & Delgado López-Cózar, E. (2015). Methods
for estimating the size of Google Scholar. Scientometrics, 104(3), 931–949.
https://doi.org/10.1007/s11192-015-1614-6
Orduña-Malea, E., Martín-Martín, A., Ayllón, J. M., & Delgado López-Cózar, E. (2016). La
revolución Google Scholar : Destapando la caja de Pandora académica. Granada:
Universidad de Granada.
Orduna-Malea, E., Martín-Martín, A., & Delgado López-Cózar, E. (2018). Classic papers: using
Google Scholar to detect the highly-cited documents. In 23rd International Conference on
Science and Technology Indicators. Leiden. https://doi.org/10.31235/osf.io/zkh7p
Pauly, D., & Stergiou, K. (2005). Equivalence of results from two citation analyses: Thomson
ISI’s Citation Index and Google’s Scholar service. Ethics in Science and Environmental
Politics, 9, 33–35. https://doi.org/10.3354/esep005033
Prins, A. A. M., Costas, R., van Leeuwen, T. N., & Wouters, P. F. (2016). Using Google Scholar
in research evaluation of humanities and social science programs: A comparison with Web
of Science data. Research Evaluation, 25(3), 264–270.
https://doi.org/10.1093/reseval/rvv049
R Core Team. (2014). R: A Language and Environment for Statistical Computing. Vienna,
Austria. Retrieved from http://www.r-project.org/
Rahimi, S., & Chandrakumar, V. (2014). A comparison of citation coverage of traditional and
web citation databases in medical science. Malaysian Journal of Library and Information
Science, 19(3), 1–11. Retrieved from
http://jice.um.edu.my/index.php/MJLIS/article/view/1779
Sud, P., & Thelwall, M. (2014). Evaluating altmetrics. Scientometrics, 98(2), 1131–1143.
https://doi.org/10.1007/s11192-013-1117-2
23You can also read