Cheniere Energy, Inc - Corporate Presentation - cloudfront.net

Page created by Heather Weaver
 
CONTINUE READING
Cheniere Energy, Inc - Corporate Presentation - cloudfront.net
Cheniere Energy, Inc.
      Corporate Presentation

      August 12, 2020

NYSE American: LNG
Cheniere Energy, Inc - Corporate Presentation - cloudfront.net
Safe Harbor Statements
Forward-Looking Statements
This presentation contains certain statements that are, or may be deemed to be, “forward-looking                   •   statements that our Trains, when completed, will have certain characteristics, including amounts of liquefaction
statements” within the meaning of Section 27A of the Securities Act of 1933, as amended, and Section 21E               capacities;
of the Securities Exchange Act of 1934, as amended. All statements, other than statements of historical or         •   statements regarding our business strategy, our strengths, our business and operation plans or any other plans,
present facts or conditions, included or incorporated by reference herein are “forward-looking                         forecasts, projections or objectives, including anticipated revenues, capital expenditures, maintenance and
statements.” Included among “forward-looking statements” are, among other things:                                      operating costs, run-rate SG&A estimates, cash flows, EBITDA, Adjusted EBITDA, distributable cash flow,
•   statements regarding the ability of Cheniere Energy Partners, L.P. to pay distributions to its unitholders         distributable cash flow per share and unit, deconsolidated debt outstanding, and deconsolidated contracted
    or Cheniere Energy, Inc. to pay dividends to its shareholders or participate in share or unit buybacks;            EBITDA, any or all of which are subject to change;
•   statements regarding Cheniere Energy, Inc.’s or Cheniere Energy Partners, L.P.’s expected receipt of           •   statements regarding projections of revenues, expenses, earnings or losses, working capital or other financial
    cash distributions from their respective subsidiaries;                                                             items;
•   statements that Cheniere Energy Partners, L.P. expects to commence or complete construction of its             •   statements regarding legislative, governmental, regulatory, administrative or other public body actions, approvals,
    proposed liquefied natural gas (“LNG”) terminals, liquefaction facilities, pipeline facilities or other            requirements, permits, applications, filings, investigations, proceedings or decisions;
    projects, or any expansions or portions thereof, by certain dates or at all;                                   •   statements regarding our anticipated LNG and natural gas marketing activities;
•   statements that Cheniere Energy, Inc. expects to commence or complete construction of its proposed             •   statements regarding the outbreak of COVID-19 and its impact on our business and operating results, including
    LNG terminals, liquefaction facilities, pipeline facilities or other projects, or any expansions or portions       any customers not taking delivery of LNG cargoes, the ongoing credit worthiness of our contractual
    thereof, by certain dates or at all;                                                                               counterparties, any disruptions in our operations or construction of our Trains and the health and safety of our
•   statements regarding future levels of domestic and international natural gas production, supply or                 employees, and on our customers, the global economy and the demand for LNG; and
    consumption or future levels of LNG imports into or exports from North America and other countries             •   any other statements that relate to non-historical or future information.
    worldwide, or purchases of natural gas, regardless of the source of such information, or the
                                                                                                                   These forward-looking statements are often identified by the use of terms and phrases such as “achieve,” “anticipate,”
    transportation or other infrastructure, or demand for and prices related to natural gas, LNG or other
                                                                                                                   “believe,” “contemplate,” “develop,” “estimate,” “example,” “expect,” “forecast,” “goals,” ”guidance,” “opportunities,”
    hydrocarbon products;
                                                                                                                   “plan,” “potential,” “project,” “propose,” “subject to,” “strategy,” “target,” and similar terms and phrases, or by use of
•   statements regarding any financing transactions or arrangements, or ability to enter into such                 future tense. Although we believe that the expectations reflected in these forward-looking statements are reasonable,
    transactions;                                                                                                  they do involve assumptions, risks and uncertainties, and these expectations may prove to be incorrect. You should
•   statements regarding the amount and timing of share repurchases;                                               not place undue reliance on these forward-looking statements, which speak only as of the date of this presentation.
•   statements relating to the construction of our proposed liquefaction facilities and natural gas                Our actual results could differ materially from those anticipated in these forward-looking statements as a result of a
    liquefaction trains (“Trains”) and the construction of our pipelines, including statements concerning the      variety of factors, including those discussed in “Risk Factors” in the Cheniere Energy, Inc. and Cheniere Energy
    engagement of any engineering, procurement and construction ("EPC") contractor or other contractor             Partners, L.P. Annual Reports on Form 10-K filed with the SEC on February 25, 2020 and Quarterly Reports on Form
    and the anticipated terms and provisions of any agreement with any EPC or other contractor, and                10-Q filed with the SEC on April 30, 2020, which are incorporated by reference into this presentation. All forward-
    anticipated costs related thereto;                                                                             looking statements attributable to us or persons acting on our behalf are expressly qualified in their entirety by these
                                                                                                                   ”Risk Factors.” These forward-looking statements are made as of the date of this presentation, and other than as
•   statements regarding any agreement to be entered into or performed substantially in the future,
                                                                                                                   required by law, we undertake no obligation to update or revise any forward-looking statement or provide reasons
    including any revenues anticipated to be received and the anticipated timing thereof, and statements
                                                                                                                   why actual results may differ, whether as a result of new information, future events or otherwise.
    regarding the amounts of total LNG regasification, natural gas, liquefaction or storage capacities that
    are, or may become, subject to contracts;
•   statements regarding counterparties to our commercial contracts, construction contracts and other              Reconciliation to U.S. GAAP Financial Information
    contracts;                                                                                                     The following presentation includes certain “non-GAAP financial measures” as defined in Regulation G under the
                                                                                                                   Securities Exchange Act of 1934, as amended. Schedules are included in the appendix hereto that reconcile the non-
•   statements regarding our planned development and construction of additional Trains or pipelines,
                                                                                                                   GAAP financial measures included in the following presentation to the most directly comparable financial measures
    including the financing of such Trains or pipelines;
                                                                                                                   calculated and presented in accordance with U.S. GAAP.
         2
Cheniere Energy, Inc - Corporate Presentation - cloudfront.net
Cheniere Overview
Cheniere Energy, Inc - Corporate Presentation - cloudfront.net
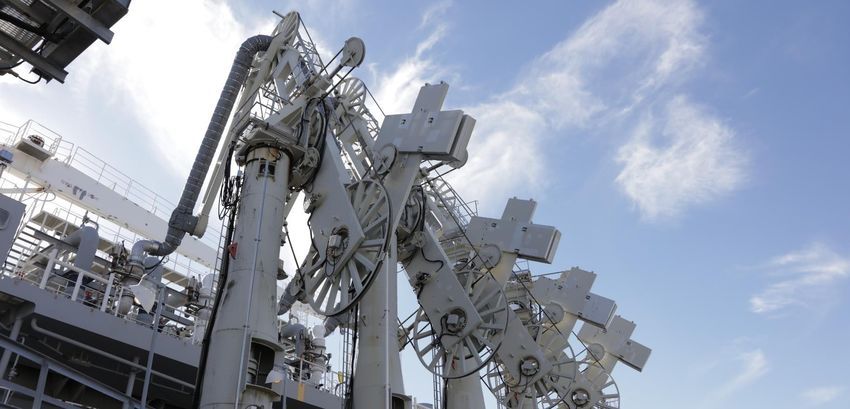
Operating An Industry-Leading LNG Export Platform

    Premier LNG provider with substantial asset                                                                                                 1
    platform
                                                    2nd largest LNG operator and 4th largest LNG supplier globally in 2020

    Proven track record of execution and
    operations

    Significant, stable, long-term cash flows

    Full-service LNG offering with customer                Sabine Pass Liquefaction                      Corpus Christi LNG Terminal
    tailored solutions                                   ~30 mtpa Total Production Capacity               ~15 mtpa Total Production Capacity

                                                  Trains 1-5 operating, contracts with long-term   Trains 1-2 operating, contracts with long-term
    Potential cash flow growth from portfolio     buyers commenced                                 buyers commenced
    volumes and expansions                        Train 6 under construction, est. completion      Train 3 commissioning, est. completion
                                                  2H 2022                                          1H 2021
                                                  Trains 1-5 delivered ahead of schedule and       ~10 mtpa Stage 3 expansion project fully
    Strong long-term global LNG demand            within budget                                    permitted
    fundamentals                                                                                   Trains 1-2 delivered ahead of schedule and
                                                                                                   within budget

4   1. Based on fixed production capacity.
Cheniere Energy, Inc - Corporate Presentation - cloudfront.net
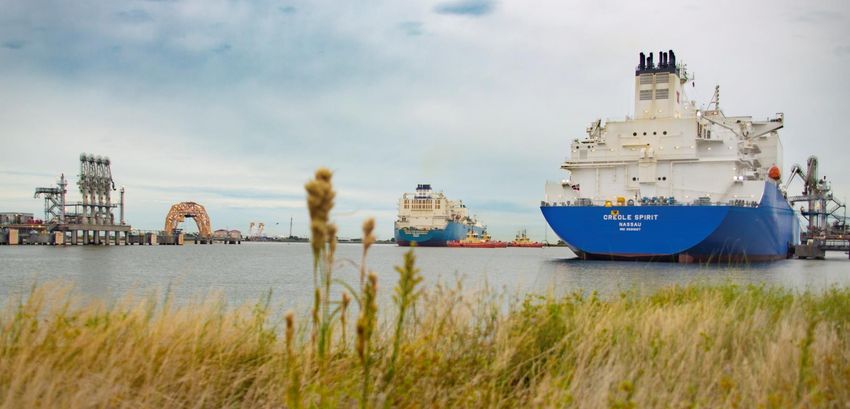
Best-In-Class Operations

    Premier LNG provider with substantial asset
    platform                                                        Laser-focused on excellence in execution across
                                                                               all facets of our business
    Proven track record of execution and
    operations

    Significant, stable, long-term cash flows
                                                               >1,175 Cargoes          Over 1,175 cargoes totaling over 80 million tonnes exported
                                                                                       from our liquefaction projects since start-up

    Full-service LNG offering with customer
    tailored solutions
                                                                                       Over 4,500 TBtu nominated to SPL/CCL with near-perfect
                                                                  >4,500 TBtu          scheduling efficiency. Cheniere is the largest consumer of
                                                                                       natural gas in the US on a daily basis
                                                                                                                             1

    Potential cash flow growth from portfolio
    volumes and expansions

                                                                >425 Cargoes           Over 425 cargoes delivered by CMI with up to 30 vessels on
                                                                                       the water simultaneously
    Strong long-term global LNG demand
    fundamentals

    Statistics above as of July 31, 2020.
5
    1. At full utilization of the seven Trains in operation.
Cheniere Energy, Inc - Corporate Presentation - cloudfront.net
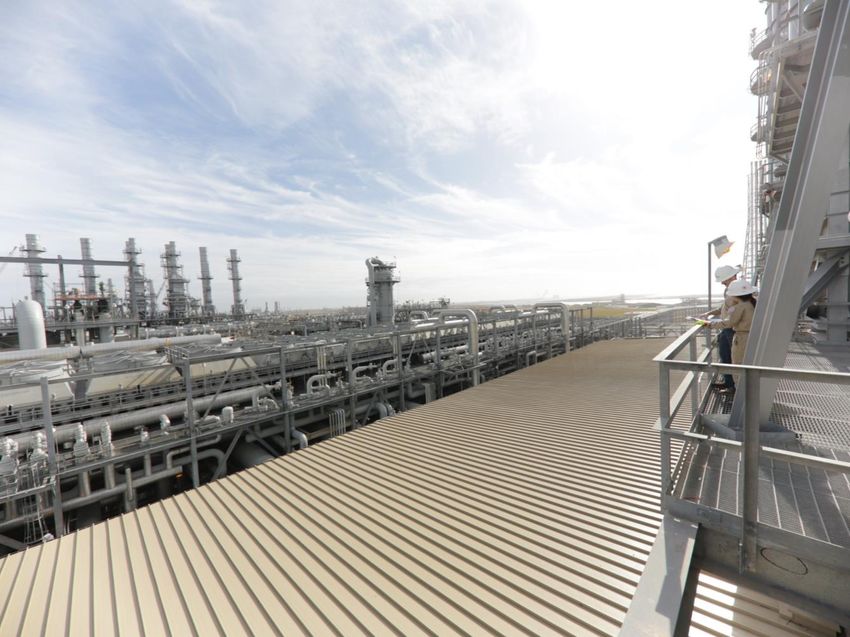
Long-Term Contracts Form Foundation of Our Business Model

    Premier LNG provider with substantial asset
    platform                                                                                                     Over $5.5 billion(1) in run-rate annual fixed-fee,
                                                                                                               take-or-pay style revenue from long-term contracts
    Proven track record of execution and
    operations

    Significant, stable, long-term cash flows
                                                                                           ~85% Contracted                                          Platform ~85%2 contracted on long-term basis with
                                                                                                                                                    creditworthy counterparties

    Full-service LNG offering with customer
    tailored solutions
                                                                                                                 ~18 Years                          Average remaining life of contracts ~18 years

    Potential cash flow growth from portfolio
    volumes and expansions
                                                                                                                                                    Provide value to our customers through destination
                                                                                     Customer Flexibility                                           flexibility, option to not lift cargoes, and diversity of price
                                                                                                                                                    and geography
    Strong long-term global LNG demand
    fundamentals

    1. Includes long-term LNG Sale and Purchase Agreements (SPAs), excludes Integrated Production Marketing (IPM) agreements with Apache and EOG.
6
    2. Includes long-term SPA and IPM agreements.
Cheniere Energy, Inc - Corporate Presentation - cloudfront.net
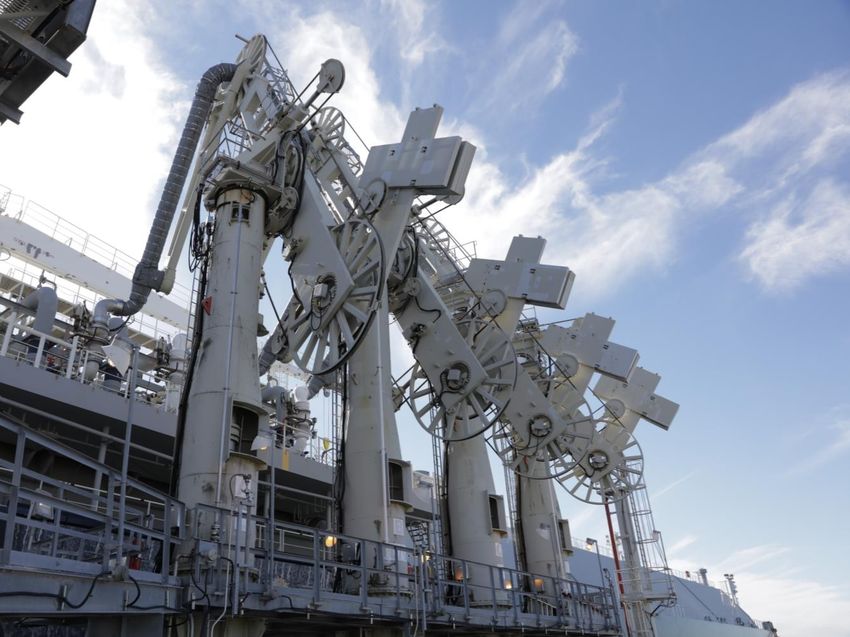
Contract Structure Underscores Long-Lived Business Model

    Premier LNG provider with substantial asset           Capitalizing on competitive strengths to provide a differentiated
    platform                                                            offering and secure long-term offtake

                                                          ✓ Early Volumes              ✓ Delivered Volumes                    ✓ Price and Volume Flexibility
    Proven track record of execution and
    operations

                                                         Free-On-Board                      Delivered Ex-Ship                      Integrated Production
    Significant, stable, long-term cash flows                 (FOB)                               (DES)                               Marketing (IPM)
                                                  Customer provides vessel and title   Cheniere delivers LNG to                  Producer sells gas on a global LNG
                                                  of LNG transfers at loading arms     customer’s specified receiving            index price, less a fixed liquefaction
                                                                                       terminal                                  fee, shipping, and other costs
    Full-service LNG offering with customer       Customer maintains destination
    tailored solutions                            flexibility                          Potential for cargo optimization via      Generates take-or-pay style fixed
                                                                                       procurement of a third-party cargo        liquefaction fee

    Potential cash flow growth from portfolio
    volumes and expansions

                                                                Provide flexibility and tailored solutions for customers to
    Strong long-term global LNG demand                             generate take-or-pay style fixed fees for Cheniere
    fundamentals

7
Cheniere Energy, Inc - Corporate Presentation - cloudfront.net
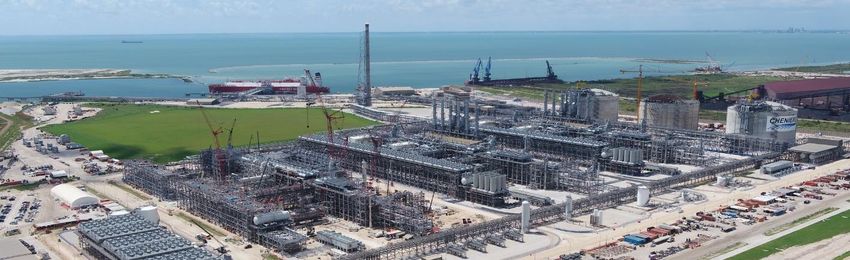
Asset Optimization and Expansions

    Premier LNG provider with substantial asset                                             Maintenance/production optimization and debottlenecking opportunities
    platform                                                                                        have led to higher expected run-rate production levels

    Proven track record of execution and
    operations

                                                                                           Run-Rate Liquefaction Capacity Per Train1                                         Corpus Christi Stage 3
                                                                                           Over 9% increase in midpoint production                                           Fully permitted ~10 mtpa expansion
    Significant, stable, long-term cash flows
                                                                                                                                                                             Seven midscale liquefaction trains that share
                                                                                                                                                                             significant infrastructure with Stages 1 & 2

    Full-service LNG offering with customer                                                Jun-19                                    4.7                     5.0
    tailored solutions
                                                                                                                                                +9%

                                                                                          Nov-18                      4.4                             4.9
    Potential cash flow growth from portfolio
    volumes and expansions
                                                                                           Apr-17               4.3                      4.6

    Strong long-term global LNG demand
    fundamentals                                                                                    4         4.2           4.4    4.6         4.8       5

8   1. Run-rate liquefaction capacity per Train adjusted for the expected impacts of planned and unplanned maintenance, debottlenecking and maintenance optimization, and overdesign.
Cheniere Energy, Inc - Corporate Presentation - cloudfront.net
>100 MTPA of Incremental LNG Supply Required by 2030

    Premier LNG provider with substantial asset
    platform
                                                                                       Over 200 mtpa of global demand growth projected by 2030

    Proven track record of execution and
    operations                                                                   Global LNG Supply
                                                                                 Over 100 mtpa of incremental LNG supply needed by 2030
                                                                          mtpa
                                                                          600

    Significant, stable, long-term cash flows
                                                                          550

                                                                                                                                                                                    New Supply
                                                                                                                                          LNG Trade Forecast
                                                                          500
                                                                                                                                                                      +100 mtpa
    Full-service LNG offering with customer
    tailored solutions                                                    450

                                                                                                                                                  Under
                                                                          400                                                                  Construction

    Potential cash flow growth from portfolio                             350
    volumes and expansions
                                                                          300                                                                  Operational

    Strong long-term global LNG demand                                    250
    fundamentals
                                                                          200
                                                                             2018     2019    2020   2021   2022    2023   2024    2025     2026      2027     2028    2029       2030

9   Source: Wood Mackenzie Global Gas Markets Long-Term Outlook H1 2020
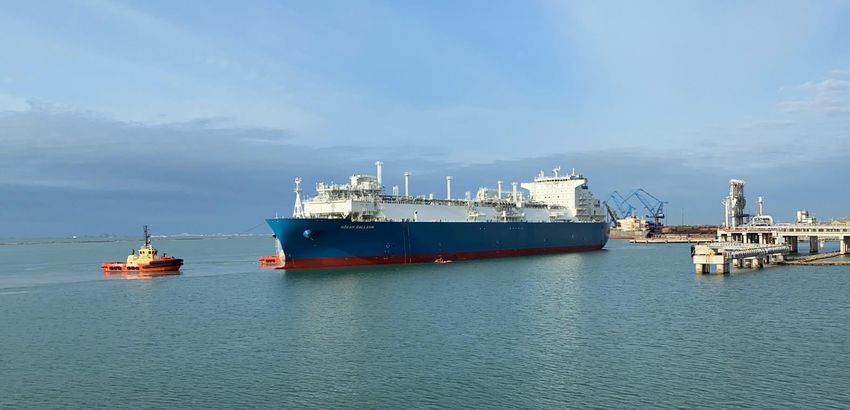
Cheniere Energy, Inc - Corporate Presentation - cloudfront.net
Company Update
Second Quarter Operating and Financial Highlights
                         Revenues
                                                                                                                                             ($ billions, except per unit data)
                                                                                               RECONFIRMING
     3000
                                                                                                                                             Consolidated Adjusted EBITDA                                     $3.8       -          $4.1
     2000                                                                              FULL YEAR 2020                                        Distributable Cash Flow                                          $1.0       -          $1.3
                                           $2,402
                                                                                                        GUIDANCE
     1000         $2,292                                                                                                                     CQP Distribution per Unit                                      $2.55        -         $2.65

        0
                  2Q 2019                  2Q 2020

        Consolidated Adjusted EBITDA
     1500                                                                 >1,175                                                                                                              $2.0B SPL Notes
     1000                                                                 CARGOES EXPORTED                                        PLACED INTO SERVICE                                         SENIOR SECURED NOTES DUE 2030
                                                                          SINCE START-UP                                          APRIL 2020                                                  ISSUED MAY 2020
                                           $1,393
      500
                                                                          Over 80 million tonnes of LNG                           Midship natural gas pipeline and                            Proceeds used to redeem all SPL Senior
                   $615
                                                                          produced, loaded, and exported from                     related compression and interconnect                        Secured Notes due 2021
        0                                                                 our liquefaction projects                               facilities placed into service
                  2Q 2019                  2Q 2020

             Distributable Cash Flow
     600
                                                                          63.9%                                                  90.5%                                                        ~$2.7B Term Loan
     400
                                                                          SABINE PASS TRAIN 6                                     CORPUS CHRISTI TRAIN 3                                      CEI BANK FACILITY PREVENTED
                                           ~$570                          PROJECT COMPLETION                                      PROJECT COMPLETION                                          SIGNIFICANT EQUITY DILUTION
     200
                                                                          Expected Substantial Completion                         Train 3 early commissioning has begun,                      Redeemed all 11% CCH Holdco II
                  ~$120                                                   accelerated to 2H 2022                                  Substantial Completion expected 1H 2021                     convertible notes and repurchased
       0
                  2Q 2019                  2Q 2020                                                                                                                                            $844mm of 2021 CEI convertible notes

      Note: $ in millions unless otherwise noted. Consolidated Adjusted EBITDA and Distributable Cash Flow are non-GAAP measures. A definition of these non-GAAP measures and a reconciliation to Net income (loss) attributable
11    to common stockholders, the most comparable U.S. GAAP measure, is included in the appendix. Project completion percentages as of June 30, 2020.
      SPL – Sabine Pass Liquefaction, LLC. CEI – Cheniere Energy, Inc.
Cheniere’s Inaugural Corporate Responsibility (CR) Report
 First and Forward                                                      Environment
 Report developed by deep, cross-functional team                        Alignment with several TCFD-recommended disclosures in our inaugural CR report
 spanning 12+ groups with Board of Directors oversight

                                                                                         33%                           62%
                                                                                         Reduction in                  Reduction in
                                                                                         Scope 1 GHG intensity         methane intensity

                                                                        Social
                                                                        Cheniere’s strength lies within the expertise of our people and our commitment to health and safety

                                                                                         21%                           15%                     45%
                                                                                         Increase in women and         Increase in ethnic      Reduction in combined total
                                                                                         14% increase in ethnic        minorities as part of   recordable incident rate (TRIR)
                                                                                         minorities in management      our employee mix        (employee and contractor)

                                                                        Governance
     • Over 70 metrics and disclosures selected laying                  Corporate governance, political engagement and business ethics are informed by our core values
       foundation of disclosure
     • Metrics and disclosures mapped to leading
                                                                                         CR Governance Framework
       reporting standards and guidelines from GRI,
                                                                                           Board                 CEO/Executive              Steering              Working
       IPIECA/IOGP/API, SASB, and TCFD
                                                                                          oversight               Leadership               Committee               Group

12   Note: Data for calendar years 2016-2019, unless otherwise noted.
Cheniere’s Response to COVID-19
                            COMPREHENSIVE SAFETY, EMERGENCY             Ensuring the health and safety of our
                                   RESPONSE, AND PROTECTIVE             workforce while providing for business
                                     MEASURES IMPLEMENTED               continuity

 ENGINEERING AND CONSTRUCTION                   OPERATIONS                                         COMMUNITY SUPPORT AND
                                                                                                   INVOLVEMENT
 Introduced biometric screenings at sites       Began providing temporary housing to isolate       Pledged over $1 million to global COVID-19
                                                essential operating personnel at Sabine Pass       relief efforts in communities where we live and
 Enhanced sanitation of infrastructure and      and Corpus Christi to ensure uninterrupted         work
 common areas                                   operations
                                                                                                   Helping reduce food insecurity for those most
 Updated processes to minimize physical         Implemented work group isolation, revised          in need and providing provisions and
 contact, enhanced use of personal protective   shift schedules and staffing levels                equipment for first responders and frontline
 equipment                                                                                         healthcare workers

13
Cheniere LNG Exports
 More Than 1,175 Cargoes (>80 Million Tonnes) Exported from our Liquefaction Projects

                                                                                                         Cheniere LNG Exports by Destination
                                                                                                   10

                                                                                                   8

                                                                                                   6

                                                                                                   4

                                                                                                   2

                                                                                                   0
                                                                                                        1Q     2Q            3Q          4Q       1Q          2Q

                                                                                                                      2019                             2020

                                                                                                             Europe     Asia      Latin America   MENA

                                                                   Cheniere Destinations

     Sources: Cheniere Research, Kpler
14
     Note: Cumulative cargoes and volumes as of July 31, 2020. MENA – Middle East & North Africa
Liquefaction Projects Update
Cheniere’s Liquefaction Platform
                                                                                            Leading Process Technology, Equipment,
                                                                                               EPC, and Infrastructure Providers

                    Sabine Pass Liquefaction Project                                                                                 Corpus Christi Liquefaction Terminal

                                                                                          Creditworthy Counterparties

     Note: SPA counterparties exclude SPAs with Cheniere Marketing which have not been assigned to a specific Train or project.
16
Sabine Pass Liquefaction Update

     Liquefaction Operations
     5 Trains in operation
     Increased production via maintenance
     optimization and debottlenecking
     >1,025 cargoes produced and exported

     Growth
     Train 6 under construction
     •      Expected completion 2H 2022
     •      Project completion 63.9%
     3rd berth NTP issued and construction
     commenced

17   Note: Cumulative cargoes as of July 31, 2020. Project completion percentage as of June 30, 2020.
Corpus Christi Liquefaction Update

     Liquefaction Operations
     2 Trains in operation
     Increased production via maintenance
     optimization and debottlenecking
     >150 cargoes produced and exported

     Growth
     Train 3 commissioning
     •      Expected completion 1H 2021
     •      Project completion 90.5%
     ~10 mtpa Stage 3 expansion project fully
     permitted

18   Note: Cumulative cargoes as of July 31, 2020. Project completion percentage as of June 30, 2020.
Market Update
Global LNG Supply Growth Rate Decreased in 1H 2020

 Global LNG Supply Variance                                                                YoY Quarterly LNG Supply Variance                                    Global LNG Production vs Utilization
 1H 2020 vs 1H 2019                                                                        Global liquefaction supply adjusted downward                         Utilization decreased to 82% in 2Q 2020
                                                                                           In 2Q 2020 to adapt to the impact of COVID-19
           MT                                                                                    MT                                                                  MT
                                                                                           14                                                                   40        Production     Capacity   Implied UR%   120%
     195                                                                                                   USA        Australia        Russia        ROW

                                                                                           12                                                                   35
                                                               1.1                                                                                                                                                100%
     190                                                                (3.1)              10
                                                   2.0                                                                                                          30

                                                                                            8                                                                                                                     80%
                                                                                                                                                                25
     185
                                      8.4                                                   6
                                                                                                                                                                20                                                60%
                                                                                            4
     180                   1.6
                                                                                188.1                                                                           15
                                                                                            2                                                                                                                     40%

                                                                                                                                                                10
                                                                                            0
     175
                178.1                                                                                                                                                                                             20%
                                                                                           (2)                                                                   5

     170                                                                                   (4)                                                                   -                                                0%
                                                                                                      1Q   2Q    3Q   4Q    1Q    2Q    3Q      4Q   1Q    2Q
                                                   Australia

                                                               Russia
                           Cheniere

                                                                        ROW
                 1H 2019

                                      Rest of US

                                                                                 1H 2020

                                                                                                                                                                      Mar

                                                                                                                                                                      May
                                                                                                                                                                       Jan
                                                                                                                                                                      Feb

                                                                                                                                                                      Dec
                                                                                                                                                                      Aug
                                                                                                                                                                      Sep

                                                                                                                                                                       Jan
                                                                                                                                                                      Feb
                                                                                                                                                                      Nov
                                                                                                                                                                      Jun

                                                                                                                                                                      Jun
                                                                                                                                                                      Apr

                                                                                                                                                                        Jul

                                                                                                                                                                      Oct

                                                                                                                                                                      Apr
                                                                                                            2018                   2019               2020
                                                                                                                                                                                  2019                    2020

20     Source: Cheniere Research, Kpler, Bloomberg (7/7/2020), CME, ICE, Platts, Japan Ministry of Finance
Pace of European Gas Receipts Began to Slow in Late 2Q
 Europe LNG Imports                                                                               Europe Week End Storage Level                                                                     Gas Supply/Demand Variance in Europe
 Sharp declines to ease storage surplus                                                           Pipeline flows decreased 6.8 Bcf/d YoY                                                            1H 2020 vs 1H 2019
         MT                                                                                               % of Full                                                         Bcm
 12                                                                                                                                                                                                    Bcf/d
                                               5-Yr Range                                         100
                                                                                                                                                                             100                  60
 10                                            2019
                                                                                                    80
                                               2020                                                                                                                          80                            57.6
     8
                                                                                                    60                                                                       60
     6
                                                                                                                                                         5-Yr Range
                                                                                                    40                                                                       40                   55
     4                                                                                                                                                   5-Yr Average
                                                                                                                                                                                                                                                                                               53.1
     2                                                                                              20                                                   2019                20                                                                                                 +2.5
                                                                                                                                                         2020                                                                                            +0.9
     0                                                                                               0                                                                       0                                      (5.1)
                                                                                                                                                                                                                             (0.7)
         Jan Feb Mar Apr May Jun Jul Aug Sep Oct Nov Dec                                                  Jan FebMar Apr May Jun Jul Aug Sep Oct Nov Dec
                                                                                                                                                                                                  50                                  (0.9)     (0.1)              (1.3)

 Gas Demand in Major European Markets                                                             Gas and LNG Supply Variance
                                                                                                  Jan-May 2020 vs Jan-May 2019
         Bcf/d                                                                                            Bcf/d                                                                                   45
 60                                      5-Yr Range                                                  6
                                         2019                                                                         Europe       China         India
 50                                                                                                  4                                                          3.2
                                         2020
 40                                                                                                  2                0.7
                                                                                                     0
 30                                                                                                                                                                                               40
                                                                                                    (2)

                                                                                                                                                                                                                    Russia

                                                                                                                                                                                                                             Norway

                                                                                                                                                                                                                                                        Sendouts
                                                                                                                                                                                                                                      Algeria

                                                                                                                                                                                                                                                Libya

                                                                                                                                                                                                                                                                   Production

                                                                                                                                                                                                                                                                                Withdrawals
                                                                                                                                                                                                          Demand

                                                                                                                                                                                                                                                                                              Demand
                                                                                                                                                                                                          H1 2019

                                                                                                                                                                                                                                                                                              H1 2020
                                                                                                                                                                                                                                                                                Net Storage
 20

                                                                                                                                                                                                                                                          LNG
                                                                                                    (4)
 10
                                                                                                    (6)                                 (5.0)
     0                                                                                                            Indigenous       Pipe Imports          LNG Imports
         Jan Feb Mar Apr May Jun Jul Aug Sep Oct Nov Dec                                                          Production

         Sources: Cheniere Research, Kpler, Commodity Essentials, GIE, IHS Markit, NDRC, SIA, PPAC
21       Note: Europe’s apparent gas demand and supply include data from EU27 plus UK, Balkan nations (BA, RS, MK) and CH. Flows to Baltic states and Finland are excluded from Russian flows. LNG sendout at Klaaipeda LNG terminal is excluded. Latvian storage
         facility is excluded. Major European markets’ gas demand includes data from Italy, Spain, UK, Germany, France and the Netherlands.
Asian Demand Bolstered by China Recovery
 Asia LNG Imports                                                         China Gas and LNG Demand YoY Variance                                              Change in Asia LNG Imports
 2Q20 imports decline slightly YoY                                        1H 2020 vs 1H 2019                                                                 1H 2020 vs 1H 2019
           MT                                                                   Bcf/d
 30                                                                       3                                                           2.5                          MT
                                                                                                                            2.3
                                5-Yr Range                                                                                     1.9                           125                                                     124.5
                                                                                                                                           1.5                                                              +1.8
                                                                          2
 25                             2019                                               1.1
                                                                                                             0.8                                       0.9
                                2020                                      1                                                                      0.7
                                                                                                                0.2
 20                                                                                                                                                                                                +0.8
                                                                          0
                                                                                                                                                                                            +0.5
                                                                          (1)                                                                                                      +0.2
 15                                                                                                (0.7)              Apparent Gas Demand                               121.1
                                                                                        (1.2)
                                                                          (2)                   (1.6)
                                                                                                                      LNG Imports
 10                                                                       (3)                                                                                120
           Jan Feb Mar Apr May Jun Jul Aug Sep Oct Nov Dec                          Jan          Feb         Mar             Apr       May         Jun

 JKT LNG Imports YoY Variance                                             India Gas Supply/Demand YoY Variance
                                                                          Jan-May 2020 vs Jan-May 2019
                                                                                Bcf/d
           MT
     6                                                                      6
                                                                                                                                     0.3          5.4
     4                  Japan     Korea        Taiwan                                   5.1                           0.4
                                                                            5                                                                                115
                                                        + 2.3
     2                                                                                              (0.5 )
                                                                            4
     0
                                                                            3
     (2)                               (1.5)    (1.4)
                          (2.2)                                  (1.8)
     (4)                                                                    2
     (6)        (5.3)                                                       1
                 Q1       Q2           Q3        Q4      Q1          Q2
                                                                            0                                                                                110
                                2019                          2020               Jan-May 2019 Domestic      LNG    Implied Stock Jan-May 2020
                                                                                  Gas Demand Production Consumption Changes       Gas Demand
                                                                                                                                                                        1H 2019   SE Asia   JKT    S Asia   China   1H 2020

22         Sources: Cheniere Research, Kpler, PPAC, NDRC
Financial Update
Second Quarter 2020 Financial Highlights

Summary Results
Second Quarter 2020
                                                                                                                                                                          77% of LNG volumes recognized in income in 2Q
($ millions, except per share and LNG data)                                        2Q 2020             1Q 2020 1H 2020                      1H 2019
                                                                                                                                                                          2020 sold pursuant to long-term SPA or IPM
Revenues                                                                            $2,402              $2,709              $5,111              $4,553                    agreements2

Income from Operations                                                                 $937             $1,346              $2,283              $1,038

Net Income 1                                                                           $197                $375                $572                  $27

Net Income per Share 1                                                                $0.78               $1.43               $2.26               $0.11
                                                                                                                                                                          2Q 2020 Distributable Cash Flow ~$570 million
Consolidated Adjusted EBITDA                                                        $1,393              $1,039              $2,432              $1,265                    YTD 2020 Distributable Cash Flow ~$830 million

LNG Exported

     LNG Volumes Exported (TBtu)                                                         274                 453                 727                 671

     LNG Cargoes Exported                                                                  78                128                 206                 191                  2Q 2020 results include revenues of $458 million
                                                                                                                                                                          related to canceled cargoes scheduled for 3Q 2020
LNG Volumes Recognized in Income (TBtu)                                                                                                                                   and exclude revenues of $53 million related to 1Q
     LNG Volumes from Liquefaction Projects                                              305                 459                 764                 634                  2020 cancellations of cargoes scheduled for 2Q 2020

     Third-Party LNG Volumes                                                               34                  14                  48                  23

     Note: Consolidated Adjusted EBITDA and Distributable Cash Flow are non-GAAP measures. A definition of these non-GAAP measures and a reconciliation to Net income attributable to common stockholders, the most comparable U.S. GAAP measure, is
     included in the appendix.
24   1.    Reported as Net income attributable to common stockholders and Net income per share attributable to common stockholders – diluted on our Consolidated Statement of Operations.
     2.    Percentage calculated based on physical LNG volumes recognized in income and excludes the impact of cargoes for which customers elected to not take delivery of LNG. Long-term refers to any agreement with an initial term of ~15 years or longer.
Balance Sheet Update and 2020 Guidance

     $2.0 Billion SPL Senior Secured Notes due 2030
     Proceeds used to redeem SPL Senior Secured Notes due 2021                                                          Full Year 2020 Guidance

                                                                                                                            ($ billions, except per unit data)
     ~$2.7 Billion CEI Term Loan Agreement
     Redeemed all outstanding 11% CCH Holdco II convertible notes                                                           Consolidated Adjusted EBITDA                                          $3.8          -      $4.1
     and repurchased $844mm of 2021 CEI convertible notes
                                                                                                                            Distributable Cash Flow                                               $1.0          -      $1.3

     Near-Term Maturities Addressed1                                                                                        CQP Distribution per Unit                                           $2.55           -     $2.65
     Addressed near-term maturities and eliminated most expensive
     debt within structure; next maturity to address is 2022 SPL Notes

     Debt Reduction is Capital Allocation Priority                                                                                    Locked in economics for almost all expected 2020
     Capital allocation short- and medium-term to be focused on using                                                                             LNG production capacity
     excess capital for debt reduction, moving toward leverage targets
                                                                                                                              Forecast $1 change in market margin would impact FY 2020
     CCH Upgraded to IG by Moody’s Investor Service                                                                                 Consolidated Adjusted EBITDA by ~$35 million
     CCH senior secured debt upgraded from Ba1 to Baa3 – third
     investment grade (IG) rating for CCH

     Note: Consolidated Adjusted EBITDA and Distributable Cash Flow are non-GAAP measures. A definition of these non-GAAP measures and a reconciliation to Net income attributable to common stockholders, the most
25   comparable U.S. GAAP measure, is included in the appendix.
     1. Remaining capacity under CEI Term Loan Agreement and/or cash on hand expected to be used to repurchase remaining outstanding balance of 2021 CEI convertible notes.
Committed to Discipline in Capital Investment Decisions

 Growth Capital Investment Considerations                                             Corpus Christi Stage 3
                                                                       Steps remaining to reach positive Final Investment Decision:
     Sign creditworthy contracts to underpin growth while
     targeting 80% to 95% of liquefaction capacity under
                                                                                              Secure Sufficient        Complete Financing
     long-term contracts                                               Finalize EPC
                                                                                             Commercial Offtake         Transaction ≤50%

     Earn attractive unlevered returns at the project level
     under conservative LNG market margin scenarios

     Ensure sufficient equity funding options to improve
     project coverage ratios and overall consolidated run-rate
     credit metrics

     FID projects that exceed cost of equity with superior
     returns relative to return in prevailing LNG stock price
                                                                 Committed to project FIDs only when considerations met; will redeploy
                                                                    capital to reduce leverage and return capital to shareholders if
                                                                                        parameters not achieved

26
Run-Rate Guidance

                                                                                                                                                                                                                     9 Trains
                                                                                                                                                                                                                        (2023)
                                                                                                                                                                                                                      SPL T1-6
                ($bn, except per share and per unit amounts or unless otherwise noted)                                                                                                                                CCL T1-3

              CEI Consolidated Adjusted EBITDA                                                                                                                                                                 $5.2 - $5.6

                    Less: Distributions to CQP Non-Controlling Interest                                                                                                                                   ($0.9) – ($1.0)

                    Less: CQP Interest Expense / SPL Interest Expense / Other                                                                                                                                            ($1.1)

                    Less: CEI Interest Expense / CCH Interest Expense / Other                                                                                                                                            ($0.7)

              CEI Distributable Cash Flow                                                                                                                                                                      $2.5 - $2.9

              CQP Distributable Cash Flow per Unit                                                                                                                                                        $3.70 - $3.90

     Note: Numbers may not foot due to rounding. Range driven by production and assumes CMI margin of $2.50/MMBtu, 80/20 profit-sharing tariff with SPL/CCH. Interest rates at SPL and CCH for refinancings assumed to be 5.50%. Average tax
     rate as percentage of pre-tax cash flow expected to be 0-5% in the 2020s and 15-20% in the 2030s. Consolidated Adjusted EBITDA, Distributable Cash Flow, Distributable Cash Flow per Share and Distributable Cash Flow per Unit are non-
     GAAP measures. A definition of these non-GAAP measures is included in the appendix. We have not made any forecast of net income on a run-rate basis, which would be the most directly comparable measure under GAAP, and we are unable
     to reconcile differences between these run-rate forecasts and net income.

27
Appendix
Cheniere Corporate Structure

                                                                                                                     Cheniere Energy, Inc.
                                                                                                                    (NYSE American: LNG)

                                                                     CQP GP                                                                                              Cheniere Corpus
                                                                                                                      Cheniere Marketing
                                                                     (& IDRs)                                                                                            Christi Holdings

                                                           Cheniere Energy
                                                                                                                                                             Corpus Christi           Cheniere Corpus
                                                             Partners, L.P.
                                                                                                                                                              Liquefaction             Christi Pipeline
                                                         (NYSE American: CQP)

                                                              Cheniere Creole                                       Sabine Pass
           Sabine Pass LNG
                                                               Trail Pipeline                                       Liquefaction

                  Publicly Traded Equity
                  Operating Entity
                  Non-Operating Entity

29   Note: This organizational chart is provided for illustrative purposes only, is not and does not purport to be a complete organizational chart of Cheniere.
Cheniere Debt Summary
                                  Cash Balance: ~$2.0B1

 Cheniere Energy, Inc.
                                                                                                                 Cheniere Energy, Inc.
 ~$0.5B PIK Convertible Notes due 2021 (4.875%)                                                                 (NYSE American: LNG)
 ~$0.63B Convertible Notes due 2045 (4.250%)                                                                                                                                                            Cheniere Corpus Christi Holdings, LLC
 $1.25B Senior Secured Revolving Credit Facility due 2022                                                                                                                                               $1.25B Notes due 2024 (7.000%)
 ~$2.7B Term Loan Credit Facility3 due 2023                                                                                                                                                             $1.5B Notes due 2025 (5.875%)
                                                                                                                                                                                                        $1.5B Notes due 2027 (5.125%)
                                                                                                                                                                                                        $1.5B Notes due 2029 (3.700%)
                                                                          CQP GP                                                                                  Cheniere Corpus                       ~$0.73B Notes due 2039 (4.800%)
                                                                                                                  Cheniere Marketing                                                                    ~$0.48B Notes due 2039 (3.925%)
                                                                          (& IDRs)                                                                                Christi Holdcos(2)                    ~$3.3B Credit Facility due 2024
                                                                                                                                                                                                        $1.2B Working Capital Facility due 2023

 Cheniere Energy Partners, L.P.
 $1.5B Notes due 2025 (5.250%)                                  Cheniere Energy
 $1.1B Notes due 2026 (5.625%)                                                                                                                   Corpus Christi                         Cheniere Corpus
 $1.5B Notes due 2029 (4.500%)                                    Partners, L.P.
                                                                                                                                                  Liquefaction                           Christi Pipeline
 $0.75B Senior Secured Revolving Credit
 Facility due 2024
                                                              (NYSE American: CQP)

                                                                                                                                                              Sabine Pass Liquefaction, LLC
                                                                   Cheniere Creole                                       Sabine Pass                          $1.0B Notes due 2022 (6.250%)
                Sabine Pass LNG                                                                                                                               $1.5B Notes due 2023 (5.625%)
                                                                    Trail Pipeline                                       Liquefaction                         $2.0B Notes due 2024 (5.750%)
                                                                                                                                                              $2.0B Notes due 2025 (5.625%)
                                                                                                                                                              $1.5B Notes due 2026 (5.875%)
                                                                                                                                                              $1.5B Notes due 2027 (5.000%)                             Publicly Traded Equity
                                                                                                                                                              $1.35B Notes due 2028 (4.200%)                            Operating Entity
 Note: This organizational chart is provided for illustrative purposes only, is not and does not purport to be a complete organizational chart of Cheniere.
                                                                                                                                                              $2.0B Notes due 2030 (4.500%)
 CEI Convertible Notes shown at value of total principal plus PIK interest due at estimated time of conversion. Debt balances as of July 31, 2020.            $0.8B Notes due 2037 (5.000%)                             Non-Operating Entity
 (1) Unrestricted cash balance as of June 30, 2020. Includes unrestricted cash of $1.3 billion held by Cheniere Energy Partners, L.P.                         $1.2B Working Capital Facility due 2025
 (2) Includes Cheniere CCH Holdco I and II and Cheniere Corpus Christi Holdings
 (3) Includes undrawn balance of $372 million as of July 31, 2020.

30
Reconciliation to Non-GAAP Measures
                                                                                                                                                                        Consolidated Adjusted EBITDA
Regulation G Reconciliations                                                       otherwise predictive or indicative of ongoing operating performance, including
                                                                                                                                                                        The following table reconciles our Consolidated Adjusted EBITDA to U.S. GAAP results for the three and six months
This presentation contains non-GAAP financial measures. Consolidated               the effects of modification or extinguishment of debt, impairment expense and        ended June 30, 2020 and 2019 and the three months ended March 31, 2020 (in millions):
Adjusted EBITDA, Distributable Cash Flow, Distributable Cash Flow per Share,       loss on disposal of assets, changes in the fair value of our commodity and                                                                                Three Months Ended              Six Months Ended
and Distributable Cash Flow per Unit are non-GAAP financial measures that we       foreign currency exchange (“FX”) derivatives, non-cash compensation expense,                                                                             June 30,         March 31,            June 30,

use to facilitate comparisons of operating performance across periods. These       and non-recurring costs related to our response to the COVID-19 outbreak. We                                                                         2020        2019        2020         2020         2019
                                                                                                                                                                        Net income (loss) attributable to common stockholders      $      197 $      (114) $       375 $        572 $           27
non-GAAP measures should be viewed as a supplement to and not a substitute         believe the exclusion of these items enables investors and other users of our           Net income attributable to non-controlling interest            207         116          228          435            312
for our U.S. GAAP measures of performance and the financial results calculated     financial information to assess our sequential and year-over-year performance           Income tax provision                                            63          —           131          194              3
                                                                                                                                                                           Interest expense, net of capitalized interest                  407         372          412          819            619
in accordance with U.S. GAAP and reconciliations from these results should be      and operating trends on a more comparable basis and is consistent with                  Loss on modification or extinguishment of debt                  43          —             1           44             —
carefully evaluated.                                                               management’s own evaluation of performance.                                             Interest rate derivative loss, net                              25          74          208          233            109
                                                                                                                                                                           Other income, net                                               (5)        (16)          (9)         (14)           (32)
Consolidated Adjusted EBITDA represents net income (loss) attributable to          Distributable Cash Flow is defined as cash received, or expected to be received,     Income from operations                                     $      937 $       432 $      1,346 $      2,283 $        1,038
Cheniere before net income (loss) attributable to the non-controlling interest,    from Cheniere’s ownership and interests in CQP and Cheniere Corpus Christi           Adjustments to reconcile income from operations to
                                                                                                                                                                        Consolidated Adjusted EBITDA:
interest, taxes, depreciation and amortization, adjusted for certain non-cash      Holdings, LLC, cash received (used) by Cheniere’s integrated marketing                  Depreciation and amortization expense                          233         204         233             466          348

items, other non-operating income or expense items, and other items not            function (other than cash for capital expenditures) less interest, taxes and            Loss (gain) from changes in fair value of commodity and
                                                                                                                                                                           FX derivatives, net                                            137         (56)        (577)           (440)       (183)

otherwise predictive or indicative of ongoing operating performance, as            maintenance capital expenditures associated with Cheniere and not the                   Total non-cash compensation expense                             27          31           29           56             56
                                                                                                                                                                           Impairment expense and loss on disposal of assets               —            4            5            5              6
detailed in the following reconciliation. Consolidated Adjusted EBITDA is not      underlying entities. Management uses this measure and believes it provides              Incremental costs associated with COVID-19 response             59          —             3           62             —
intended to represent cash flows from operations or net income (loss) as           users of our financial statements a useful measure reflective of our business’s      Consolidated Adjusted EBITDA                               $    1,393 $       615 $      1,039 $      2,432 $        1,265

defined by U.S. GAAP and is not necessarily comparable to similarly titled         ability to generate cash earnings to supplement the comparable GAAP
measures reported by other companies.                                              measure.
                                                                                                                                                                        Consolidated Adjusted EBITDA and Distributable Cash Flow
We believe Consolidated Adjusted EBITDA provides relevant and useful               Distributable Cash Flow per Share and Distributable Cash Flow per Unit are
                                                                                                                                                                        The following table reconciles our actual Consolidated Adjusted EBITDA and Distributable Cash Flow to Net income
information to management, investors and other users of our financial              calculated by dividing Distributable Cash Flow by the weighted average               attributable to common stockholders for the three and six months ended June 30, 2020 and 2019 and forecast
information in evaluating the effectiveness of our operating performance in a      number of common shares or units outstanding.                                        amounts for full year 2020 (in billions):

manner that is consistent with management’s evaluation of business                 We believe Distributable Cash Flow is a useful performance measure for                                                                                Three Months          Six Months
performance. We believe Consolidated Adjusted EBITDA is widely used by             management, investors and other users of our financial information to evaluate                                                                           Ended                Ended
                                                                                                                                                                                                                                           June 30,            June 30,                 Full Year
investors to measure a company’s operating performance without regard to           our performance and to measure and estimate the ability of our assets to                                                                              2020    2019        2020    2019                2020
items such as interest expense, taxes, depreciation and amortization which vary    generate cash earnings after servicing our debt, paying cash taxes and               Net income (loss) attributable to common stockholders           $ 0.20 $ (0.11) $ 0.57 $ 0.03 $ 0.2 - $ 0.5
substantially from company to company depending on capital structure, the          expending sustaining capital, that could be used for discretionary purposes            Net income attributable to non-controlling interest             0.21    0.12    0.43   0.31   0.7 -   0.8
                                                                                                                                                                          Income tax provision                                            0.06    0.00    0.19   0.00   0.1 -   0.2
method by which assets were acquired and depreciation policies. Further, the       such as common stock dividends, stock repurchases, retirement of debt, or              Interest expense, net of capitalized interest                   0.41    0.37    0.82   0.62   1.5 -   1.6
exclusion of certain non-cash items, other non-operating income or expense         expansion capital expenditures. Management uses this measure and believes it           Depreciation and amortization expense                           0.23    0.20    0.47   0.35           0.9
items, and items not otherwise predictive or indicative of ongoing operating       provides users of our financial statements a useful measure reflective of our
                                                                                                                                                                          Other expense, financing costs, and certain non-cash
                                                                                                                                                                          operating expenses                                              0.29      0.04     (0.05)      (0.04)      0.3 -     0.1
performance enables comparability to prior period performance and trend            business’s ability to generate cash earnings to supplement the comparable            Consolidated Adjusted EBITDA                                    $ 1.39 $ 0.62 $ 2.43 $ 1.27 $ 3.8 - $ 4.1
analysis.                                                                          GAAP measure.                                                                          Distributions to Cheniere Partners non-controlling interest    (0.16) (0.15) (0.31) (0.30)          (0.6)
                                                                                                                                                                          SPL and Cheniere Partners cash retained and interest
Consolidated Adjusted EBITDA is calculated by taking net income (loss)             Distributable Cash Flow is not intended to represent cash flows from                   expense                                                        (0.52)    (0.28)    (1.01)      (0.59)               (1.6)

attributable to common stockholders before net income (loss) attributable to       operations or net income (loss) as defined by U.S. GAAP and is not necessarily         Cheniere interest expense, income tax and other                (0.14) (0.07) (0.29) (0.06)          (0.6)
                                                                                                                                                                        Cheniere Distributable Cash Flow                                $ 0.57 $ 0.12 $ 0.83 $ 0.32 $ 1.0 - $ 1.3
non-controlling interest, interest expense, net of capitalized interest, changes   comparable to similarly titled measures reported by other companies.
in the fair value and settlement of our interest rate derivatives, taxes,          Non-GAAP measures have limitations as an analytical tool and should not be           Note: Totals may not sum due to rounding.

depreciation and amortization, and adjusting for the effects of certain non-       considered in isolation or in lieu of an analysis of our results as reported under
cash items, other non-operating income or expense items, and other items not       GAAP, and should be evaluated only on a supplementary basis.

           31
Investor Relations Contacts
Randy Bhatia
Vice President, Investor Relations – (713) 375-5479, randy.bhatia@cheniere.com

Megan Light
Director, Investor Relations – (713) 375-5492, megan.light@cheniere.com

®2020 Cheniere Energy, Inc. Copyrights - All Rights Reserved
You can also read