Unlocking the value of NHS estates in London - Technical pack October 2014
←
→
Page content transcription
If your browser does not render page correctly, please read the page content below
Unlocking the value of NHS
estates in London
Technical pack

October 2014
Guide to this document

This document contains the evidence base to support the Commission's
recommendations relating to NHS estates in London

This analysis has been undertaken through the Call for Evidence period
and engaged on with stakeholders throughout the Commission

The contents of this document include:

 • Overview of narrative

 • Analysis in the following areas:
    – Acute estate
    – Mental health estate
    – Community care estate
    – Primary care estate

                                                               2
There is a need to improve the use of NHS estates across London to
enable better health and healthcare across London

London is facing a huge      ▪ The city does not have enough land to meet the current and future needs of the
land challenge                 population.

                             ▪ The quality and efficiency of usage of London’s NHS estate is highly variable and
Large amount of estate         much does not meet evolving needs. There is significant scope to transform the
which is of high value and     way that estate is used across London.
varying quality              ▪ London’s NHS estate is of high value, variable quality with some unsuitable for
                               purpose and overall, NHS assets are under-utilised.

                             ▪ Poor utilisation and unsuitable types of estate has been a result of:
A proportion of estate is      – Perverse incentives, insufficient investment and fragmented decision-making
under-utilised                     on primary and out-of-hospital estate; and
                               – A lack of incentives for trusts to rationalise the use of estate.

There is a need to unlock
                             ▪ The NHS does not have any new money to spend on fixing these problems and
                               therefore must look at how to unlock value from the current estate and capital
value
                               regime to address the issues within the system.

There are opportunities
                             ▪ This represents a huge opportunity for health and care in London; but also for
                               public/social sector use in London where there is a need for 550,000 new homes
across the public sector
                               by 2021 and 118,000 new school places by 2016/17.

                                                                                                     3
There is a need to improve the use of NHS estates across London to
enable better health and healthcare across London
               ▪ Support improvements in quality of general practice estate by moving to capitation for
                   estates costs.
Primary &
               ▪   Ensure collaboration between NHS and other public and social sector bodies to facilitate
OOH estate         disposal of surplus NHS estates for alternative social uses such that the NHS gets a
                   good deal and disposal supports London’s broader land issues.
               ▪   Changes in retention of capital receipts for FTs (Monitor) and non-FTs (HMT).
               ▪   Actively encourage DH, NHS England and Monitor to develop a national proposition to
Hospital           increase the cost of capital to a fair market rate and alter the valuation process.
estate         ▪   Create a vehicle under a new management agreement for development or disposal of
                   surplus estate (especially trusts and community estate).
               ▪   Provide measures to trusts to help them out of the “estates trap”.
               ▪   Set and rigorously enforce quality standards for NHS estates (Hospital Trusts and
                   Primary and Community Care).
               ▪   Develop Strategic Planning Capital Boards at local health economy level (with central
                   co-ordination) to:
                   – Provide a single point of review for local health economy capital business cases to
Governance             national regulators; and
&
                   – Use proceeds of exiting surplus estate to invest in various programmes that support
capabilities           the local health economy including new community/primary care hubs.
               ▪   Ensure commissioners have a voice in estates strategy for providers in the local health
                   economy and input into Strategic Planning Capital Board(s).
               ▪   Develop an asset register of estate and property across London to allow a single,
                   transparent view.
                                                                                             4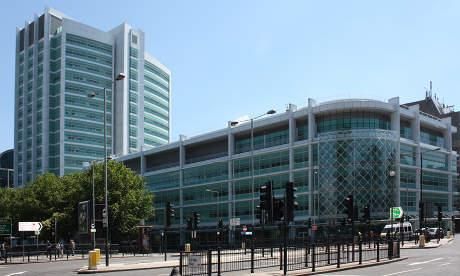
Contents

           ▪   Analysis of London challenges

                ▪   Acute estate
                ▪   Mental health estate
                ▪   Community care estate
                ▪   Primary care estate

                                               5
The NHS allocates highest capital spend on buildings and least on medical
  equipment in the Beveridge1 peer group yet underspends its capital budget

                                                  Spend on sophisticated medical
 Spend on health buildings2                                                                                     DH Capital Budget Outturn
                                                  equipment
 %, 2010                                          Equipment per million population, 2011                        CDEL (£bn)            xx% Underspend
                                                  Computerised            Radiation therapy                                               as a % of
                                                  tomography              equipment                                                       plans

  UK                                        4.0   Australia             44.4      Denmark                12.9
                                                                                                                2009/10          2.8      0.6 3.5        18
  Portugal                                  4.0   Italy               32.1
                                                                                  Finland            9.7
  Finland                             3.1
                                                  Denmark            29.3
                                                                                  Australia          9.2        2010/11          2.8      0.6 3.4        18
  Ireland                       2.4
                                                  Finland           21.3
  Denmark             0.9                                                         Ireland            9.2
                                                  Spain            17.3
  Norway              0.8                                                                                       2011/12         2.3     0.8 3.1          25
                                                                                  Italy             7.0
                                                  Ireland          15.7
  Italy             0.7
                                                                                  UK               5.2
                                                  Canada           14.6
  Spain             0.7
                                                                                                                2012/13         2.5       1.3 3.7 34
  Sweden          0.3                             UK              8.9             Spain            4.9

                        Ø 1.9                                  Ø 22.9                           Ø 8.3
1 Countries in which the majority of healthcare is provided through public bodies, and financed through taxation, as in the UK.
2 New construction (public, private and PFI build cost) including medical schools, clinics, welfare centres, adult training centres and nursing homes.
SOURCE: Euroconstruct, 2011 and Eurostat (health buildings data); OECD (healthcare expenditure); EC Harris, 2012 (construction cost data)
                                                                                                                                          6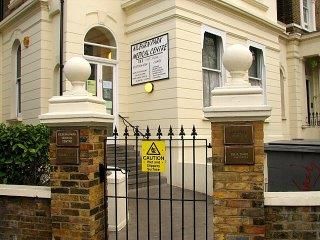
Overview of footprint of NHS estate across London

  Total number of NHS sites and premises                              Total split of gross internal area of NHS estate
  across London                                                       across London, m2 (‘000s)1
                     ▪ 27 Trusts (11 FTs and 16 non-
                         FTs)                                          Acute                               Specialist
                     ▪   65 sites of which                                                           330
   Acute
                         – 24 Teaching Hospital sites
                         – 21 Large Hospital sites
                         – 20 all other                                3,222                                    Mental
                                                                                                            781 Health
                     ▪ 9 Trusts (6 FTs and 3 non-FTs)
   Mental
   health
                     ▪ 85 sites (59 part of FTs and 26
                         non-FTs)

                     ▪ Roughly ~700-800 sites across
                         London (based on extrapolation                                             817
   Commun-
                         of mapping exercises and                                        91            Primary care
   ity
                         NHSPS data) including 193                                         170         (i.e., former PCT)
                         housing general practice
                                                                           Ambulance Trust/ Community Healthcare/
                                                                           NHS Direct       Care Trust/Social
                     ▪ 1,433 practices (of which 193
   General                                                                                  Enterprise
                         are owned by NHSPS)
   Practice
                         – Average list: 6,287
1 Analysis done by London Health Board by HUDU

SOURCE: HUDU, London Health Board, ERIC, CQC, NHS Property Services
                                                                                                              7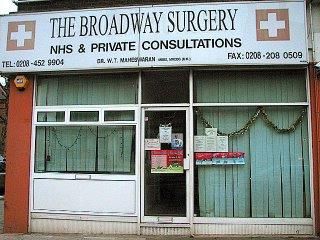
Overview of value and opportunity in NHS Estate in London

                         Size of Estate and Surplus Estate
                         ▪ Total book value of land and buildings across all trusts                       Surplus
                             equal to ~£7.2bn                                                                         £1-1.2bn
   Acute                 ▪   Estimated opportunity of £1-1.2bn1 across all trusts:
                             – FTs: ~£380-510m                                                                          £5.8-6bn Utilised
                             – Non-FTs: ~£660-730m
                         ▪ Total book value of land and buildings across all trusts                       Surplus
                             equal to ~£1.5bn (or ~£1.2bn excluding WLMHT due to                                      ~£230m
   Mental                    Broadmoor Hospital)
   Health                ▪   Estimated opportunity of ~£230m1 across all estates2:                                       ~£970m Utilised
                             – FTs: ~£65m
                             – Non-FTs: ~£164m

                         ▪ Triangulated estimates (from local mappings and data
                             from NHS PS and CHP/LIFT) show likely book value of                                                   Utilised
   Community                                                                                                   ~£100m
                             community care estate is between £860m and £1,040m                                          ~£940m
   Care                                                                                                  Surplus
                         ▪   Opportunity is at least ~£60-100m but likely greater

                         ▪ Estimated market value in region of ~£1.56bn (1,433       Does not
                             practices across London) of which ~£260m is included in meet       34%
                             NHSPS (193 premises) and £32m in CHP (30 premises)      disabled                                        Compliant
   Primary Care                                                                      access
                         ▪   Investment required to make estate meet disability                                              66%
                             access requirements of at least ~£200m to reach         requirements
                             minimum standards (currently extrapolation from NWL)
1 Calculated based on capital/revenue ratio assuming all trusts can reach median
2 Does not include West London Mental Health Trust due to large asset (Broadmoor Hospital) which skews data heavily
SOURCE: ERIC 2013, Trust accounts from FIMS database 2012/13; FT Trust Accounts 2012/13, NHSPS, CQC, Zoopla, Team Analysis       8
Overview of ownership models of NHS estate across London

                          Ownership Model                                                                               Funding Sources

                          Book value, FTs (PFI) FTs (non-PFI) Trusts (PFI) Trusts (non-PFI)                             ▪ Trust re-investment
                          £bn                                                                                           ▪ Trust development
    Acute                                                                                                                   authority (TDA) from
                                            0.32           2.85               1.33               2.69                       DH
                                                                                                                        ▪   Private sector (PFIs)

                          Book value, FTs (PFI) FTs (non-PFI)                        Non-FTs (non-PFI)                  ▪ Trust re-investment
    Mental
                          £bn                                                                                           ▪ Trust development
                                           0.06               0.76                             0.66                         authority (TDA) from
    Health
                                                                                                                            DH
                                                                                                                        ▪   Private sector (PFIs)

                          Number of PropCo (GP) PropCo (Other) CHP/LIFT (GP) CHP/LIFT (Other)
    Community
                          premises,                                                   ▪ Capital investment from
                          very rough         193                 142        30 25       NHS England
    Care
                          estimates

                 Number of PropCo CHP/LIFT Privately Held                                          Unknown              ▪ Rent reimbursed (if GP
                 premises,                                                                                                  leases property)
    Primary Care very rough 193 30             931                                                      279             ▪ Interest reimbursed on
                 estimates                                                                                                  loan until re-paid then
                                                                                                                            notional rent (if GP
                                                                                                                            owns property)
Estimates for ownership split for community and primary care should be viewed as directional and not be heavily
relied upon given definitional differences, data gaps and no recent picture of privately held GP practices in London (estimate is UK based in 2006)
Number recorded under both primary care and community care; however accounted for in community care when sizing opportunity
SOURCE: ERIC 2013, Trust accounts from FIMS database 2012/13; FT Trust Accounts 2012/13, NHSPS, Web Searches, Team Analysis               9
More than 40% of NHS hospitals are more than 30 years old and 28% pre-
 date the founding of the NHS in 1948, which leads to variance in condition

  Age Profile of Acute Estate across London                             Quality of Estate
                                                                        Some of the acute estate is new and high
                                                                        quality (e.g., UCLH)…
               Age Profile –
               1948 to 1974

                               15%

                                                        Age Profile –
                                                    40% 1975 to 2004
                      17%                                               ...other trusts are poor quality and have
                                                                        lacked proper investment (e.g.,
 Age Profile –
                                                                        Northwick Park)
 2005 to
 present

                                    28%

                                          Age Profile - pre 1948

SOURCE: ERIC 2013, Website Review
                                                                                                    10
GP premises are in poor condition, typically in converted residential
buildings – 34% need to be rebuilt and 44% are in need of repair
Assessment of GP Practice Premises in Example of GP Practice needing re-build to
North West London meet disabled access requirements
Total of 34% Good
needs 0%
rebuild Acceptable
22%
Unacceptable 25%
Very Poor8%
Total of 44%
44%
needs repair
Poor
SOURCE: NHS North West London Shaping a Healthier Future
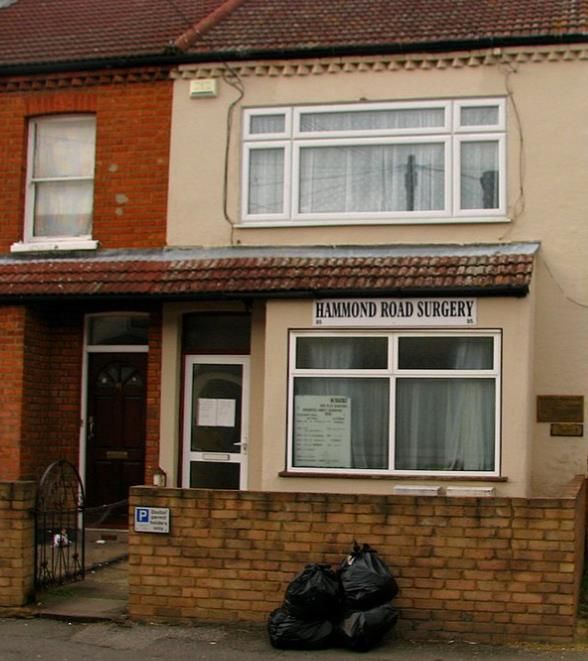
11The approval process for primary care estates investment is overly complex
Decision NWL-wide step CCG-wide step NHSE scheme specific step
Proposed
CCG decides Develop CCG submits NHSE com-
Identify Sign-off from schemes
whether to Strategic PID (draft municates
Clarify potential NHS PC and prioritised at
0 1 proceed 2 Service 3 SOC) to NHSE 4 5 outcomes of
requirements investment NHSE London NHSE regional
Delivery Plan for preferred decisions to
requirement PC team governance
(SSID) site CCGS
forums
▪ Schemes captured in ▪ Schemes that have revenue ▪ Demonstrates strategic ▪ Uses evidence base of SSDP ▪ NHSE prioritise
NWL OOH estates impact but do not require OOH need for CCG ▪ Sets out options appraisal to propose schemes across
investment pipeline capital funding still require ▪ Includes locality, specific scheme for a locality London against
▪ Pipeline communicated business case development type, ▪ Focus on affordability agreed criteria
to NHSE London ▪ NHSE London team assess potential funding route, ▪ Includes high level capital and
primary care team these revenue business services revenue funding for all options
cases and may approve them ▪ NHSE London primary care team
locally sign-off agreed approach to cover
increased rental costs
CCG Handover to NHSE
manages NHSE national team to review CCG Site options,
decision to Develop site
delivery of business case through decision to development
10 proceed to 9 8 Develop OBC 7 6 service
approved appropriate approval proceed and
FBC specification
business authority (subject to assessment
case option financial value)
Financial value NHSE approvals process ▪ Sign-off by ▪ Articulates strategic, economic,
< £ 3m ▪ NHSE chair/CEO/CFO NHS PC and commercial, financial and
< £ 3-10m ▪ NHSE Finance and Investment Committee (FIC) NHSE London management cases
< £ 10-35m ▪ NHSE FIC recommends approval PC team ▪ Financial case including capital
▪ NHSE Board approval and revenue funding
requirements with latter based on
< £ 35-50m ▪ Consultation with HMT via DH
district valuer assessment
▪ NHSE FIC recommends approval
▪ NHSE Board approves
< £ > 50m ▪ As above, plus
▪ Approval from: NHSE Board, DH then HMT
SOURCE: Based on NWL General Practice Estate, v2.1 12Contents
▪ Analysis of London challenges
▪ Acute estate
▪ Mental health estate
▪ Community care estate
▪ Primary care estate
13The total book value of land and buildings of acute estate in London is
£7.2bn, of which over half is non-FTs
Book value of total estate in London, £m Land
Buildings
Acute - Large 420 1,828
FTs
Acute - Teaching 797 2,365
Acute - Small 98 324
£3.17bn
£4.02bn 32 65
Acute - Multi-service
Acute - Specialist 572
151
Non-FTs
Acute - Medium 123 411
SOURCE: Eric Database 2013; Trust accounts from FIMS database 2012/13; FT Trust Accounts 2012/13
14This estate has a total running cost of ~£1.2bn each year…
Annual running costs (£m) Total running cost (£m)
Barking, Havering and Redbridge Hospitals 3 13 18 34
Barnet and Chase Farm Hospitals 6 11 19 36
1 50 73
Barts Health 124
Chelsea and Westminster Hospital (FT) 10 10 21 41
Croydon Health Services 5 5 11 21
Ealing Hospital 33 15 21
Epsom and St Helier University Hospitals 6 9 14 30
Great Ormond Street Hospital for Children (FT) 6 18 25 49
Guy’s and St Thomas’ (FT) 20 36 72 129
Homerton University Hospital (FT) 3 5 29 38
Imperial College Healthcare 21 37 40 98
King’s College Hospital (FT) 8 14 31 53
3 6 17
Kingston Hospital 26
2 5 14
Moorfields Eye Hospital (FT) 21
0 7 13
North Middlesex University Hospital 20
North West London Hospitals 5 9 16 30
Royal Brompton and Harefield (FT) 6 17 10 33
Royal Free London (FT) 7 14 18 39
2 3 5
Royal National Orthopaedic Hospital 10
South London Healthcare 9 13 40 63
St George’s Healthcare 7 18 40 65
The Hillingdon Hospitals (FT) 4 7 8 19
The Lewisham Healthcare 4 10 20 34
The Royal Marsden (FT) 5 11 11 27
3 8 13
The Whittington Hospital 24
University College London Hospitals (FT) 8 23 85 115
West Middlesex University Hospital 5 9 16
2
Public dividend capital (PDC) represents DH’s equity interest in defined public assets across the NHS
15
SOURCE: Trust accounts from FIMS database 2012/13; FT Trust Accounts 2012/13…and these costs are highly variable across trusts as a proportion of book
value and revenue
Running costs as a proportion Running costs as a proportion
of book value, % of revenue, %
Barking, Havering and Redbridge University Hospitals 11 8
Barnet and Chase Farm Hospitals 17 11
Barts Health 14 12
Chelsea and Westminster Hospital (FT) 13 13
Croydon Health Services 15 9
Ealing Hospital 29 10
Epsom and St Helier University Hospitals 21 9
Great Ormond Street Hospital for Children (FT) 18 16
Guy’s and St Thomas’ (FT) 17 14
Homerton University Hospital (FT) 30 16
Imperial College Healthcare 15 13
King’s College Hospital (FT) 17 9
Kingston Hospital 26 14
Moorfields Eye Hospital (FT) 29 16
North Middlesex University Hospital 15 12
North West London Hospitals 12 9
Royal Brompton and Harefield (FT) 18 12
Royal Free London (FT) 13 8
Royal National Orthopaedic Hospital 23 8
South London Healthcare 14 16
St George’s Healthcare 27 12
The Hillingdon Hospitals (FT) 19 11
The Lewisham Healthcare 19 16
The Royal Marsden (FT) 17 11
The Whittington Hospital 20 9
University College London Hospitals (FT) 20 18
West Middlesex University Hospital 17 11
SOURCE: Trust accounts from FIMS database 2012/13; FT Trust Accounts 2012/13
16London has some of the best acute hospital buildings in the country…
Example: University College Hospital Recent
modernisation
▪ As of late 2005, the
UK was building
more new large
hospitals than all
other G7 nations
combined
▪ Furthermore, ~18%
of the stock of
hospitals in London
was built after 2005
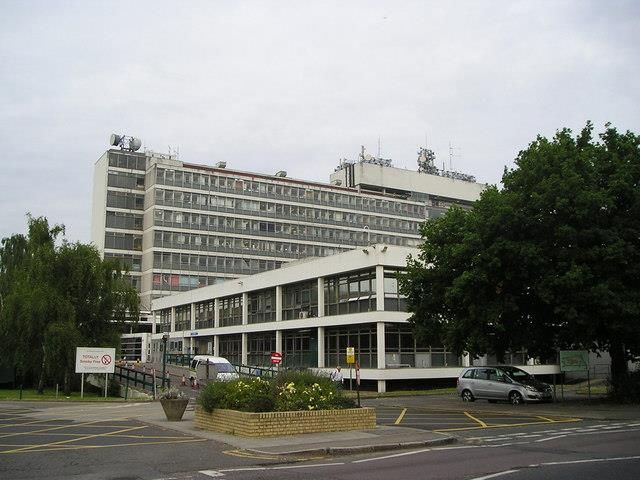
17…as well as some of the worst: ~40% is older than 30 years – and ~30%
pre-dates the NHS…
Age Profile - 2005 to present ( %) Age Profile - 1948 to 1974 ( %)
Age Profile - 1975 to 2004 ( %) Age Profile - pre 1948 ( %)
Acute - Large 17 43 16 24
Acute - Teaching 20 36 11 33
Acute - Small 16 55 19 9
Northwick Park Hospital
Acute - Multi-service 6 33 45 16
Acute - Specialist 14 26 17 42
Acute - Medium 10 58 12 19
TOTAL 17 40 15 28
Hillingdon Hospital
SOURCE: ERIC 2013; Website Review
18…which goes some way to explain the ~£600m of estates work backlog in
London’s acute hospitals
Cost to eradicate Cost to eradicate Cost to eradicate
High Risk Backlog Significant Risk Backlog Moderate Risk Backlog
(£m) (£m) (£m)
Acute - Large 65 76 75
Acute - Teaching 12 50 102
Acute - Small 10 14 10
Acute - Multi-service 4 12 35
Acute - Specialist 17 15 46
Acute - Medium 5 23 23
Total £114m £190m £290m
SOURCE: ERIC 2013, Team Analysis
19Despite the total level of work backlog declining, the proportion of high
need has grown from 8 to 15% from 2006-2011
Low Significant
Total work backlog by type and percentage split
Medium High
Cost to eradicate work backlog (£m) Cost to eradicate work backlog (%)
2011 234 343 248 140 966 24 36 26 15
2010 274 413 290 128 1,104 25 37 26 12
2009 247 403 304 115 1,069 23 38 28 11
2008 286 393 304 104 1,088 26 36 28 10
2007 306 371 299 108 1,085 28 34 28 10
2006 336 399 296 84 1,115 30 36 27 8
SOURCE: ERIC 2013, Team Analysis
20Capital revenue ratios comparing book value of land and buildings to total
clinical income
Book value of land
Trust Capital/Revenue ratio (%) and buildings (£m) Opportunity1 (£m)
South London Healthcare NHS Trust 1.10 442 182
Chelsea And Westminster Hospital NHS Foundation Trust 1.03 315 118
Great Ormond Street Hospital For Children NHS Foundation 0.89 273 74
Imperial College Healthcare NHS Trust 0.88 662 174
University College London NHS Foundation Trust 0.87 570 146
Barts Health NHS Trust 0.87 905 229
Guy’s and St Thomas’ NHS Foundation Trust 0.84 747 170
North Middlesex University Hospital NHS Trust 0.82 140 30
The Lewisham Healthcare NHS Trust 0.81 176 34
Barking, Havering And Redbridge University Hospitals NHS 0.75 306 41
North West London Hospitals NHS Trust 0.74 238 30
Barnet And Chase Farm Hospitals NHS Trust 0.67 219 8
West Middlesex University Hospital NHS Trust 0.65 92 1
Royal Free London NHS Foundation Trust 0.65 312 0
The Royal Marsden NHS Foundation Trust 0.65 159 0
Royal Brompton And Harefield NHS Foundation Trust 0.63 177 0
Croydon Health Services Nhs Trust 0.58 134 0
The Hillingdon Hospitals NHS Foundation Trust 0.57 98 0
King’s College Hospital NHS Foundation Trust 0.54 320 0
Moorfields Eye Hospital NHS Foundation Trust 0.54 71 0
Homerton University Hospital NHS Foundation Trust 0.54 126 0
Kingston Hospital NHS Trust 0.53 100 0
The Whittington Hospital NHS Trust 0.47 117 0
Epsom And St Helier University Hospitals NHS Trust 0.44 139 0
St George’s Healthcare NHS Trust 0.42 236 0
Royal National Orthopaedic Hospital NHS Trust 0.37 42 0
Ealing Hospital NHS Trust 0.35 73 0
TOTAL 7,189 1,237
1 Defined as the total book value of capital to be released by each trust to reach the median capital/revenue ratio
21
SOURCE: ERIC 2013; Trust accounts from FIMS database 2012/13; FT Trust Accounts 2012/13If each acute trust were able to achieve the same capital/revenue ratio as
the median, ~£1bn – 1.2bn could be realised
Approach Total opportunity1 Total opportunity1
(based on total trust (based on total clinical
▪ Determined book income) £m income) £m
value (land and
buildings) for acute
estate across from ACUTE - LARGE 489 459
accounts.
▪ Calculated capital to
revenue ratio for ACUTE - TEACHING 608 433
each trust across
London2.
ACUTE - SMALL 31 43
▪ Determined median
value for all acute
trusts.
ACUTE - MULTI-SERVICE 0 0
▪ Determined
movement needed
by individual trusts ACUTE - SPECIALIST 74 66
to reach the median.
▪ Calculated level of
capital needed for ACUTE - MEDIUM 34 41
release to reach
median capital to
revenue ratio. TOTAL £1.24bn £1.04bn
1 Defined as the total book value of capital to be released by each trust to reach the median capital/revenue ratio.
2 Ratio only includes capital that sits on the Trust balance sheet and not on balance sheets of other entities (e.g., charities of Trusts).
SOURCE: ERIC 2013; Trust accounts from FIMS database 2012/13; FT Trust Accounts 2012/13
22Looking at the split between FT and non-FT and where the highest
opportunities appear to be…
Split of capital/revenue ratio opportunity based on total clinical income, £m
Approximately 60% of …with large opportunities sitting within a range of different acute
opportunity sits with non-FT acute trusts across London including some larger ones in non-FT acute
trusts… trusts.
Barts Health 229
South London Healthcare 182
Imperial College Healthcare 174
Guy’s And St Thomas’ 170
University College London 146
~380
Chelsea And Westminster Hospital 118
Great Ormond Street Hospital 74
Barking, Havering And
~660 41
Redbridge University Hospitals
Lewisham Healthcare NHS Trust 34
North Middlesex University Hospital 30
North West London Hospitals 30
Barnet And Chase Farm Hospitals 8 Non-FTs
West Middlesex University Hospital 1 FTs
SOURCE: ERIC 2013; Trust accounts from FIMS database 2012/13; FT Trust Accounts 2012/13
23…as well as how the opportunity would break down across different local
health economies
Opportunity by local health economy, £m and % split Remaining Estate Opportunity
Total Current Percentage of
Size of Opportunity (£m) Estate (£m) Opportunity (%)
Barking, Havering and Redbridge 306 13.4
265 41
North Central London 1,487 258 1,745 14.7
Waltham Forest, East London and the City 802 229 1,030 22.2
North West London 1,492 323 1,815 17.8
South West London 608 0 608 0
South East London 1,298 387 1,685 23.0
£5.95bn £1.24bn £7.19bn 17.2
SOURCE: ERIC 2013; Trust accounts from FIMS database 2012/13; FT Trust Accounts 2012/13
24Only a proportion of the opportunity will be possible to realise rapidly in
the form of unused buildings
Taxonomy of opportunity for releasing capital amongst trusts
Unused buildings Can release straight away as land is truly surplus –
or pieces of land only small number of trusts are reporting available
and ready to sell land on DH database
Unused parts of Will require investment to support moving services in
buildings (e.g., other parts of the building to new locations to
empty wards) release building and affiliated land
Under-utilised Will require service re-design and enhancements to
space in used consolidate and move services to release capital
space (e.g., 50%
used ward)
Undervalued Could be relocated but would need a significant
buildings or land business case to be developed to achieve this and
(e.g., in Chelsea) strong case for large investment in re-build
SOURCE: Team Analysis
25Trusts report ~£375m book-value of under-utilised floor space – some of
which will represent the two ‘unused’ parts of the taxonomy
Book value of total estate in London, £m
Book value (land and Unused floor Book value (land and
Type of Trust buildings), £m space (%) buildings), £m
ACUTE - LARGE 2,248 8.2 185
ACUTE - TEACHING 3,162 2.7 87
ACUTE - SMALL 422 5.2 22
ACUTE - MULTI-SERVICE 98 10.3 10
ACUTE - SPECIALIST 723
4.2 30
ACUTE - MEDIUM 535 7.7 41
TOTAL £7,188m 4.8 ~£375m
SOURCE: ERIC Database 2013; Trust accounts from FIMS database 2012/13; FT Trust Accounts 2012/13
26At least 50-70% of the opportunity is likely tied up in buildings that need
re-configuration to release capital, this figure could be even higher
Illustrative split of opportunity, %
Under-utilised space
in used space
Illustrative analysis
Unused parts based on a
of buildings previous audit by
Grant Thornton
~15-30%
~35-40% which looked at
inefficient use of
land and of
buildings, shows
that just over a
third of the
opportunity is in
inefficient use of
land whilst the
majority is in
buildings that need
Unused buildings ~35-45% reconfiguration to
or pieces of land realise.
SOURCE: NHS London (former SHA); Team Analysis
27Case studies suggest that reconfiguration could vary significantly and will
need careful consideration to optimise expenditure
Example case study examples of site reconfiguration
Example One Example Two Example Three
Entire site (000m2) 4.3 11.5 16.5
Required new Required new investment, £m £5 £5 £5
investment
Net required new investment, £m 15 60 88
Land area sold for redevelopment (acre) 9.1 7.9 7.9
Land sale Sell price for per acre, £m £27 £27 £27
receipts
Land sale receipts, £m 245 215 215
Net capital gain, £m 230 165 127
Proportion of sale receipts needed for reconfiguration,
9 28 41
%
Allowing Trusts to retain 50% of capital receipts should ensure that a sufficient level of money is available to
the trusts to re-configure services
SOURCE: Team Analysis
28Based on conservative assessments of acute opportunity, it is estimated
that the following would be available to local health economies
Opportunity by local health economy, £m Funds for local health Funds for local health
economies based on economies based on
Total size of 50% from non-FTs 50% from non-FTs and
Opportunity (£m) and 0% from FTs (£m) 50% from FTs (£m)
Barking, Havering and Redbridge 41 21 21
North Central London 258 19 129
Waltham Forest, East London and the City 229 114 114
North West London 323 103 162
South West London 0 0 0
South East London 387 108 193
£1.24bn £0.36bn £0.62bn
If FTs gave up 50% of capital receipts to local health economy capital receipts,
then an additional £260m would be the opportunity
SOURCE: ERIC 2013; Trust accounts from FIMS database 2012/13; FT Trust Accounts 2012/13
29Contents
▪ Analysis of London challenges
▪ Acute estate
▪ Mental health estate
▪ Community care estate
▪ Primary care estate
30There are nine mental health trusts in London spread out across 85 sites...
Occupied floor area (m2)
Number of
Total floor space (%) Unoccupied floor space (m2) sites
BARNET, ENFIELD AND HARINGEY
64.900 8.100 6
MENTAL HEALTH NHS TRUST
CENTRAL AND NORTH WEST
78.700 1.020 14
LONDON NHS FOUNDATION TRUST
EAST LONDON NHS FOUNDATION TRUST 65.900 1.360 8
NORTH EAST LONDON
57.500 11.600 17
NHS FOUNDATION TRUST
OXLEAS NHS FOUNDATION TRUST 62.800 3.710 9
SOUTH LONDON AND MAUDSLEY
164.000 880 10
NHS FOUNDATION TRUST
SOUTH WEST LONDON AND ST GEORGE’S
71.200 22.600 6
MENTAL HEALTH NHS TRUS
TAVISTOCK AND PORTMAN 1.970
1
NHS FOUNDATION TRUST 6.730
WEST LONDON MENTAL
125.000 32.900 14
HEALTH NHS TRUST1
TOTAL 85
1 West London Mental Health NHS Trust result could be skewed due to Broadmoor Hospital
SOURCE: ERIC, 2013
31…with a total land and buildings book value of ~£1.5bn
Book value of total estate in London, £m Buildings
BARNET, ENFIELD AND HARINGEY
67 104 171
MENTAL HEALTH NHS TRUST
CENTRAL AND NORTH WEST
61 122 184
LONDON NHS FOUNDATION TRUST
FTs
EAST LONDON NHS FOUNDATION TRUST 29 111 140
NORTH EAST LONDON NHS
41 77 118
FOUNDATION TRUST
£660m
OXLEAS NHS FOUNDATION TRUST 25 65 90
£820m
SOUTH LONDON AND MAUDSLEY
71 204 276
NHS FOUNDATION TRUST
SOUTH WEST LONDON AND ST
70 105 175
GEORGE’S MENTAL HEALTH NHS TRUS
Non-FTs TAVISTOCK AND PORTMAN 8
14
NHS FOUNDATION TRUST 6
WEST LONDON MENTAL
98 213 311
HEALTH NHS TRUST1
1 Includes Broadmoor Hospital
SOURCE: ERIC 2013; Trust accounts from FIMS database 2012/13; FT Trust Accounts 2012/13 32The trusts are highly fragmented with a long tail of small sites
Gross internal site floor area (m²) – Mental Health and Learning Disability Facilities
75,000
60,000
45,000
30,000
15,000
0
Individual sites ordered by amount of floor space
SOURCE: ERIC 2013
33A comparison of the capital/revenue ratios demonstrates an efficiency
opportunity of ~£230m and over 10% unused floor space
Unused floor Indicative
Capital/Revenue ratios2 space (%) Opportunity1
BARNET, ENFIELD AND HARINGEY 11% ~£66m
MENTAL HEALTH NHS TRUST 0.90
CENTRAL AND NORTH WEST
0.49 1% -
LONDON NHS FOUNDATION TRUST
EAST LONDON NHS FOUNDATION TRUST 0.54 2% ~£3m
NORTH EAST LONDON
0.37 17% -
NHS FOUNDATION TRUST
OXLEAS NHS FOUNDATION TRUST 0.45 6% -
SOUTH LONDON AND MAUDSLEY
NHS FOUNDATION TRUST 0.74 1% ~£63m
SOUTH WEST LONDON AND ST GEORGE’S
MENTAL HEALTH NHS TRUS 1.07 24% ~£98m
TAVISTOCK AND PORTMAN
NHS FOUNDATION TRUST 0.38 23% -
TOTAL 11% ~£230m
1 Defined as the total book value of capital to be released by each trust to reach the median capital/revenue ratio.
2 Analysis does not include West London Mental Health Trust as unable to separate out the impact of capital of Broadmoor Hospital.
SOURCE: ERIC 2013; Trust accounts from FIMS database 2012/13; FT Trust Accounts 2012/13
34Contents
▪ Analysis of London challenges
▪ Acute estate
▪ Mental health estate
▪ Community care estate
▪ Primary care estate
35Roughly half of the community care estate in London is owned by NHS
Property Services which has a total book value of £478m
Limitations of data Total Gross
Internal Total Net Book Total Running
▪ Only data from Area1, m2 Value, £ ‘000s costs, £ ‘000s
NHS Property
Services and does Health centre/GP
229,204 289,755 51,444
not include surgery/Clinic
community
Residential (other
premises from 2,518 440 100
than nursing/care home)
CHP (LIFT
premises). Unknown 2,378 471 1,880
▪ Data also includes
general practices
Offices 59,069 19,064 33,603
owned by NHS
Property Services
and has been Other 4,313 0 182
included here and
not in primary care Hospital/hospital related 117,876 139,793 37,561
analysis.
▪ Some data is Nursing/care home 13,601 20,709 2,353
incomplete on
utilisation and
therefore reported Land with buildings 3,799 8,034 264
under-utilisation
could be higher. 433,000 £478m £127m
TOTAL
1 Does not include all premises where data was incomplete; roughly includes 90% or more.
SOURCE: NHS Property Services, Team Analysis
36Reported data shows £43m of unutilised space amongst NHS Property
Services properties; though this figure will likely be higher
Utilised Total Net Book Value split by Utilised and Percentage
Unutilised Unutilised space1, £ ‘000s Unutilised space, %
Health centre/GP
256,296 33,459 12%
surgery/Clinic
Residential (other 440 0 0%
than nursing/care home)
467 4 1%
Unknown
18,802 263 1%
Offices
Other 00 -
Hospital/hospital related 134,328 5,465 4%
Nursing/care home 20,327 382 2%
Land with buildings 4,073 51%
3,961
TOTAL £478m £43m 9%
1 Data does not include premises that showed as 100% unutilised as discrepancy could be due to data inaccuracies; relates to 5-10% of premises.
SOURCE: NHS Property Services, Team Analysis
37The other portion of the community estate is owned by CHP whose
properties are valued at just under £500m
Total Gross Internal Void Property Value,
Area, m2 Property Value, £m £m
Barking Dagenham Havering
18,753 68 2
Community Ventures Ltd
Bexley, Bromley &
12,779 39 1
Greenwich LIFTCo Ltd
Brent Harrow and
6,260 18 1
Hillingdon LIFT Co Ltd
Building Better Health - Lambeth,
19,384 52 1
Southwark & Lewisham L
Building Better Health -
18,060 65 4
West London Limited
Camden & Islington Community
8,067 23 1
Solutions Limited
East London LIFT Accommodation
28,822 91 7
Services Limited
North London Estate
29,103 72 9
Partnerships Ltd (NLEP)
Redbridge Waltham Forest Health
7,249 15 0
and Community Developers
South West London Health
11,104 30 0
Partnerships Limited
TOTAL 160,000 £474m £27m
SOURCE: CHP, Team Analysis
38Triangulating community estate analysis in South and NWL suggests there
is between £60-100m surplus community estate across London
Analysis in South London Analysis in NWL1 Triangulation for London
Number of
141 148 722
Sites
Net Book
211.7 - 1,041
Value (£m)
Premise
29.3 - 144
Costs (£m)
Backlog (£m) 7.0 - 34.5
Identified
60-
disposals 20.4 12.9
(£m)2
100
1 Analysis in North West London only considered NBV of disposals, not entire estate, premise costs or back-log
2 Different approaches used to determine disposals; South London focused on identifying disposals whereas NWL was self-reported
SOURCE: TSA; NHS North West London Shaping a Healthier Future; Team Analysis
39Contents
▪ Analysis of London challenges
▪ Acute estate
▪ Mental health estate
▪ Community care estate
▪ Primary care estate
40There are 1,433 primary care practices across London, 193 are located in
community care centres leaving 1,240 general practice premises
Number of practices1 Average list size
Range of list
NHS Barking And Dagenham CCG 39 5,144 sizes across
NHS Barnet CCG 62 5,653
London
NHS Bexley CCG 25 8,390
NHS Brent CCG 63 5,229 Lowest
NHS Bromley CCG 43 7,038
NHS Camden CCG 35 6,381 848
NHS Central London (Westminster) CCG 30 5,793
NHS City And Hackney CCG 23 5,266
NHS Croydon CCG 54 6,448
NHS Ealing CCG 75 5,110
NHS Enfield CCG 50 5,603 Lower quartile
NHS Greenwich CCG 38 5,906
NHS Hammersmith And Fulham CCG 24 7,123 3,335
NHS Haringey CCG 47 5,168
NHS Harrow CCG 30 7,061
NHS Havering CCG 50 5,103
NHS Hillingdon CCG 39 5,905
NHS Hounslow CCG 34 5,323 Median
NHS Islington CCG 36 6,205
5,351
NHS Kingston CCG 27 6,718
NHS Lambeth CCG 42 7,160
NHS Lewisham CCG 37 7,213
NHS Merton CCG 23 8,201
NHS Newham CCG 49 5,854
NHS Redbridge CCG 40 5,854 Upper quartile
NHS Richmond CCG 26 6,509
7,945
NHS Southwark CCG 34 6,984
NHS Sutton CCG 21 6,532
NHS Tower Hamlets CCG 24 7,530
NHS Waltham Forest CCG 43 6,457
NHS Wandsworth CCG 34 8,251
NHS West London (K&C & QPP) CCG 43 4,086 Highest
27,564
TOTAL – LONDON 1,240 6,287
1 Does not include 193 properties that contain GPs (as per HSCIC list) but owned by NHS Property Services
SOURCE: HSCIC, NHSPS, Team Analysis
41Of those practices not in community care centres, very indicative assessments
of the market value suggest it could be worth in the region of ~£1.3bn
Indicative market value of practices1, £m Number of practices
NHS West London CCG 147 43
NHS Central London CCG 122 30
NHS Camden CCG 88 35
NHS Wandsworth CCG 59 34
NHS Islington CCG 72 36
NHS Lambeth CCG 59 42
NHS Barnet CCG 62 62
NHS Hammersmith And Fulham CCG 44 24
NHS City And Hackney CCG 25 23
NHS Brent CCG 50 63
NHS Ealing CCG 51 75
NHS Southwark CCG 46 34
NHS Richmond CCG 38 26
NHS Tower Hamlets CCG 30 24
NHS Haringey CCG 32 47
NHS Hounslow CCG 23 34
NHS Bromley CCG 34 43
NHS Croydon CCG 29 54
NHS Lewisham CCG 29 37
NHS Enfield CCG 27 50
NHS Merton CCG 29 23
NHS Greenwich CCG 22 38
NHS Hillingdon CCG 21 39
NHS Newham CCG 21 49
NHS Redbridge CCG 22 40
NHS Harrow CCG 21 30
NHS Waltham Forest CCG 23 43
NHS Kingston CCG 23 27
NHS Havering CCG 20 50
NHS Sutton CCG 11 21
NHS Barking And Dagenham CCG 14 39
NHS Bexley CCG 12 25
1 Does not include 193 properties that contain GPs (as per HSCIC list) but owned by NHS Property Services
42Using indicative numbers, ~13% of primary care estate is in such poor
condition it requires significant refurbishment or rebuild…
Proportion of GP premises in poor Examples of GP premises in poor condition
condition
Terrible Excellent
Very Poor
Poor 6.4%
6.8%
2.4%
3.7%
Total =
~13%
Good
rebuild 29.5%
51.2%
Average Total =
~51%
refurbish
Buildings in poor condition need renovating to meet minimum standards and buildings in very poor or
terrible condition need to be completely rebuilt
SOURCE: NHS North West London Shaping a Healthier Future
43…and ~34% does not meet disability access requirements and needs
rebuilding
Proportion of GP premises that do not Examples of GP premises that do not meet
meet disability access requirements disability access requirements
Total = Excellent
~34% 0%
rebuild Good
21.8%
25.5%
Terrible
8.5%
Very Poor
0%
Poor
Total = 44.2%
~44%
refurbish Average
Buildings in poor condition need renovating to meet minimum standards and buildings in very poor or
terrible condition need to be completely rebuilt
44An investment of at least ~£200m would be needed just to bring practices
up to minimum standards
NWL’s ‘Shaping a Healthier Future’ …extrapolating this across London
programme estimated the number of non- suggests that ensuring compliance of
compliant DDA practices across the area… all GP premises in London will cost
£200m
Estimated Average cost per Estimated number Total estimated
proportion of premise to make of practices cost for London
practices1 compliant (£ ‘000s) across London (£m)
Compliant 39% - 560 -
practices
Practices 30.5% 40 470 £18.8
needing
updating
Practices 30.5% 380 470 £179
needing
rebuilding
Total 940 ~£200
1 Based on estimates from North West London
SOURCE: NHS North West London Shaping a Healthier Future; ONS
45Assumptions on what rebuild and refurbishment would cost to extrapolate
for London
Building related costs Land costs
Estimated cost – for premises Estimated cost – extrapolated
Key assumptions surveyed and in database1 to all CCGs2
Upgraded / Make compliant:
▪ Cost to upgrade based on survey and
estimates of work needed by DJD (for
surveyed premises). 40
▪ Projection scaled based on list size.
Rebuild / Reprovision: 74
▪ GP premises assumed to occupy reduced 17
footprint due to improved utilisation and 32 29
opening hours5.
13
▪ Cost to build per sq.m is half that of hubs
(£2.6k). 2 5
▪ Some premises modelled to co-locate to hubs
Upgrade/ Rebuild/ Total Upgrade/ Rebuild/ Total
(smaller premises and Dx rated)3,4. make reprovision make reprovision
▪ Average cost of land/sqm of built space varies compliant compliant
by CCG depending on typical plot sizes for 100 Non-DX DX Non-DX DX
sq.m of built space (plot sizes do not
necessarily scale to building space).
1 Excludes Brent.
2 For all 7 CCGs participating in survey, extrapolated based on participating practices; Brent CCG estimated based on Ealing figures.
3 Some of the smaller practices (i.e., less than 3k patients) will co-locate in the process of re-provision.
4 Where the hub modelling involves co-location of GP practices, these are assumed to be DX practices where possible and cost is not double-counted
across the hub and the GP practice estimates.
5 approx. 30m2 per 1000 patients on the list size.
Source: DJD database of surveyed GP practices; estimates
46For primary care, property improvements could be incentivised
▪ The existing primary care estate is fragmented and in ~60% of
cases is not fit for purpose
▪ However, GPs are currently not incentivised to re-locate from
existing premises to more appropriate premises:
– GP practices receive reimbursement of rent at market rates,
meaning no incentive to move.
– Where GPs own their premises, they receive capital gains on
estate, creating incentives to maximise value at point of sale
rather than value as a healthcare asset.
– GPs cannot sell goodwill in their practice and so there is a
lessened incentive to build better facilities to serve patients
better.
47A simpler framework for making investment decisions in primary care
is needed with more ownership for Strategic Planning Capital Boards
Guiding principles for change
▪ Overall process needs to be
simplified to reduce the current
barriers for driving change:
– Clearer sign-off;
– Less steps; and
– Better link to commissioning of
care.
▪ Decision making needs to shift
closer to the ground with local
health economies:
– Decisions regarding high cost/
price by NHSE London region,
not DH or NHSE;
– Lower cost/ price decisions by
Strategic Planning Capital Boards
not NHSE London region.
▪ Consistent framework across London
but with local ownership for
Individual Strategic Planning Capital Boards (defined and
application of framework and
described later in document) will need to understand their
own processes and NHSE London region should co-ordinate overseeing process via local health
design of a framework to drive local ownership of decisions. economy Capital Boards.
SOURCE: Team Analysis 48Estates strategic planning should be integrated into commissioning of
care
Current Situation: Estates strategic Future Situation: providers to submit
planning de-coupled from estates strategic plan co-ordinated
Issue commissioning and fragmented with commissioning plans
▪ Estates strategies are set on a ▪ Estates strategies to be co-ordinated via
Fragmented
provider-by-provider basis and strategic planning groups (local health
strategic
approved via separate processes and economies) and incorporate necessary
planning
organisations (e.g., TDA for acute estates requirements.
providers, NHS England for primary
care).
▪ Different processes for different ▪ Strengthen and co-ordinate decision
Complexity
providers and lack of clarity for some making across providers and bring
of decision
providers on requirements for approval greater coherence and clarity to sign-offs
making
of capital investment in estates. and approvals.
▪ Estates strategy de-coupled from ▪ Incorporate setting estates strategy into
Separation
commissioning which is focused purely strategic planning to ensure that CCGs
from com-
on clinical care but not how clinical care and local health economies submit basic
missioning
is enabled via buildings. estates strategies demonstrating support
to commissioning of care.
SOURCE: Team Analysis 49The development of Strategic Planning Capital Boards would support
capital investment including re-investment of released capital
▪ Develop governance to oversee and manage effective use of capital including disbursement of released
capital.
▪ Include representatives from CCGs, Providers and local authorities.
▪ Purpose of Boards could include investing in:
– Out of hospital transformation;
– Primary care improvements;
– Investment in new care innovations;
– Workforce; and
– Information and data.
▪ Framework with clear evaluation criteria and assessment process would need developing to ensure most
efficient re-deployment of capital.
Description Advantages Disadvantages
▪ Capital receipts all ▪ Enables full ▪ Neglects any pan-
repurposed in local health empowerment of London
Strategic
economies. clusters where transformational
Planning
Capital
▪ Criteria for re-investing implementation investments.
capital would be made set occurs. ▪ Siloed mentality and
Boards
at local health economy approach.
level.
50Examples of good collaboration between health and social/public sector
exist in London, and more should be possible
Description
Earl's Court ▪ Site provides the following services for population:
Health and – NHS GP practice and walk-in service;
Wellbeing – NHS dental practice; This proposal
Centre – Free sexual health and contraception clinics; should put more
– A varied set of wellbeing services including wellbeing emphasis on
coaching; and Local Authorities
– Community resources including Centre Champions and and NHS bodies
rooms for community use. supporting this
▪ Health and Wellbeing Centre is funded by the NHS and type of service
operated by Turning Point, Greenbrook Healthcare, reconfiguration
Terrence Higgins Trust and NHS Dentist. which not only
benefits health
▪ Purchased additional land via BBC site disposal and local and care
Imperial West services; but
deal to reconfigure to meet growing needs.
also the broader
▪ Current plans for site:
health economy
– £150 million Research and Translation Hub, with
and public and
facilities for 1,000 scientists and engineers and space
social sector
for 50+ spin out companies.
goals across
– Accommodation for students and early-career
London.
researchers.
– In addition, include homes, publicly accessible green
space, pedestrian subways and leisure and retail
facilities, alongside the creation of thousands of jobs.
SOURCE: Team Analysis 51The Metropolitan Police have worked with the Mayor’s office to support
service redesign and efficiency savings
Situation
The Metropolitan Police’s estate has not been efficiently used in the past. The director of the Metropolitan Police Property
Service revealed in 2013 that only 60% of desks were occupied at any one time. Other facilities such as the Metropolitan
Police’s training centre at Hendon has even lower utilisation of around 20%.
Mayoral involvement Coordination Impact
▪ the Mayor’s office for policing and ▪ The police service ▪ Disposing of inefficient buildings:
crime (MOPAC) was set up in together with MOPAC – Dozens of police stations will be closed, mainly in
January 2012 and is led by the published the most Victorian buildings with high running costs.
Mayor of London. recent estate strategy
for the Metropolitan
– the Police Training Centre at Hendon is being
▪ MOPAC is the owner of the
Police in 2013 outlining
disposed through the Mayor’s London
Metropolitan Police Services’ Development Panel. The panel allows for the fast
how the estate will be
estate and has extensive financial tracking of the disposal of public land to boost
overhauled and running
responsibilities including ensuring construction and housing. Estimates suggest that
costs reduced.
the estate is run efficiently and the redevelopment of the site will halve running
effectively given the limited ▪ Under the strategy the costs at the training centre.
resources available. Metropolitan police is – The Metropolitan police headquarters is planned
committing to get rid of to be moved from one of London’s most famous
▪ Estate management is handled
inefficient buildings, and
by the Metropolitan Police landmarks to a new smaller site on the
to use the money saved Embankment.
Property Service, which is
towards investing in new
responsible for achieving ▪ Co-locating with other public organisations:
modern facilities.
efficiency, and has moved to a
more corporate approach to the
– Closed stations will be replaced by “access
points”. These access points could be sites in co-
planning.
located premises with other public service
providers such as in community centres.
SOURCE: Greater London Authority, MOPAC/MPS Estate Strategy 2013-2016, Property Week 52London fire brigade has disposed of many under-utilised properties and
is now investing in station improvements
Situation
Major challenges that face the fire brigade are age of properties, and how fit for purpose their buildings are. Today 40% of the
estate is over 60 years old, and many of them were originally designed for horse-drawn engines, and not for modern day fire
fighting. Historically, investments in fire station improvements have been inconsistent.
Mayoral involvement Coordination Impact
▪ London Fire Brigade is run by the ▪ The London Fire brigade ▪ Disposing of inefficient buildings: LFB holds
London Fire and Emergency has pro-actively very little property or land that is not required for
Planning Authority (LFEPA), reviewed their entire operational purposes, but some buildings are still
whose members are appointed estate, and has used this being disposed of:
by the Mayor. The organisation to prioritise their – Plans are in place to sell the former
belongs to the Greater London property improvement. Headquarters site at Albert Embankment and
Authority (GLA) that set the enter into a contract with the re-provision of a
budget requirement for LFEPA. fire station on the site.
▪ The Fire Brigade has to make – Under the new savings targets 10 stations are
savings worth £28.8m up until being closed.
2016. As part of this, property
services will be reviewed, options
▪ Improving the fire station estate
will be explored for further – The brigade will receive £51.5 million in private
shared services, and cuts will be finance initiative (PFI) credits from central
made to the stations. government to rebuild 9 stations, and build 9
new fire stations as part of the PFI project. The
new fire stations will replace buildings that are in
a poor condition and no longer meet modern
requirements.
SOURCE: London Fire Brigade Asset Management report 1011, LFEPA 53Given the lack and fragmentation of data across estates in London, an
asset register is needed to create a shared understanding
Book value, FTs (PFI) FTs (non-PFI) Trusts (PFI) Trusts (non-PFI)
£bn
Need for Asset Register given
Acute 0.32 2.85 1.33 2.69 fragmented and incomplete data
▪ Purpose of asset register:
– Give London one single view
Book value, FTs (PFI) FTs (non-PFI) of property across different
Non-FTs (non-PFI)
£bn settings of care.
Mental – Create greater transparency of
Health 0.06 0.76 0.66 data and information to drive
awareness of issues.
– Build data driven platform to
make decisions via Strategic
Number of PropCo CHP/LIFT Planning Capital Boards
premises,
Community very rough ▪ Information to include in asset
estimates ??? ??? register:
Care1
– Size of estate;
– Value of estate;
– Condition; and
Number of
premises, PropCo CHP/LIFT Privately Held Unknown – Usage.
Primary very rough ▪ Information to be made publically
Care estimates available and audited.
193 ??? 931 ???
1 Estimates for ownership split for community and primary care should be viewed as directional and not be heavily relied upon given definitional
differences, data gaps and no recent picture of privately held GP practices in London (estimate is UK based in 2006).
SOURCE: ERIC 2013, Trust accounts from FIMS database 2012/13; FT Trust Accounts 2012/13, NHSPS, Web Searches, Team Analysis
54You can also read