SHORT-TERM OUTLOOK FOR EU AGRICULTURAL MARKETS IN 2020 - AUTUMN 2020 - Olive Oil Times
←
→
Page content transcription
If your browser does not render page correctly, please read the page content below
SHORT-TERM OUTLOOK
              FOR EU AGRICULTURAL MARKETS
              IN 2020

              AUTUMN 2020
              Edition N°28

Agriculture
and Rural
Development
Executive Summary

Manuscript completed in October 2020
European Commission
© European Union, 2020
Reuse is authorised provided the source is acknowledged.
The reuse policy of European Commission documents is regulated by Decision 2011/833/EU (OJ L 330, 14.12.2011, p. 39).
For any use or reproduction of photos or other material that is not under the copyright of the European Union, permission must be sought directly from the copyright holders.

EN PDF         ISSN 2600-0873              KF-AR-20-003-EN-N

While all efforts are made to provide sound market and income projections, uncertainties remain.
The contents of this publication do not necessarily reflect the position or opinion of the European Commission.

Contact: DG Agriculture and Rural Development, Analysis and Outlook Unit
Email: agri-outlook@ec.europa.eu
https://ec.europa.eu/info/food-farming-fisheries/farming/facts-and-figures/markets/outlook/short-term_en
Please cite this publication as: EC (2020), Short-term outlook for EU agricultural markets in 2020.
European Commission, DG Agriculture and Rural Development, Brussels.
HIGHLIGHTS
                                                          complete overhaul of the food system, with for
 This short-term outlook edition is based on              instance an increase in e-commerce food sales as well
 market intelligence available until mid-                 as the demand for local food and short supply chains.
 September 2020 and reflects the Covid-19                 In this context, the situation in 2020 remains globally
 impact to the extent possible. Market forecasts          positive: dairy and meat prices recovered from some
 are presented for the EU-27 and assume                   weakening during the acute phase of the Covid-19
 frictionless trade between the EU and the UK for         crisis; milk collection growth remains strong; the
 the rest of 2020 and for 2021.                           positive trade balance in meat is increasing; the oilseed
                                                          and protein production is estimated to increase; EU
This autumn edition of the DG AGRI short-term outlook     olive oil exports will reach a new record level. Notable
faces the challenge of factoring in the fallouts of the   exceptions are cereals (in particular wheat) and sugar,
Covid-19 crisis in 2020 and 2021.                         both having suffered from adverse weather and/or
Relatively spared so far compared to other, harder hit    plant health conditions.
sectors of the EU economy, the agri-food sector has not   Many uncertainties remain, particularly about the
been immune to the impacts of the crisis, i.a. because    extent of the second wave of Covid-19 contaminations
of the reduced demand in foodservice, resulting in a      and about the success of the measures adopted by
lower consumption of some food products. Changes in       governments to mitigate the economic consequences.
consumption channels also affected the marketing of       This makes particularly delicate the exercise to forecast
products less likely to be sold in retail.                the shape of the economic recovery, the impact on food
Overall, the impact of the crisis on food markets has     demand and ultimately the impact on agricultural
remained limited thanks to the resilience of the food     markets for 2021.
chain. The emerging pattern seems to be that of a
reinforcement of some pre-existing trends rather than a
                                                                                                                  3
Highlights
A major uncertainty remains for the future trade            24 million t, a 35% decrease year-on-year. Maize          Specialised crops
relationships between the EU and the UK. As                 imports would increase, driving overall cereals imports
                                                                                                                      EU olive oil exports continue to grow, reaching a new
negotiations are still on-going at the time of finalizing   up slightly (+2% year-on-year).
                                                                                                                      record level in the 2019/20 campaign. Despite
this edition, the assumptions used for the previous
                                                            Total EU cereal consumption is due to slightly            reduced tourism and food services uses, domestic
STOs are maintained: continuation in terms of trading
                                                            decrease in 2020/21 (-0.7% year-on-year).                 consumption is likely to increase in the main
relations currently applicable between the EU and the
                                                                                                                      producing regions. In 2020/21, around 2.2 million t is
UK after 31st December 2020.                                EU oilseed production is estimated to increase slightly
                                                                                                                      to be produced. This year’s record level of exports
                                                            compared to the last campaign but to remain below
The first reported outbreaks of African Swine Fever                                                                   might not be exceeded next year because of existing
                                                            the 5-year average. Total oilseed meal consumption
(ASF) in wild boars on the Eastern border of Germany,                                                                 stocks in some destinations. Due to an uncertain
                                                            could slightly decline by 0.5% year-on-year. Protein
and the subsequent closure of key (Asian) export                                                                      economic recovery, only a slight EU consumption
                                                            crops production is forecast to reach 4.5 million t, a
markets to German exports of pigmeat, give rise to                                                                    growth is expected.
                                                            10% increase compared to last year. EU consumption,
strong concerns on the trade front, considering the
                                                            especially of feed, would rebound next year.              Strong demand in 2019/20 for fresh oranges – in part
share of Germany in those EU exports.
                                                                                                                      to substitute for the consumption of processed orange
                                                            Sugar
Arable crops                                                                                                          juice – led to increased imports (attaining possibly
                                                            EU + UK sugar exports are forecast at 0.8 million t for   1 million t), with exports dropping by 15%. Due to
Total EU cereal production is estimated at
                                                            2019/20, their lowest level in 10 years. Sugar use,       favourable weather conditions, the 2020/21 EU
274.3 million t, 6.8% below last year, with soft wheat
                                                            impacted by Covid-19, could decrease by 0.5 million t     orange production could reach the same high level as
production down to 115.5 million t, and maize
                                                            compared to the previous year. The 2020/21 crop           two years ago (around 6.5 million t).
production at 63.1 million t, mostly due to adverse
                                                            suffered from a rain deficit and diseases resulting in
weather conditions that weighed on yields.
                                                            the upcoming 2020/21 EU sugar production forecast
Trade over the 2020/21 marketing year is expected to        at 15.9 million t (-2% compared to 2019/20).
decline, in particular due to wheat exports falling to

                                                                                                                                                                               4
Highlights
The 2020/21 EU apple production is forecast to reach     structurally declining trend of drinking milk production   The production of poultry increased(+1%) in response
11.5 million t (-2%/5-year average). With the previous   has been interrupted in 2020 due to increased              to a demand shift to less expensive meats.
marketing year’s stock almost cleared, the market        domestic and export demand.
                                                                                                                    The situation is less favourable for sheep meat and
seems well balanced for the upcoming season.
                                                         In 2021, adjustments of some distribution channels         pigmeat. The sheep meat market faces strong global
A low availability of peaches and nectarines and high    (e.g. e-commerce, takeaways) are expected to support       and domestic supply shortages (production
prices have led to a sharp drop in the EU consumption    the recovery of dairy consumption. Drinking milk           growth -3%), hampered by the uncertainty linked to
of fresh peaches in 2020.                                consumption should get back to its normal decreasing       the EU-UK trade negotiations.
                                                         trend.
EU imports of fresh tomatoes are expected to                                                                        The outbreak of African Swine Fever in Germany mid-
continue to increase in 2020 (+7%), driven by a          The pace of production in 2021 remains uncertain,          September hit the pigmeat market, with immediate
growth of imports from Turkey and to a lesser extent     even if it is very likely that the high growth rates of    import bans implemented by key partners: China,
from Morocco.                                            2020 would be hard to repeat given a slow rate of          South Korea and Japan. This puts significant pressure
                                                         economic and consequently demand recovery. It could        on the German and therefore the EU market.
Dairy
                                                         grow by 0.8%.
                                                                                                                    Overall meat trade prospects will remain positive for
EU milk collection growth remains strong and the
                                                         Meat                                                       2020. A lower demand from foodservice coinciding
collection could increase by 1.4% in 2020. This growth
                                                                                                                    with tighter global supplies led to reductions in
is driven by an increase in yield and a lower herd       The EU meat market has started to stabilise, and
                                                                                                                    imports, and exports continued to expand except for
reduction rate because of delayed seasonal               prices of all meats have been going up since mid-
                                                                                                                    poultry.
slaughtering. Dairy prices remained stable and even      May.
increased (butter) after the initial drop due to the
                                                         The situation for beef and poultry was better than
Covid-19 outbreak. This will further support EU
                                                         expected in Q2. The decline in beef production in
exports, mainly in WMP, SMP and butter. The
                                                         2020 is revised upwards to -1.4% compared to 2019.

                                                                                                                                                                            5
Macroeconomic background
MACRO-                           Uncertainty continues for 2020 and
                                 2021 amid slow recovery
                                                                                                                   The unprecedented drop in economic output in Q2
                                                                                                                   2020 (–11.4%) turned lower than expected,
                                                                                                                   economic production has been increasing since

ECONOMIC
                                  The macroeconomic conditions in the EU started to                                June, and short-term indicators point to a rebound
                                  improve since the June 2020 forecast, supported                                  already in Q3 (+8%).
                                  by fiscal, monetary and labour market policies.
                                                                                                                   On the other hand, prospects for a prompt
                                  Nevertheless, growth in 2021 should be slower

OUTLOOK
                                                                                                                   recovery in 2021 worsened, as reported in the
                                  than expected before the summer, undermined by
                                                                                                                   recent European Central Bank2 forecast (+5% for
                                  worsening labour market conditions, and the full
                                                                                                                   the Euro area, assuming a vaccine would be
                                  recovery would be reached only in 2022.
                                                                                                                   available, wide-spread and effective by end-
                                  Uncertainties remain, in particular regarding the                                2021). A “milder” scenario with the virus contained
                                  evolution of the Covid-19 crisis and the extent of a                             and the success of economic policy measures,
                                  second wave of infections, which are already                                     anticipates the Euro area real GDP in 2022 to be
                                  increasing in several countries, including EU ones.                              above the level forecast at the end of 2019. In
                                  Forecasts in this edition do not factor-in the                                   contrast, in a “severe” scenario, the real GDP
                                  impact of a major second wave.                                                   growth would be as low as 0.5% in 2021.

                                 Lower GDP decline in 2020, but slower                                                                            Euro area real GDP scenarios

                                                                                                                     index 2019 = 100
                                                                                                                                        105                                                5%
                                 recovery in 2021

                                                                                                                                                                                                  growth
                                  The European Commission1 expects real EU GDP to                                                       95                                                 -5%
                                  decline by 8.3% in 2020, before a rebound at                                                          85                                                 -15%
                                  +5.8% in 2021. That assumes no major second                                                                   2019       2020        2021      2022
                                  wave of infections, confinement measures                                                                    mild (index, lhs)         baseline (index, lhs)
           ©fotoVoyager iStock

                                  gradually lifted, and continued physical distancing                                                         severe (index, lhs)       mild (growth, rhs)
                                  measures.                                                                                                   baseline (growth, rhs)    severe (growth, rhs)
                                                                                                                          Source: European Central Bank.
                                 1 DG Economic and Financial Affairs: https://ec.europa.eu/info/business-economy-euro/economic-performance-and-

                                  forecasts/economic-forecasts/summer-2020-economic-forecast-deeper-recession-wider-divergences_en
                                 2 European Central Bank: https://www.ecb.europa.eu/pub/projections/html/ecb.projections202009_ecbstaff~0940bca288.en.html
                                                                                                                                                                                                           6
Macroeconomic background
                                                                                                        Volatile energy markets and exchange rate challenging exports
                          Brent crude oil (lhs) and UK natural gas (rhs)
                                          price forecasts                                               IHS Markit expects the gas price to rebound in Q3 2020, after a lowest in Q2 2020. The winter
                  60                                                               6                    season should sustain that increase.

                                                                                       gas, USD/MMBtu
oil, USD/barrel

                  40                                                               4                    The Brent crude oil price remains low, at around USD 45/barrel in Q3 2020, recovering from the
                                                                                                        oversupply in spring, although still under reduced demand.
                  20                                                               2
                                                                                                        After a significant drop in 2020 (0.6% in the EU), inflation is expected to rebound to 2019
                  0                                                                0                    levels in 2021 (1.3%).
                                                                                                        IHS Markit foresees the EUR/USD exchange rate to continue decreasing until 2021, by 6.3%
                                                                                                        compared to 2019, reaching 0.84, likely to have a negative impact on EU competitivity in world
                               Oil, June 2020 (lhs)      Oil, Sept 2020 (lhs)                           markets.
                               Gas, June 2020 (rhs)      Gas, Sept 2020 (rhs)

Source: IHS Markit.                                                                                     Expected labour market deterioration until 2021 delayed for now
                         Unemployment in the Euro area (share of active
                                                                                                        The increase in EU unemployment has been mitigated until now (from 6.5% in February to
                                         population)
                                                                                                        7.2% in July) thanks to measures implemented by EU governments (short-time work, technical
9.5%                                                                                                    unemployment, restrictions on layoffs).
9.0%                                                                                                    The situation of the labour market may however worsen in 2021 due to the insufficient speed
8.5%                                                                                                    of economic recovery, as forecast by the European Central Bank. For the Euro area, the
                                                                                                        unemployment rate might jump from 7.3% in Q1 2020 to 9.5% in 2021 before starting to
8.0%
                                                                                                        decrease in 2022.
7.5%
                                                                                                        The increase in unemployment is impacting unevenly upon the different segments of the active
7.0%                                                                                                    population: young workers, the self-employed, and low-paid and part-time jobs are the most
                       2018      2019        2020           2021        2022    2023
                                                                                                        hit; civil servants and people who can work remotely are less affected.
                                           ECB        IHS Markit

Sources: European Central Bank, IHS Markit.
                                                                                                                                                                                                         7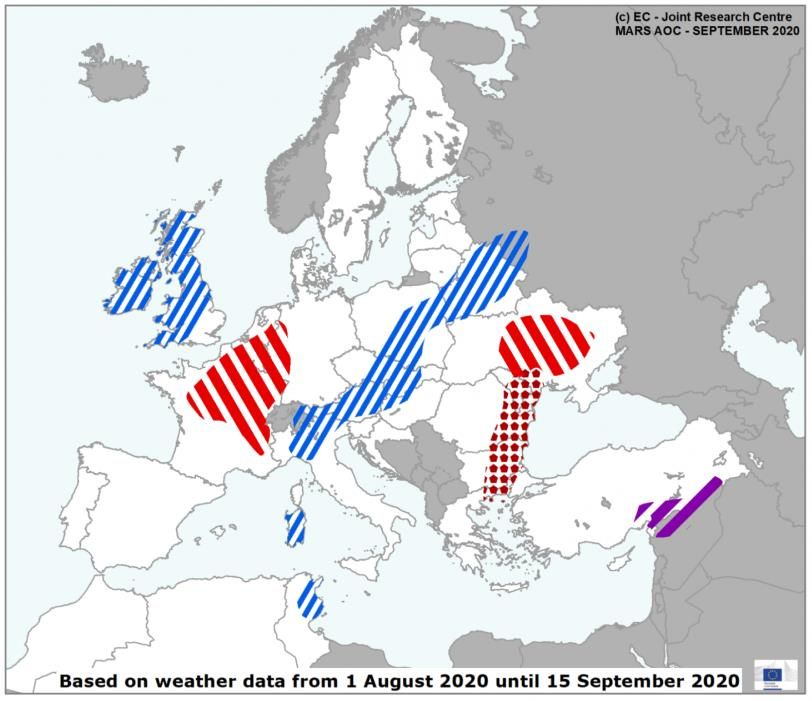
Market developments in the EU
ARABLE                          CEREALS

                                Production
                                                        2019/2020

                                                           +9.4%
                                                                       2020/2021

                                                                         -6.8%
                                                                                   OILSEEDS

                                                                                   Production
                                                                                                 2019/2020

                                                                                                   -8.7%
                                                                                                             2020/2021

                                                                                                              +0.9%

CROPS                           Exports

                                Imports
                                                            +54%

                                                            -14%
                                                                         -29%

                                                                         +2.1%
                                                                                   Exports

                                                                                   Imports
                                                                                                   +3.2%

                                                                                                   +14%
                                                                                                               -1.8%

                                                                                                               -4.3%

                                Consumption                 -0.4%        -0.3%     Consumption     +0.2%       -2.6%

                                PROTEIN
                                                        2019/2020      2020/2021   SUGAR         2019/2020   2020/2021
                                CROPS
                                Production                  -0.9%        +10%      Production      -1.3%       -2.1%

                                Exports                     -10%         -0.7%     Exports         -50%       +9.1%

                                Imports                     -11%         -11%      Imports         -2.8%      +0.0%

                                Consumption                 -3.1%       +5.1%      Consumption     -2.5%      +1.5%
         © instamatics iStock

                                •Note: % compared to previous season

                                                                                                                         8
EU total cereal and wheat production 2020/21
                                                                     Extreme weather
                                                                                                               EU weather conditions affected cereals production
                                                                     events
                                                                                                             The persistently dry conditions over the summer across many parts of the EU influenced negatively
                                                                                                             the different stages of plant development. Total EU 2020/21 cereals production is expected to reach
                                                                                                             274.3 million t, -6.8% compared to 2019/20 (-2.6%/5-year average).
                                                                                                             High temperatures over the summer affected large parts of FR, RO, the Benelux countries, DE and BG.
                                                                                                             The average daily temperature exceeded the seasonal values by 2 to 3 degrees. The number of hot
                                                                                                             days (>30⁰C) was also significantly higher compared to the long-term average. It was above 15 days
                                                                                                             in the Mediterranean region and Black Sea countries, and between 5-10 in FR, the Benelux countries
                                                                                                             and northern DE.
                                                                                                             In August, significant rainfall in central EU, eastern PL and IE was beneficial for summer crops, while a
                                                                     Source: Joint
                                                                                                             lack of rainfall and high temperatures in southern ES impacted upon the water availability.
                                                                     Research Centre (JRC
                                                                     MARS Bulletin Vol.                        Soft wheat market to contract in 2020/21
                                                                     28 No 9).
                                                                                                             The EU 2020/21 wheat production is estimated at 115.5 million t (-8% compared to the 5-year
                                EU wheat market (million t)                                                  average). Area hit a 13-year low and yield is -3.6% below 5-year average. Nevertheless, first
         150                                                                      50                         estimates for wheat quality are overall positive in DE and FR.
         130
         110
                                                                                  40    Trade, consumption   Biggest decrease in production is expected in FR (-7 million t compared to the 5-year average) and RO
          90                                                                      30                         (-1.5 million t). Yields declined in both countries, by 9% and 39% respectively due to abnormal dry
Production

          70
                                                                                  20                         conditions especially for winter wheat.
          50
          30                                                                      10                         Smaller FR and RO crops should be partially compensated by larger-than-usual harvests in
          10
                                                                                  0                          Mediterranean countries (ES, IT, SI) reflecting overall good conditions. In PL, a near-record output
                                                                                  -10
                                                                                                             volume is expected due to stable areas and above average yields.
               2019/20e2020/21f Exports    Imports   Food     Feed   Industrial                              Global production is forecast at a new record, boosted by bumper harvests in Russia, Canada and
                                                                       uses
                                                                                                             Australia in particular. EU exports could decrease to 24 million t (-11% year-on-year).
                Production (left)   Trade (right)      Consumption (right)
                                                                                                             EU total consumption is due to decrease to 95.3 million t, mainly linked to smaller consumption in the
                 5-year average             2019/20e             2020/21f
                                                                                                             feed industry (reaching 39.5 million t, -2.5% year-on-year).
  Source: DG Agriculture and Rural Development.
                                                                                                                                                                                                                     9
EU maize and other coarse grains 2020/21 production
                                                                                                                         Significant drop in EU maize production
                                     EU maize market (million t)                                                       The EU 2020/21 total maize production is estimated at 63.1 million t (-9.8% compared to last year’s
              80                                                                            80
                                                                                                                       record volume, -3.7% compared to the 5-year average). With a stable harvesting area, the drop in
                                                                                                                       production results from significantly lower yields across the EU (-7.7%/5-year average).

                                                                                                  Trade, consumption
              60                                                                            60
                                                                                                                       In 2020/21, production in FR should increase by 10.5% and reach 14.4 million t. In RO, production is
 Production

              40                                                                            40
                                                                                                                       estimated at 10.2 million t (-41% year-on-year) due to a dramatic fall in yields due to extremely dry
              20                                                                            20                         conditions in the eastern part of the country. HU, IT and ES, on the contrary, are expected to achieve
               0                                                                            0                          bigger harvests thanks to good growing conditions resulting in above-average yields.
                                                                                            -20
                                                                                                                       According to the latest estimates, global maize production could break a new record. Global
                   2019/20e 2020/21f     Exports   Imports   Food      Feed    Industrial                              consumption should increase after a stabilization in 2019/20 and global trade remains dynamic,
                                                                                 uses
                                                                                                                       supported by demand for feed use and ample supplies from the US, Brazil and Ukraine. EU imports
                     Production (left)     Trade (right)        Consumption (right)
                                                                                                                       could reach 20 million t to compensate for the lower production.
                    5-year average                 2019/20e              2020/21f
                                                                                                                       Overall, total EU consumption may drop to 82.7 million t due to lower demand for feed use. EU
Source: DG Agriculture and Rural Development.                                                                          maize imports are however likely to increase in 2020/21.
                                     EU barley market (million t)                                                        Good market prospects for barley and other cereals
              60                                                                            60
              50                                                                            50    Trade, consumption
                                                                                                                       EU 2020/21 barley production should remain stable at 55.0 million t (+4.3%/5-year average) with
              40                                                                            40                         major differences between winter (-12.5% year-on-year) and spring barley (+13.9% year-on-year).
 Production

              30                                                                            30                         EU barley consumption would benefit from a slight growth in industrial and in feed uses and increase
              20                                                                            20                         year-on-year. Malting barley consumption dropped significantly in 2019/20 and is assumed to
              10                                                                            10                         rebound. With ample availabilities worldwide, EU export prospects remain stable year-on-year and EU
              0                                                                             0                          stocks-to-use levels should increase.
                                                                                            -10                        Total production of other cereals (including rye, sorghum, oats and triticale) would reach 33.4 million t
                   2019/20e 2020/21f     Exports   Imports   Food      Feed    Industrial
                                                                                 uses                                  (+8.8% year-on-year). The production in PL, the largest EU producing country, should increase
                     Production (left)     Trade (right)        Consumption (right)                                    significantly (+29% year-on-year), especially for spring cereals.
                    5-year average                 2019/20e              2020/21f                                      Total consumption of other cereals in the EU is expected to increase due to the rise in production;
                                                                                                                       feed use would consequently increase by 1.2 million t and reach 20.7 million t.
Source: DG Agriculture and Rural Development.
                                                                                                                                                                                                                             10
EU oilseed and protein crop 2020/21 production
Limited EU oilseed prospects while a rebound in protein crop production and consumption
EU rapeseed Imported EU sunflower Imported EU soya beans
Imported
2020/21
seeds beans
seeds (million t) 20 (million t) 50
30
40 5-year average
15
20 30
Oil 10 Oil
Oil Production 20 Production
10 Production consumption 5 consumption 10
consumption
0 0
0
Meals Imported Meals Imported
Meals Imported consumption meals (seed consumption meals (bean
consumption meals (seed (seed eq) eq) Source: DG Agriculture and
(bean eq) eq)
(seed eq) eq.) Rural Development.
EU total oilseed production in 2020/21 is estimated at 28.4 million t (+0.9% year-on-year). This is partly due to EU 2020/21 protein crops production is expected to
a 2.7% increase in rapeseed production. reach 4.5 million t (+10.3% year-on-year). EU
Although still low in historical terms (14.8% below the 5-year average), the total EU rapeseed production production of field peas (2.2 million t) and broad beans
benefits from a combination of higher areas and yields, reaching 15.8 million t. DE and PL production increased (1.2 million t) should increase thanks to a rebound in
due to higher than average yields while FR production dropped due to dry conditions (-30%/5-year average). areas, combined with average yields.
With 2.8 million t (+3.4% year-on-year), EU soya production should be close to the record of 2018, benefiting Areas for other dry pulses and protein crops (including
from an increase in areas (+2.9% year-on-year) and in yields. EU sunflower production should decrease to lentils and chickpeas) are estimated to be 3.1% lower
9.8 million t (-2.5% year-on-year) despite a 1.6% year-on-year increase in areas, but yields are negatively than last year. It is mainly due to a second year of
impacted by dry conditions in major producing areas (RO, BG). declines in areas in ES (-12% in 2019/20 and -14% in
Crushing volumes are expected to decline by 2.5% year-on-year and reach 44.7 million t. Lower meal production 2020/21).
could be compensated by a slight rebound of imports to sustain the demand. After two years of consecutive decreases in protein
Global soya production is forecast to reach a new record (370 million t according to the USDA), with a rebound of crops consumption for feed, both an increase in feed
US production and a continuous increase in Brazil and Argentina. Tied to the Chinese feeding industry demand, rations due to a lower availability of cereals and an
trade should expand globally. increase in food demand would support a rebound
Total EU oilseed imports of 52.5 million t (equivalent seeds and beans) would correspond to a 1.3% decline of total EU consumption by 5.1%.
year-on-year, still 2.7% above the 5-year average. 11Sugar
EU+UK exports at their lowest level since 2010/11
World and EU+UK sugar price (EUR/t) The 2019/20 marketing year is coming to an end. EU+UK production is estimated at
600
17.4 million t, 230 000 ton less than in 2018/19 (-3% below 5-year average).
500
The EU+UK price increased over the first part of the marketing year and stabilised over the last
400 months at around EUR 380/t. On the contrary, world sugar prices decreased again in July, and the
300 gap between EU and world prices increased to between EUR 50/t and EUR 70/t since March.
200 With lower EU+UK production, lower global demand and bearish world prices, exports remained
100 low and are forecast at 0.8 million t, the lowest level since 2010/11. Imports could reach
0 1.85 million t, slightly below the previous year (-3%).
2019/20 total domestic uses of sugar are forecast to decline by almost 0.5 million t (-2.5%
year-on-year).
EU+UK white sugar price World white sugar price World raw sugar price Resulting EU+UK stocks are estimated at 2.2 million t (22% above 2018/19 stocks).
Source: DG Agriculture and Rural Development, based on MS notifications. Mediocre 2020/21 sugar beet yield due to rain deficit and diseases
EU sugar area and yield Rain deficit in western Europe and pressure from diseases (yellowing) result in a yield forecast
1 800 100
for the 2020/21 EU crop slightly below the 5-year average, at 73 t/ha. With the EU sugar beet
1 350 75 area estimated at 1.5 million ha, EU sugar beet production could reach 109 million t (-3% year-
on-year).
1 000 ha
t/ha
900 50
Considering average sugar content, EU sugar production is forecast at 15.9 million t for 2020/21,
450 25
compared to 16.2 million t in 2019/20.
While 2019/20 consumption dropped in the context of Covid-19 confinement measures, EU
0 0 human consumption is expected to recover in 2020/21, close to the 2018/19 level.
2020/21 imports are forecast to be similar to the previous year while EU exports could slightly
increase and reach 1.2 million t.
Area Yield
Source: DG Agriculture and Rural Development, based on Eurostat.
12OLIVE OIL 2018/2019 2019/2020
Production +3.4% -15%
Exports +14% -8.3%
Imports -19% -4.8%
Market developments in the EU
Consumption -5.8% +5.2%
SPECIALISED OLIVE OIL
Production
2019/2020
-15%
2020/2021
+16.6%
CROPS Exports
Imports
+16%
+63%
-3.7%
-58%
© ValentinVolkov iStock
Consumption +3.2% +3.5%
APPLES 2019/2020 2020/2021
fresh p rocessed fresh p rocessed
Production +15.1% -45% -3.3% +6.3%
Exports -17.1% -33% +7.9% -7.1%
Imports +4.5% +5.5% +3.4% -1.8%
Consumption +36% -38% -7.8% +8.6%
ORANGES 2019/2020 2020/2021
© Rachid Oucharia_unsplash
fresh p rocessed fresh p rocessed
Production +0.1% -22% +2.1% +20%
Exports -15% -1.2% +9.6% -0.6%
Imports +13% -2.1% -6.6% -1.2%
Consumption +3.5% -9.3% +0.1% +5.0% •Note: % compared to previous season
© Jen Theodore_unsplash 13Olive oil
New record volumes of EU exports in 2019/20 campaign
2019/20 EU olive oil exports volume change, by month In Oct-July, EU exports grew significantly in volume, reaching new records in all main export
and destination (1 000 t) destinations. Shipments to the US grew by +16%, Brazil +32%, Japan +3%, UK* +32%, China +3%.
30 They are accounting for around 70% of EU exports. However, the value of EU exports is not growing
proportionally. It dropped by 3% in the US and around 10% in China and Japan. Although some
20 slowdown of export growth is likely to occur at the end of the campaign due to high volumes
exported in the same period in 2019/20 campaign, EU exports could reach a record 820 000 t.
10
EU imports, close to 90% originating in Tunisia, continued to grow and could reach a historic level in
0 2019/20 (240 000 t), comparable to the one in 2014/15. These increasing flows are driven by both
EU processing and re-exporting needs, which helps to sustain business relations in certain export
-10 destinations where some EU exports are restricted due to retaliation tariffs (US).
Oct Nov Dec Jan Feb Mar Apr May June July
In the EU, an increased production in IT and EL, a record harvest in PT, and strong consumption by
US Brazil UK* Japan China Canada Australia other
households in main producing countries due to the lockdown, supported a consumption growth. It is
Note: *UK July figures are not yet complete expected to be +3% despite the reduced demand from the tourism and foodservice industries.
Source: DG Agriculture and Rural Development, based on Eurostat.
Together with an anticipated export growth, it should contribute to a stock reduction by 20%.
EU olive oil production, consumption, trade and ending
stocks (1 000 t) Stable EU stocks in 2020/21
3 000
Over the summer, weather conditions in the Iberian Peninsula deteriorated for olive growers, with
2 000
some very warm and dry episodes, resulting in lower 2020/21 production estimates in ES
(1 550 000 t) and PT (100 000 t). EL and IT are expected to follow a bi-annual pattern of
1 000 production alternance, EL likely to produce 280 000 t, IT around 290 000 t. As a result, 2020/21 EU
olive oil production could be around 2.2 million t (+17% year-on-year).
0 Lower EU exports are forecast for 2020/21 (790 000 t), due to existing stocks in some destination
countries following the record flows as well as a weakened purchasing power worldwide. EU imports
could also decrease due to lower availabilities in non-EU countries and less re-exports need.
Ending stocks Production Exports Imports Consumption Further EU consumption growth is expected (3.5%) constrained by a low production in IT and EL
whose consumers have a strong preference for national olive oils; and only a
Source: DG Agriculture and Rural Development, based on MS notifications and Eurostat.
slow tourism and foodservice recovery. This may still contribute stable stocks. 14Apples
EU apple production below average and low stocks Strong domestic demand keeps apple exports low
EU apple production and per capita consumption EU fresh apple exports by destination (1 000 t)
15 000 18 2 000
12 500 15 1 600
kg per capita
10 000 12
1 200
1 000 t
7 500 9
800
5 000 6
400
2 500 3
0 0 0
EU production (fresh) EU production (processed) Losses and feed use
per capita (fresh/kg) per capita (processed/kg) UK Egypt Belarus Kazakhstan Saudi Arabia India other
Source: DG Agriculture and Rural Development, based on Eurostat. Source: DG Agriculture and Rural Development, based on Eurostat.
The EU production of apples is forecast to reach 11.5 million t in marketing EU exports of fresh apples are expected to increase by 8% compared to
year 2020/21, 2% below its past 5-year average. Production in PL is expected 2019/20 when exports dropped sharply as a result of both
to recover from last years’ low production (+17%), partly driven by an increase high domestic prices and restrictions on the export market. They would,
in area (+10 000 ha), whereas production declines in FR (-13%), IT (-1%) and however, remain below average (-10%).
DE (-4%). With the stock from the 2019/20 campaign almost cleared, the Around 30% of the EU usable apple production in 2020/21 (3.4 million t)
market seems well balanced. would be used for processing (+6% year-on-year). With stocks below average,
The EU consumption of fresh apples is due to decline to 14.7 kg per capita. exports of processed apples could decline by 7% whereas imports are due to
This is 8% below the 2019/20 level, when consumption reached record high remain stable. This would result in an apparent consumption
levels driven by home consumption. above last year’s one (+9%). 15Oranges
Record high imports of fresh oranges in 2019/20
EU oranges consumption (kg per capita) The 2019/20 EU orange production is estimated to be slightly above 6.2 million t. This is 5% less
20 than in the previous year and results from lower yields. 1.1 million t of oranges produced in the EU
16 would be directed towards processing in 2019/20 (-22% below the previous year).
12 Lower EU production, high production in South Africa and a strong EU demand for fresh oranges
triggered a significant increase in imports of fresh oranges, forecast at close to 1 million t (+13%).
8
Exports of fresh oranges on the contrary are estimated to have dropped by 15%. Both imports and
4 exports of processed oranges (mainly juice and juice concentrates) should be slightly lower in
0 2019/20, by respectively 2% and 1%.
Notwithstanding previous years’ stocks, the overall apparent consumption of oranges indicate a
decline in consumption (-2%). However, the consumption of fresh oranges could increase by 3% to
processed fresh
12.8 kg per capita at the detriment of processed, following also a long-term trend of substituting
processed orange juice by fresh, but more pronounced this year.
Source: DG Agriculture and Rural Development.
High EU production forecast for 2020/21
EU oranges production and area
7 000 300 For 2020/21, a stable EU production area is forecast at 273 000 ha. Yields could be above
6 000 280 average as weather conditions were favourable to flowering. This results in a forecast EU
5 000 260
production at 6.55 million t for 2020/21 (+5% year-on-year), close to the high production level in
2018/19. Production directed to processing could reach 1.3 million t, a 200 000 t or 20% increase
1 000 t
1 000 ha
4 000 240
compared to 2019/20.
3 000 220
EU imports of both processed and fresh oranges are forecast to decrease in 2020/21 due to
2 000 200 higher EU production. While exports of fresh oranges could recover from the drop in 2019/20,
1 000 180 exports of processed oranges could further decline along the long-term decreasing trend.
0 160 Apparent consumption of processed oranges is forecast to grow with increased domestic
2015/16 2016/17 2017/18 2018/19 2019/20e 2020/21f processing, while consumption of fresh would remain close to 2019/20 levels.
Production (fresh) Production (processed) Area
Source: DG Agriculture and Rural Development, based on Eurostat.
16Market developments in the EU
MILK AND MILK
Milk collection
2020
+1.4%
2021
+0.8%
CHEESE
Production
2020
+0.7%
2021
+0.5%
DAIRY Dairy herd
Milk yield
-0.4%
+1.6%
-0.8%
+1.6%
Exports
Imports
+5.0%
+2.0%
+3.0%
+0.5%
PRODUCTS BUTTER 2019 2020
Consumption
SMP
-0.2%
2020
+0.5%
2021
Production +2.5% +1.0% Production +5.0% +3.0%
Exports +10% +5.0% Exports -10% +5.0%
Imports -15% +0.0% Imports -5.0% +0.0%
Consumption +0.2% +0.4% Consumption -6.9% +0.5%
FRESH DAIRY
2020 2021 WMP 2020 2021
PRODUCTS
Production +0.9% -0.2% Production +0.7% -0.5%
Exports +8.0% +5.0% Exports +0.0% -2.0%
Imports -5.0% +0.0% Imports -10% +0.0%
© SilviaJansen iStock
Consumption +0.4% -0.4% Consumption +0.2% +0.6%
•Note: % compared to previous season
17Milk
EU monthly milk collection EU milk production growing despite mixed weather conditions
(1 000 t) Over the summer, a lack of rainfall and above-average temperatures hampered the pasture
13 500 development in northern DE, western PL, north-eastern FR, and the Benelux countries. Summer
13 000 weather conditions were more favourable in Central Europe as well as in the Iberian Peninsula.
12 500
This could impact negatively upon feed availability (hay and silage) in the coming months,
12 000 contributing to a slowdown of the milk production growth towards the end of the year. Q3 2020
11 500 production growth is still likely to remain positive (1%) thanks to a strong collection growth until
11 000 July (+2%). Q4 2020 production is due to be around the same level as last year.
10 500
The overall EU milk collection growth should be around 1.4% in 2020, driven by an increase in milk
10 000
yield (+1.6%) supported by generally favourable pasture conditions until July as well as affordable
feed. At the same time, the dairy herd is expected to decline further (-0.4%), with increased
2017 2018 slaughtering in the second half of the year.
2019 Jan-July 2020
Source: Joint Research Centre (JRC MARS
Aug-Dec 2020e
Source: DG Agriculture and Rural Development, based
World production increasing while EU prices remain overall stable
Bulletin Vol. 28 No 9). on MS notifications and Eurostat. Dairy production is increasing in the other main producing regions in the world despite a significant
Monthly change in milk production in selected countries demand shock, as well as transport and production restrictions caused by Covid-19. In Jan-June,
1 400 7% the US production grew at a similar rate as in the EU, Australia recovered from last-year’s low
By region (million litres)
1 200 6%
1 000 5%
(+5%) and the weather conditions favoured a significant production increase in Argentina (+9%).
800 4% New Zealand’s new season is likely to benefit from the good weather conditions so far.
600 3% Despite increasing global milk supply, EU prices remain relatively stable. EU SMP price have been
Total
400 2%
200 1% close to EUR 2150/t since June. The increasing trend of the EU butter price has been sustained
0 0% since mid-May, reaching around EUR 3400/t at the beginning of September. Cheese prices and
-200 -1% WMP price have been stable (around EUR 3000/t for cheddar and gouda, EUR 2700/t for WMP).
-400 -2%
1 3 5 7 9 11 1 3 5 7 9 11 1 3 5 Recovery in EU butter price and stable SMP price reverted the decline in EU milk price equivalent
2018 2019 2020 caused by the Covid-19 outbreak. The EU milk price equivalent reached close to EUR 31/100 kg in
EU US New Zealand Australia Argentina Total August (2% below last year).
The seasonal increase of EU milk price is likely to remain below last
Source: DG Agriculture and Rural Development, based on AHDB.
year’s level due to supply growth stronger than the fragile demand recovery. 18Milk and Dairy products
More milk in 2021 and reinforced demand for local sales
Trends of EU milk production channels (2016=100) Higher than expected EU milk deliveries are likely to increase the availability of milk solids. Until
110 July, milk fat grew by 1.8% year-on-year and milk protein by 1.6%. DE, FR, IE, NL and PL
105
accounted for around 70% of the milk fat growth, with IE recording the strongest growth (+5%)
thanks to its grass quality. These EU countries represented 80% of the milk solid growth (IE +4%).
100
In 2021, assuming normal weather conditions, EU milk production could grow at a modest rate
95 (+0.8%), driven by yield growth (1.6%) and further dairy herd reduction (-0.8%). The pace of
90 production remains uncertain, but the high growth rates of 2020 would be hard to sustain in case
of a slow demand recovery.
85
It is expected that the Covid-19 outbreak will lead to a further growth of direct sales in response
80
to reinforced consumer demand for local food and short supply chains. This trend is to continue in
2016 2017 2018 2019 2020e 2021f
2021 as well.
Deliveries Feed use Farm use Direct sales
Source: DG Agriculture and Rural Development, based on Eurostat and MS notifications.
Drinking milk benefitting from increasing milk production
Consumer demand continues supporting the production growth of drinking milk since the
Annual change in EU production of selected dairy beginning of the year (around +4% compared to Jan-July last year). The structural decline should
products (1000 t of milk eq.) stop, with a 1.5% increase in 2020. In Jan-June, EU exports increased by 3%, mainly driven by
2 500 China (+17%), the main EU export market. This trend should be reinforced towards the end of the
2 000
1 500 year, leading to an overall increase of Fresh Dairy Products (FDP) exports in 2020 (+8%).
1 000 Contrarily, cream and yoghurt production are likely to decline by 0.5% in 2020. This is due to a
500
0 competition for milk fat use and a reduced use in domestic food service not fully compensated by
-500 retail sales and growing exports. In Jan-June, cream shipments to China (36% of the EU exports of
-1 000
-1 500
cream) grew by 40% and yoghurt shipments to the UK (65% of the EU exports of yogurt) by 7%.
2019/2018 2020e/2019 2021f/2020e In 2021, stockpiling behaviour experienced during the first lockdown periods is less likely to be
Cheese Butter SMP observed, the food chain having proved to be resilient and consumers being better acquainted
WMP Whey powders Liquid milk
other FDP other dairy products with Covid-19 restrictions. As a result, consumption would revert to a declining trend (-0.4%),
leading to a reduction in production. Exports are likely to grow further (5%),
Source: DG Agriculture and Rural Development, based on Eurostat. driven by a positive image of EU FDP.
19Dairy products
Export demand sustaining EU production of milk powders
Jan-June EU exports of SMP and WMP by selected Competitive EU prices of SMP, WMP and butter continue supporting EU exports. EU SMP exports are
regions (1000 t) expected to reach a historically second highest level (850 000 t) while domestic processing should
180 get back to 2017 levels. This will lead to a production increase of 5% in 2020, followed by a 3%
150 growth in 2021, driven by an increasing export demand and affordable price.
120
In Jan-June, EU WMP exports kept on growing (+12%), mainly to Africa (+53%), while exports to
90
the Near and Middle East, the largest EU export markets, declined by 1%. Despite an increasing
60
competition from New Zealand in the coming months, competitive EU prices should allow EU
30
exports to remain stable. With an expected stable EU demand (+0.2%), almost 1% more WMP is to
0
be produced in 2020. In 2021, availabilities worldwide and an increasing substitution of WMP by
China ASEAN North Africa Other AfricaNear and Other
Middle East other milk powders are likely to reduce EU exports (-2%), resulting in a production decline (-0.5%).
SMP Jan-June 2020 WMP Jan-June 2020 Despite an increasing EU butter price, EU exports are growing and are likely to reach a record high
SMP Jan-June 2019 WMP Jan-June 2019
in 2020 (320 000 t). Losses in foodservice are likely to be compensated by retail sales, stabilizing
Note: List of countries belonging to regions are in Statistical Annex.
domestic consumption. In 2021, further adjustments in foodservice and retail channels (e.g. more
Source: DG Agriculture and Rural Development, based on Eurostat.
restaurant providing takeaways, e-commerce) could increase EU consumption (+0.4%) and EU
EU cheese production, domestic use, trade and ending exports are likely to remain competitive. This should support production growth (+1%).
stocks (1000 t)
12 000 3 000 EU cheese exports to grow also in 2021
Production, domestic use
10 000 2 500 Trade, ending stocks
The EU consumption of cheese continues being impacted upon negatively by foodservice closures,
8 000 2 000
which could result in an overall decline in 2020 (-0.2%). Global demand for EU cheeses remains
6 000 1 500
positive, with increasing shipments to Japan, Switzerland, South Korea and Ukraine more than
4 000 1 000
compensating for the losses in the US market. EU exports are expected to grow by 5%, supported
2 000 500 by a production increase of 0.7%. In 2021, adjustments in foodservice and retail channels should
0 0 help EU cheese consumption to grow by 0.5%. Combined with increasing EU exports, production
should grow by 0.5%.
Stocks Domestic use Production Imports Exports
With cheese production growing, more whey is due to be produced in 2020 (+3%) to satisfy an
increasing EU demand for dairy proteins (+0.9%) and a recovered import
Source: DG Agriculture and Rural Development, based on Eurostat. demand in China. This should lead to higher EU exports (+5%).
20Market developments in the EU
MEAT BEEF 2020 2021 POULTRY 2020 2021
PRODUCTS
Production -1.4% -1.5% Production +1.0% +1.0%
Exports +1.0% -4.0% Exports -6.0% +1.0%
Imports -10% +0.0% Imports -12% +6.0%
Consumption -2.1% -1.2% Consumption +1.5% +1.3%
SHEEP &
PIGMEAT 2020 2021 2020 2021
GOAT
Production -0.5% -1.0% Production -3.0% -1.0%
Exports +2.0% -10% Exports +6.0% +0.0%
Consumption -1.1% +1.0% Imports -4.0% -3.0%
Consumption -4.0% -1.6%
•Note: % compared to previous year
©olgakr iStock
•Net production and meat trade
21Beef and veal
EU beef production stabilises in the second half of 2020
Monthly EU beef slaughtering The EU beef production decreased in the first half of 2020: -2.4% year-on-year. In April-May,
(1 000 t carcass weight) slaughtering numbers in most countries stagnated (FR, NL, DE) or declined (IE, AT, ES, and
700
significantly in IT), because of Covid-19 measures and a lower demand from foodservice. With
600
the reopening of restaurants and tourism catching up, demand has been recovering. Prices,
500 which bottomed mid-May, are back to levels seen a year ago.
400
The estimated decline in beef production in 2020 (-1.4%) assumes a stable production in the
300
second half of the year. In addition to the Covid-19 impact, the decline in 2020 can also be
200
attributed to the adverse effects of a dry spring on grazing and fodder availability, which led to
100
early slaughtering at lower carcass weights. Reductions in herd size in some countries (FR, DE
0
Jan Feb Mar Apr May June July Aug Sept Oct Nov Dec
and IE), as confirmed by the May-June livestock survey, may also translate into a further decline
2018 2019 2020 2020f (assuming annual -1.4%)
in EU production in 2021 (-1.5%).
Source: DG Agriculture and Rural Development, based on Eurostat. Stable exports, while lower imports limit meat availability
EU beef trade (Jan-June, 1 000 t carcass weight) Beef exports declined slightly in the first half of the year (-1% year-on-year). While shipments
0 20 40140160 0 20 40 0 20 40 60 80 to the UK were down 9%, exports to other destinations increased by around 12% in total,
UK Lebanon UK benefiting IE, DK, IT, FR and DE strongly. Overall, export growth is expected at +1% in 2020 but
Bosnia & Herzeg. Algeria Brazil
Philippines Israel Argentina may turn negative in 2021 (-4%), given limited domestic availability. Live exports declined to all
Switzerland Libya Uruguay main destinations (except Morocco), with a -5% forecast for the whole of 2020.
Hong Kong Morocco US
Israel Saudi Arabia Australia Imports plummeted in the first half of the year (-22% year-on-year), due to the drop in demand
Canada Turkey New Zealand
China UK Paraguay in the EU during restaurant closure, and tight supplies in all key exporters. The UK and Brazil
Ghana other other redirected their shipments to China and other destinations. More favourable conditions in the
Algeria
Japan rest of the year could limit the drop in annual EU imports to 10% only in 2020 followed by
other Upper bars: 2019 Lower bars: 2020 stable imports in 2021.
Exports: Beef Exports: Live animals Imports: Beef The apparent consumption of beef is projected to decline to 10.4 kg per capita in 2020 (-2.1%).
Source: DG Agriculture and Rural Development, based on Eurostat.
22Pigmeat
EU pigmeat production will grow less than expected in 2020
Year-on-year change in pigmeat production
EU pigmeat production was down in the first half of 2020 (-0.9% year-on-year), with declines in
(Jan-June 2020/2019)
150 10% DE, FR, IT, NL and PL offsetting increases in ES and DK.
6% Favourable prices, a return of consumer demand and benefits from recent investments are
1 000 t carcass weight
100 4%
5% expected to have contributed to the increase in production in Q3. However, the discovery of ASF
50
0.3%
in wild boars in the Eastern border of DE in mid-September and resulting bans will affect
0 0%
-0.2%
German exports and the EU market in Q4. Prices, which had stabilised since the beginning of the
-50 -1% -1% -1%
-2%
-5%
summer, are under pressure. Any production growth in Q4 should come only from ES, DK and IE,
-100 -18% which expanded their herds, including breeding sows in 2019, as confirmed in the May-June
-6%
-150 -10% livestock survey.
EU DE ES FR PL DK NL IT BE other Overall, the production of pigmeat is set to decline in 2020 (-0.5%) and 2021 (-1%). The
Q1 (lhs) Q2 (lhs) % growth (Jan-June 2020/2019) apparent consumption of pigmeat is projected to decline to 32.8 kg per capita in 2020 (-1.1%).
Source: DG Agriculture and Rural Development, based on Eurostat. Lower exports due to ASF
Quarterly pigmeat (meat + offal) export Exports of meat (without offal) were up by more than 15% in the first half of the year, doubling
(1 000 t carcass weight) other non-EU to China and increasing to Vietnam. The ASF cases in wild boars in DE resulted in immediate
Japan
400 trade restrictions of exports from DE to key partners: China, South Korea and Japan. As a
China
300
consequence, the projection for 2020 is revised downwards to +2% year-on-year.
UK
Export growth (set to -10% in 2021) would not have continued even without an ASF outbreak in
200 DE. While the EU could still manage to reinforce exports to key destinations (the Philippines, the
100 US), the unprecedented exports to China in 2020 would not have increased further, as China
may start to recover its own production and continue to diversify consumption of (imported)
0
meat.
Q1Q2Q3Q4Q1Q2 Q1Q2Q3Q4Q1Q2 Q1Q2Q3Q4Q1Q2 Q1Q2Q3Q4Q1Q2
The evolution of EU exports will depend on the capacity of DE to contain the disease and the
2019 2020 2019 2020 2019 2020 2019 2020
willingness of trade partners to implement the regionalisation principle, allowing imports from
DE ES DK NL
areas free from ASF. DK, ES and NL may fill gaps partially in supply to China
Source: DG Agriculture and Rural Development, based on Eurostat. and Asian markets.
23Poultry
EU poultry production to increase moderately over 2020 and 2021
Year-on-year change in poultry production
(Jan-June 2020/2019) EU poultry production grew in the first half of the year (+1.5% year-on-year), with production still
75 15% expanding in many important producing countries (IT, PL, ES, DE) even in Q2. Higher production
was supported by prior investments in PL and the shift in demand from other meats to poultry
1 000 t carcass weight
10%
50 10%
during lockdown. Supported by gradual reopening of foodservices and strong demand at retail, EU
prices rapidly closed the gap with the historic average but remain under pressure.
25 3% 2% 5%
1.5% 2% The expected increase in poultry production in 2020 (+1%) assumes only a small growth in the
0.2%
0 0% second half of the year, as production accumulated during the foodservice closure period is due to
-0.6% find its way back to the market in Q4. Similarly, a modest growth is forecast for 2021 (+1%). The
-1% -2%
-25 -5% drop in production of the other poultry meats than chicken (ducks, guinea fowls, pigeons or quails),
-4%
EU PL ES FR DE IT NL BE HU other will continue until the end of 2020.
Q1 (lhs) Q2 (lhs) % -growth (Jan-June 2020/2019)
Source: DG Agriculture and Rural Development, based on Eurostat.. Lower imports and exports
EU poultry trade (Jan-June, 1 000 t carcass weight)
800
Poultry exports declined sharply in the first half of the year (-8.5% year-on-year), including a drop
UK UK
of 12% to the UK, and of 5% to other destinations, except for the Philippines (+20%). With
Philippines Brazil
600 prospects of Avian Influenza-related bans on PL exports progressively lifted, EU exports will
Ghana Thailand
recover only gradually, declining still by 6% in 2020, and turning moderately positive in 2021
Ukraine Ukraine
400 (+1%).
Hong Kong other
Imports were down in the first half of the year (-15% year-on-year), due to lower demand for
200 South Africa
poultry meat from foodservice, the main client for imported poultry, while the key suppliers
Saudi Arabia
0 including Brazil, continue to redirect shipments to China. Imports are expected to fall by 12% in
Benin
2020 and recover in 2021 (+6%).
other
The apparent consumption should increase in 2020 up to 23.7 kg per capita (+1.5%).
Export Import
Source: DG Agriculture and Rural Development, based on Eurostat.
24Sheep and goat meat
Sheep and goat meat production down in 2020
Monthly EU sheep and goat meat slaughtering
(1 000 t carcass weight) EU sheep and goat meat production declined significantly in the first half of 2020 (-4% year-on-
140
year). Slaughtering of goats and sheep dropped in all key producers (EL, IE, FR, IT, RO, ES),
120
reflecting lower demand from foodservice and home consumption during festive periods, and
100
supply shortages. Only IE slaughtered more sheep thanks to expanding herds in 2019, to fulfil the
80
demand from EU and non-EU partners (other than the UK).
60 The expected decline in sheep and goat meat production in 2020 (-3%) and in 2021 (-1%)
40 assumes smaller herds and fewer ewes put to the ram, stagnated domestic demand, uncertainty
20 linked to trade and bad weather conditions. These contribute to the increase in prices, which have
0 returned to the level seen at the beginning of 2020.
Jan Feb Mar Apr May June July Aug Sept Oct Nov Dec
2018 2019 2020 2020f (assuming annual -3%) Lower availability due to shortages in domestic and global supply
Source: DG Agriculture and Rural Development, based on Eurostat. Sheep meat exports increased in the first half of 2020 (+13% year-on-year). Higher volumes to
key destinations compensated for a decline of exports to the UK (-10%). ES, IT and EL increased
EU sheep export (Jan-June, 1 000 t carcass weight)
their exports in Q2, while NL, RO and the IE reported reductions. The export growth is estimated to
30 UK Saudi Arabia soften to +6% in 2020, which means stagnation at EU level in the second half of the year, as
Switzerland Jordan there may not be enough supply to satisfy trade demand.
20 Oman Libya Exports of live animals increased in the first half of 2020 (+10% year-on-year), supported by
Kuwait Israel higher demand from Saudi Arabia and Jordan, and despite fewer animals being shipped to
Qatar Lebanon traditional partners Libya and Lebanon. Overall, exports of live animals are set to decline in 2020
10
United Arab Emirates other (-5%) and by in 2021 (-1.5%), as this recent high level of shipments may not be sustained.
Bahrain Imports of sheep meat are expected to fall in 2020 (-4%). Imports from the UK declined by
0 Saudi Arabia around 25% in the first half of the year, and those from New Zealand and Australia by nearly
other 20% over the same period, due to tight availability incurred by unfavourable weather conditions.
High prices should translate into more imports in the second half of 2020.
Meat Live animals
The apparent consumption should decline in 2020 (-4%), down to 1.3 kg
Source: DG Agriculture and Rural Development, based on Eurostat. per capita.
25Executive Summary
FINDING INFORMATION ABOUT THE EU
Online
Information about the European Union in all the official languages of the EU is available on the Europa website at: https://europa.eu/european-union/index_en
EU publications
You can download or order free and priced EU publications from: https://publications.europa.eu/en/publications.
Multiple copies of free publications may be obtained by contacting Europe Direct or your local information centre (see https://europa.eu/european-union/contact_en).You can also read