Investor Presentation - April 2019 - Capitol Investment Corp.
←
→
Page content transcription
If your browser does not render page correctly, please read the page content below
Investor
Presentation
April 2019
Disclaimer
THIS PRESENTATION HAS BEEN PREPARED FOR USE BY CAPITOL INVESTMENT CORP. IV (“CAPITOL”) AND NESCO HOLDINGS I, LP (“NESCO”) IN CONNECTION WITH THEIR PROPOSED BUSINESS
COMBINATION. SUCH PRESENTATION MAY BE PRESENTED TO CERTAIN OF CAPITOL’S STOCKHOLDERS, AS WELL AS OTHER PERSONS WHO MIGHT BE INTERESTED IN PURCHASING CAPITOL’S
SECURITIES, IN CONNECTION WITH THE BUSINESS COMBINATION.

CAPITOL, NESCO, THEIR AFFILIATES AND THEIR RESPECTIVE DIRECTORS AND EXECUTIVE OFFICERS, UNDER SEC RULES, MAY BE DEEMED TO BE PARTICIPANTS IN THE SOLICITATION OF PROXIES
OF CAPITOL’S STOCKHOLDERS IN CONNECTION WITH THE PROPOSED TRANSACTION. INFORMATION REGARDING THE PERSONS WHO MAY, UNDER SEC RULES, BE DEEMED PARTICIPANTS IN THE
SOLICITATION OF PROXIES TO CAPITOL’S SHAREHOLDERS IN CONNECTION WITH THE PROPOSED BUSINESS COMBINATION WILL BE SET FORTH IN THE REGISTRATION STATEMENT FOR THE
PROPOSED BUSINESS COMBINATION TO BE FILED BY CAPITOL, WHICH WILL INCLUDE A PRELIMINARY PROXY STATEMENT/PROSPECTUS OF CAPITOL THAT WILL BE USED TO SOLICIT SHAREHOLDER
APPROVAL OF THE TRANSACTION. INVESTORS AND SECURITY HOLDERS MAY ALSO OBTAIN INFORMATION REGARDING THE NAMES AND INTERESTS IN THE PROPOSED TRANSACTION OF CAPITOL’S
DIRECTORS AND OFFICERS IN CAPITOL’S FILINGS WITH THE SEC, INCLUDING CAPITOL’S ANNUAL REPORT ON FORM 10-K FOR THE FISCAL YEAR ENDED DECEMBER 31, 2018, WHICH WAS FILED WITH
THE SEC ON MARCH 4, 2019.

INVESTORS AND SECURITY HOLDERS OF CAPITOL AND NESCO ARE URGED TO READ THE PRELIMINARY PROXY STATEMENT/PROSPECTUS, AND THE DEFINITIVE PROXY STATEMENT/PROSPECTUS
AND OTHER RELEVANT DOCUMENTS THAT WILL BE FILED WITH THE SEC CAREFULLY AND IN THEIR ENTIRETY WHEN THEY BECOME AVAILABLE BECAUSE THEY WILL CONTAIN IMPORTANT
INFORMATION ABOUT THE PROPOSED TRANSACTION. INVESTORS AND SECURITY HOLDERS WILL BE ABLE TO OBTAIN FREE COPIES OF THE PROXY STATEMENT/PROSPECTUS AND OTHER
DOCUMENTS CONTAINING IMPORTANT INFORMATION ABOUT CAPITOL AND NESCO THROUGH THE WEBSITE MAINTAINED BY THE SEC AT WWW.SEC.GOV. COPIES OF THE DOCUMENTS FILED WITH
THE SEC BY CAPITOL AND/OR NESCO WHEN AND IF AVAILABLE, CAN BE OBTAINED FREE OF CHARGE ON CAPITOL’S WEBSITE AT WWW.CAPINVESTMENT.COM OR BY DIRECTING A WRITTEN REQUEST
TO CAPITOL INVESTMENT CORP. IV, 1300 17TH STREET, SUITE 820, ARLINGTON, VA 22209 OR BY EMAILING INFO@CAPINVESTMENT.COM.

SOME OF NESCO’S FINANCIAL INFORMATION AND DATA CONTAINED HEREIN DOES NOT CONFORM TO SEC REGULATION S-X IN THAT IT INCLUDES CERTAIN FINANCIAL INFORMATION NOT DERIVED IN
ACCORDANCE WITH UNITED STATES GENERALLY ACCEPTED ACCOUNTING PRINCIPLES (“GAAP”). ACCORDINGLY, SUCH INFORMATION AND DATA HAS BEEN AND WILL BE ADJUSTED AND PRESENTED
DIFFERENTLY IN CAPITOL’S PROXY STATEMENT/PROSPECTUS. CAPITOL AND NESCO BELIEVE THAT THE PRESENTATION OF NON-GAAP MEASURES PROVIDES INFORMATION THAT IS USEFUL TO
INVESTORS AS IT INDICATES THE ABILITY OF NESCO TO MEET CAPITAL EXPENDITURES AND WORKING CAPITAL REQUIREMENTS AND OTHERWISE MEET ITS OBLIGATIONS AS THEY BECOME DUE.
RECONCILIATIONS OF NON-GAAP MEASURES TO THEIR MOST DIRECTLY COMPARABLE GAAP COUNTERPARTS ARE INCLUDED IN THE APPENDIX TO THIS PRESENTATION.

THE FINANCIAL PROJECTIONS INCLUDED IN THIS PRESENTATION ARE FORWARD-LOOKING STATEMENTS THAT ARE BASED ON ASSUMPTIONS THAT ARE INHERENTLY SUBJECT TO SIGNIFICANT
UNCERTAINTIES AND CONTINGENCIES, MANY OF WHICH ARE BEYOND CAPITOL’S AND NESCO’S CONTROL. WHILE ALL PROJECTIONS ARE NECESSARILY SPECULATIVE, CAPITOL AND NESCO BELIEVE
THAT THE PROSPECTIVE FINANCIAL INFORMATION COVERING PERIODS BEYOND TWELVE MONTHS FROM ITS DATE OF PREPARATION CARRIES INCREASINGLY HIGHER LEVELS OF UNCERTAINTY AND
SHOULD BE READ IN THAT CONTEXT. THERE WILL BE DIFFERENCES BETWEEN ACTUAL AND PROJECTED RESULTS, AND ACTUAL RESULTS MAY BE MATERIALLY GREATER OR MATERIALLY LESS
THAN THOSE CONTAINED IN THE PROJECTIONS. THE INCLUSION OF PROJECTIONS IN THIS PRESENTATION SHOULD NOT BE REGARDED AS AN INDICATION THAT CAPITOL AND NESCO, OR THEIR
REPRESENTATIVES, CONSIDERED OR CONSIDER THE PROJECTIONS TO BE A RELIABLE PREDICTION OF FUTURE EVENTS.

NEITHER CAPITOL NOR NESCO UNDERTAKE ANY OBLIGATION TO UPDATE OR REVISE ANY FORWARD-LOOKING STATEMENTS, WHETHER AS A RESULT OF NEW INFORMATION, FUTURE EVENTS OR
OTHERWISE, EXCEPT AS REQUIRED BY LAW. IMPORTANT FACTORS, AMONG OTHERS, THAT MAY AFFECT ACTUAL RESULTS INCLUDE NESCO’S ABILITY TO EXECUTE ON ITS BUSINESS PLAN AND
NESCO’S ESTIMATES OF EXPENSES AND FUTURE REVENUES AND PROFITABILITY. OTHER FACTORS INCLUDE THE POSSIBILITY THAT THE PROPOSED TRANSACTION DOES NOT CLOSE, INCLUDING
DUE TO THE FAILURE TO RECEIVE REQUIRED SECURITY HOLDER APPROVALS, OR THE FAILURE OF OTHER CLOSING CONDITIONS.

NEITHER CAPITOL NOR NESCO MAKES ANY REPRESENTATION OR WARRANTY AS TO THE ACCURACY OR COMPLETENESS OF THE INFORMATION CONTAINED IN THIS PRESENTATION. THIS
PRESENTATION IS NOT INTENDED TO BE ALL-INCLUSIVE OR TO CONTAIN ALL THE INFORMATION THAT A PERSON MAY DESIRE IN CONSIDERING AN INVESTMENT IN CAPITOL AND IS NOT INTENDED TO
FORM THE BASIS OF ANY INVESTMENT DECISION IN CAPITOL.

THIS PRESENTATION SHALL NEITHER CONSTITUTE AN OFFER TO SELL OR THE SOLICITATION OF AN OFFER TO BUY ANY SECURITIES, NOR SHALL THERE BE ANY SALE OF SECURITIES IN ANY
JURISDICTION IN WHICH THE OFFER, SOLICITATION OR SALE WOULD BE UNLAWFUL PRIOR TO THE REGISTRATION OR QUALIFICATION UNDER THE SECURITIES LAWS OF ANY SUCH JURISDICTION.

                                                                                                                                                                             1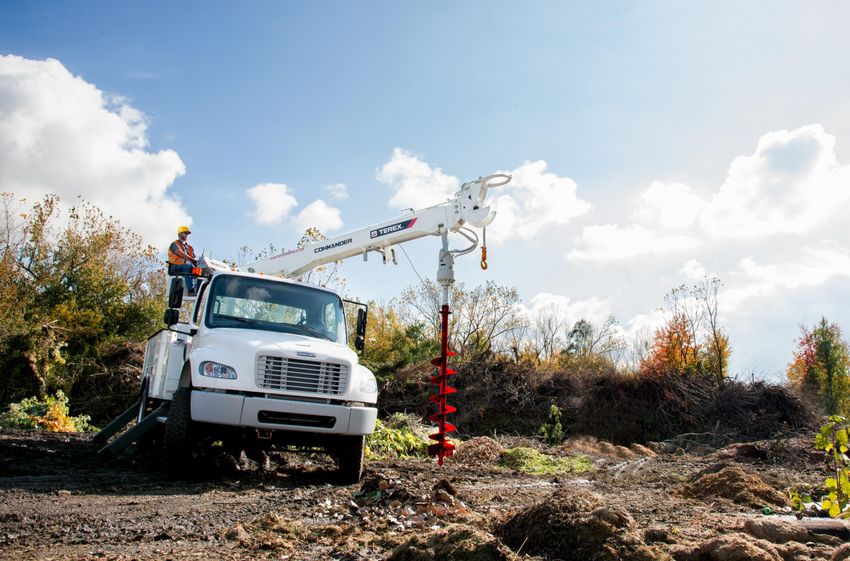
Presenters

    Lee Jacobson              Mark D. Ein
    Chief Executive Officer   Chairman & Chief Executive Officer

    Bruce Heinemann           L. Dyson Dryden
    Chief Financial Officer   President & Chief Financial Officer

                                                                    2
Agenda

    1. Capitol Investment Thesis

    2. Company Overview

    3. Industry Trends

    4. Growth Strategy

    5. Financial Overview

    6. Business Combination

    7. Appendix

                                   3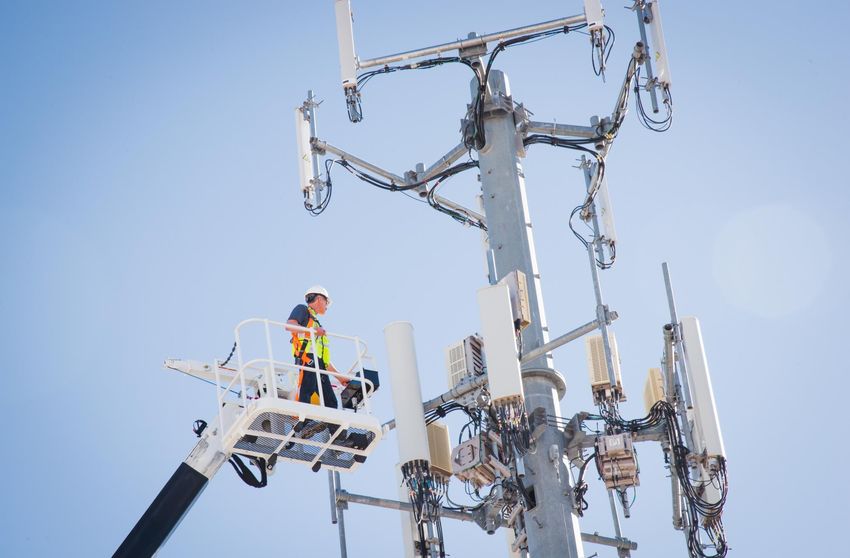
Capitol’s Value-Creation Track Record

Capitol has the best track record of all SPAC sponsors(1)

Capitol’s three prior deals are all in the top 10 best performing SPACs out of over 130 raised since 2009 (2)

Capitol’s returns have consistently beat the broader market with an average annualized return of 17%

Capitol sets itself apart by scouring the world for outstanding investments and actively engaging with the
companies post-merger, working very closely with the management teams to execute their plans and drive
value for investors

                                       Capitol has identified Nesco as another outstanding opportunity to
                                         bring its deeply engaged value creation and company building
                                       expertise, network of relationships, and strategic support to drive
                                          growth and substantial long-term shareholder value creation

Note: SPAC ranking data as of April 5, 2019. Comparison data only includes SPACs that raised ≥$100 million and is based on IPO investor returns.
(1) Based on SPAC sponsors that have completed more than one deal since October 2009 in terms of total returns since business combination.
(2) SPAC ranking data based on SPACs since October 2009 in terms of total returns since business combination.                                      4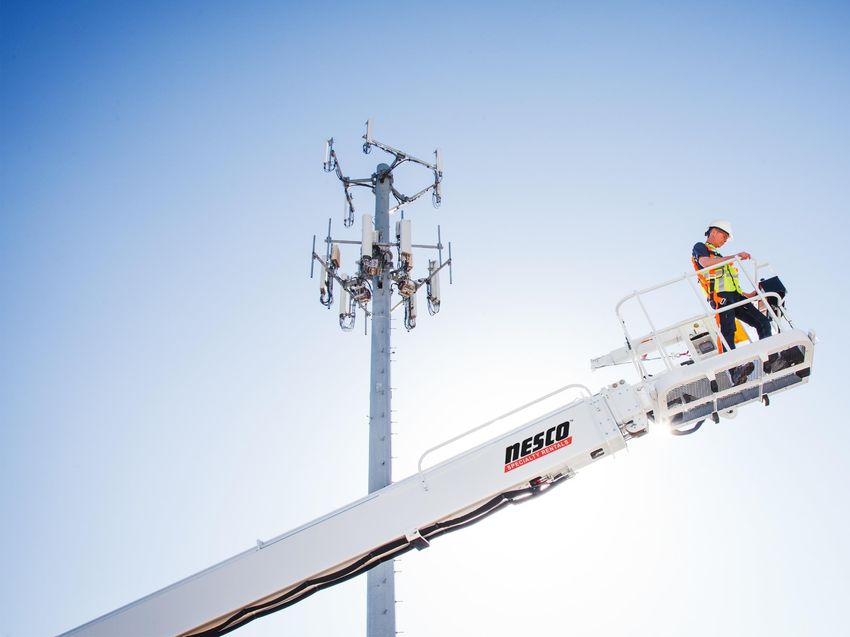
Track Record of Growth and Creating Shareholder Value

    Prior                               October 2009                                                    July 2015                                          June 2017
Investments                 Capitol I created Two Harbors, which                             Capitol II merged with Lindblad                  Capitol III completed a $2.4 billion merger
                            grew into the third largest mortgage                          Expeditions, fully-funding the growth                   with Cision, reducing leverage and
                           REIT in the U.S., growing its market cap                     plan and helping to execute a significant             enabling management to execute its M&A
                               from $119 million to $4.4 billion                            fleet expansion and acquisitions                   strategy and accelerate organic growth

 Creating                                   114%                                                           62%                                                43%
Shareholder                                                                                    Return Since Merger                                   Return Since Merger
                                   Return Since Merger
   Value                                                                                        vs. 41% for S&P                                       vs. 20% for S&P
                                    vs. 124% for S&P

   Track                         $1m to $326m                                                              46%                                                21%
 Record of                              2009 to 2015                                              2015 to 2019E                                        2017 to 2019E
  Growth                                Core Earnings                                           Adj. EBITDA Growth                                   Adj. EBITDA Growth

 Source: Company filings, FactSet and Thomson One.
 Note: Data as of April 5, 2019 and based on IPO investor returns since business combination. Two Harbors based on total return compared to
 the S&P 500 Total Return Index during Mark Ein’s tenure as Vice Chairman of Two Harbors from merger to May 14, 2015. 2019 Adj. EBITDA
 projections are based on Thomson One consensus.                                                                                                                                            5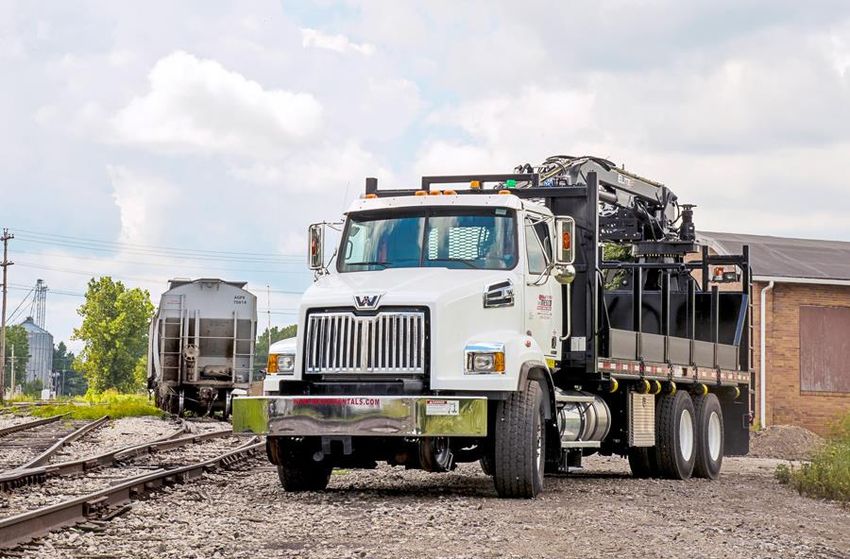
Extraordinary Team of Value Creators

                                   •    Best track record of all SPAC sponsors that have                                                    •    Brings valuable operational and industry expertise
                                        completed more than one deal since October 2009                                                          to Nesco, having initially invested in the company
                                        in terms of total returns since merger                                                                   in 2014
                                   •    All three prior deals are in the top 10 best                                                        •    Will maintain 70% of its existing equity in Nesco
                                        performing SPACs in terms of total returns since                                                         and will continue to support the company with
    Mark           Dyson                merger out of over 130 raised since October 2009                   Doug    Rahman                        board of director representation
    Ein            Dryden                                                                               Kimmelman D’Argenio

                    17%                                            #1                                                          17%                                  $14bn
        Average Annualized Return of                          SPAC Sponsor                                                Average Net IRR                                   Equity
             Prior SPAC Deals                                  Track Record                                                 Since 2010                                     Invested

                            William Plummer                                                                                               Jeffrey Stoops

                   •   Will help oversee Nesco’s growth as                                                                 •    Will add valuable experience to Nesco’s

                   •
                       Chairman
                       As CFO of United Rentals from 2008
                                                                         $11bn                                             •
                                                                                                                                board as an independent director
                                                                                                                                As CEO of SBA Communications since
                                                                                                                                                                                 $22bn
                       to 2018, he created tremendous value          Market Value Creation                                      2002, he brings valuable telecom              Market Value Creation
                       for shareholders                               ($385m to $11.4bn)                                        infrastructure industry insights and has       ($553m to $22.6bn)
                                                                                                                                created substantial shareholder value

United Rentals vs. S&P 500 Indexed Returns                                                                SBA Communications vs. S&P 500 Indexed Returns
                                                                                                                                                                                          1,544%
                 21x                                                               2,148%                                 15x                                                               SBA
                                                                                United Rentals
               Total Share                                                                                              Total Share
               Price Return                                                                                             Price Return
                                                                                   339%                                                                                                    252%
                                                                                  S&P 500                                                                                                 S&P 500

Source: Company filings, FactSet and Pitchbook.
Note: Capitol data as of April 5, 2019 and is based on IPO investor returns since business combination. SPAC ranking data only includes
SPACs that raised ≥$100 million since October 2009 and completed more than one deal. ECP net IRR as of December 31, 2018. William
Plummer’s market data is from his tenure as CFO from December 1, 2008 to October 12, 2018. Jeffrey Stoops’ market data is from his                                                                    6
appointment as CEO on January 1, 2002 to April 5, 2019.
Capitol Investment Thesis
▪     Premier Industrial Growth Business. Nesco is a leading provider of specialty rental equipment to support critical maintenance, repair, upgrade
      and installation services for electric transmission and distribution, communications and rail infrastructure in North America

▪     Compelling End-Market Opportunity. The growing demand for Nesco’s specialty rental equipment is a direct result of attractive secular drivers
      in each of its three end-markets: (a) investments by electric utilities to replace an aging grid, integrate growing renewable and gas generation and
      strengthen grid reliability; (b) increased telecom infrastructure spending driven by 5G rollout (small cells); and (c) capex to support growing freight
      and intermodal volume together with commuter rail projects

▪     Diversified, Long-Tenured and Blue-Chip Customer Base. Breadth of equipment and geographic reach allow Nesco to uniquely meet the
      demands of its long standing customers (16-year average for top 10), which provides for significant recurring business (~90% of revenue to
      recurring customers) due to customers’ focus on long-term projects that often take years to complete

▪     Significant Embedded Investment in Specialized and Young Fleet. Nesco has a young, specialized fleet of ~4,000 rental units with an
      Original Equipment Cost, or OEC, of $547m and an average unit age of only 3.8 years vs. its expected useful life of up to 25 years

▪     Strong Financial Performance and Attractive Unit Economics. Adj. EBITDA has grown at a 24% CAGR from 2016 to 2018, from $79 to
      $122 million and is projected to grow 63% over the next three-year period from $122 million to $198 million. Proven ability to add new equipment
      with high financial returns – unlevered IRRs of approximately 30%

▪     Meaningful, Highly Visible Organic Growth Opportunities. Nesco has foregone an increasing number of business opportunities (>4,000
      from 2017 to 2018) due to lack of product availability. With a strengthened capital structure, Nesco and Capitol plan to invest $139 million of growth
      capex in its fleet in 2019 and 2020 to capture this existing demand and growing end-market demand. Additional revenue growth is expected from
      increased customer penetration in parts, tools and accessories enabled by the recent acquisitions of N&L and Bethea

▪     Accretive M&A in Fragmented Industry. Six accretive tuck-in acquisitions since 2012 at a weighted average EBITDA multiple of 5.7x, or 4.0x
      after realized synergies, have broadened Nesco’s end-markets and product offerings. Nesco has an actionable pipeline of additional opportunities
      available at accretive multiples

▪     World-Class Board and Leadership. William Plummer (former CFO of United Rentals for 10 years) and Jeffrey Stoops (CEO of SBA
      Communications for the last 17 years) each intends to make an investment in the combined company and will bring valuable company building and
      public company experience in relevant industries to an impressive board that also includes Nesco CEO Lee Jacobson, Capitol’s sponsors and
      representatives of Energy Capital Partners

▪     Attractive Valuation. Transaction values Nesco favorably at 7.9x 2019E Adj. EBITDA and 6.4x 2020E Adj. EBITDA, representing an attractive
      entry point to participate in Nesco’s highly-visible, outsized growth opportunity

Source: FY19 Report of the Secretary of Transportation to the US Congress, U.S. Department of Transportation and Wall Street research.
Note: See the disclaimers at the beginning of this presentation for important qualifications and limitations on the use of projections. Actual results
may differ materially. Assumes no acquisitions in the projected period. SPAC ranking data as of April 5, 2019 based on IPO investor returns since
business combination and only includes SPACs that raised ≥$100 million.
                                                                                                                                                                7
Company Overview
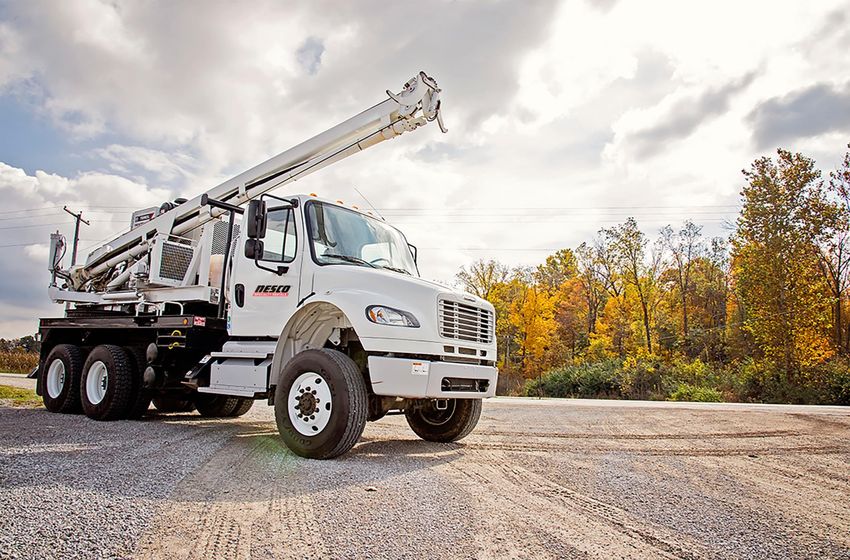
8Nesco Is a Leader in Highly Specialized Rentals
Nesco is a leading North American provider of specialty rental equipment to electric utilities,
telecoms, railroads and related contractors for critical maintenance, repair, upgrade and
installation work
Equipment Rental and Sales Parts, Tools and Accessories
Transmission and Rail, Lighting, Utility Equipment
Distribution Signage and Telecom Outfitters
Specialized rental services for utilities Specialized rental services for telecoms, Vertically-integrated rental services
and utility contractors maintaining, railroads and related contractors to and sales of specialized parts, tools
upgrading and constructing critical support critical infrastructure maintenance, and accessories primarily to existing
transmission and distribution repair and installation services. Entered customers. Started UEO in 2015 to
infrastructure this end-market in 2016 provide a one-stop shop offering
2018 Average OEC $404m $125m $18m (1)
2018 Revenue $166m $50m $29m
‘16 - ’18 Revenue CAGR 5% 50% 45%
56% Distribution / 60% Telecom / 31% Rail / 40% Rental /
Revenue Mix
44% Transmission 9% Signage & Lighting 60% Sales
Average Rental Period 13.8 months 9.7 months NA
Note: 2018 revenue split excludes $2 million of revenue from Renta.
1. Excludes $11m of inventory held for UEO sales. 9Young, Specialized Fleet
Nesco has a young, specialized fleet of ~4,000 rental units with an average unit age of 3.8 years,
far below the average unit’s useful life of up to 25 years
# of % of Useful Average Equipment
Equipment Description Units OEC OEC Life Age Cost
Used to maintain and construct utility,
rail or telecommunications lines or
Bucket $50k -
equipment at height with a bucket 1,508 $229m 45% 18 years 3.7 years
Trucks $650k
mounted on an insulated or non-
insulated hydraulic lifting aerial device
Digger Used to dig holes and hoist and set $150k -
889 $168m 33% 18 years 4.2 years
Derricks utility, rail and telephone poles $500k
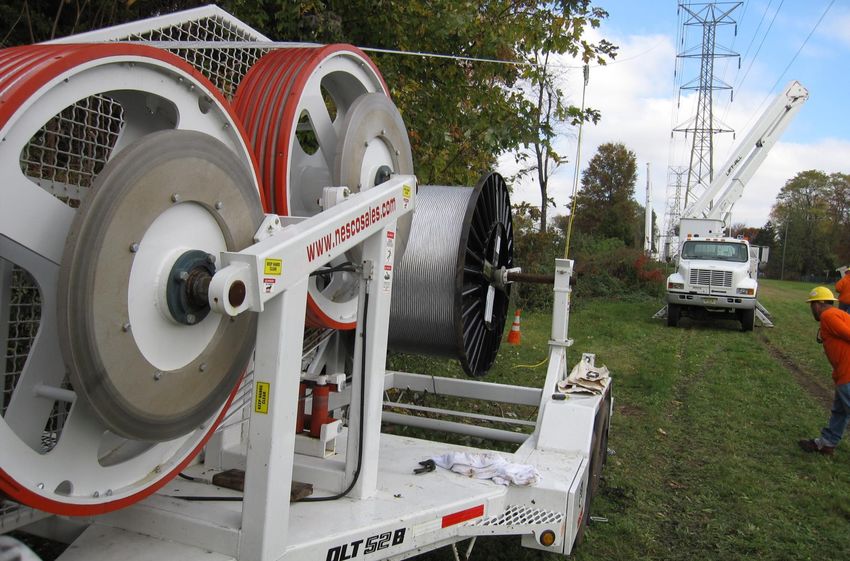
Used to string new and re-conduct
overhead utility, rail, telecom or cable
Line $2k -
lines (includes pole trailers, reel 894 $45m 9% 25 years 3.2 years
Equipment $650k
handling trailers and other material
handling trailers)
Used for large-scale transmission line
repair and construction (often outfitted
$125k -
Cranes with buckets) and in multiple rail 179 $38m 8% 15 years 3.4 years
$750k
applications for material handling and
lifting
Used to dig holes for utility poles,
Pressure $300k -
structure bases and foundations 51 $18m 4% 20 years 5.9 years
Diggers $550k
through hard materials such as rock
Used to place and remove
Underground underground utility and $85k -
103 $8m 2% 20 years 3.7 years
Equipment telecommunication lines without $150k
disruption to the surface
Note: Average OEC as of 12/31/18. Excludes 328 units of trucks/miscellaneous equipment (including hi-rail service trucks, grapples, roto-dumps,
PTC trucks, etc.) used primarily in hi-rail applications and $18 million OEC of UEO rental equipment. 10Attractive Asset-Level Economics
Long-lived equipment assets offer highly attractive economic returns with unlevered IRRs
approaching 30% and unlevered MOICs over 2.5x
▪ Nesco’s scale, footprint and differentiated sales and service model have created a significant competitive advantage for the company in the
marketplace enabling attractive returns on capital
▪ Equipment can either be sold at the end of a chassis life (7-8 years) or remounted on a new chassis at attractive returns (additional 7-8
year life)
Illustrative New Fleet Investment ROI
Equipment Sold Equipment Remounted
in 7 Years & Sold in 15 Years
$95k +
Upfront Cost $95k
$62k remount (year 8)
Year 1 EBITDA Contribution $26k $26k
Utilization 80% 80%
Gross Profit Margin 80% 80%
Recovery as a % of OEC 50% 25%
Unlevered IRR 29% 29%
Unlevered MOIC 2.5x 3.0x
Note: Illustrative analysis shown for the 42-45’ Insulated Aerial 4x4 Bucket Truck, a top product line in the T&D and RLST end-markets. 11Recurring, Longstanding Customer Relationships
90% of sales are to recurring customers and no customer represents more than 11% of sales
▪ Nesco serves as a key supplier to utilities, telecoms, railroads and related contractors for their specialty rental equipment needs, with most
relationships on a “first call” basis
▪ Nesco’s breadth of equipment and geographic reach allow the company to uniquely meet the demands of the largest national customers,
which provides for significant recurring business due to their focus on long-term projects that often take years to complete
Diverse Customer Base
1,860 customers 16-year average tenure across top 10 customers
12Broad Geographic Reach
Nesco has a broad geographic footprint across the U.S., Canada and Mexico and provides its
customers a “one-stop shop” for all their rental and parts needs
▪ Nesco has broad geographic diversity, with no state, province or territory representing more than 15% of revenues
(1)
(2)
Headquarters
Operated Facilities (13)
Third-Party Service Locations (44)
Future Parts, Tools, and Accessories Facilities (4)
Note:
1. Alvarado, TX parts, tools and accessories co-located expansion opening in Q2 2019.
2. Tallahassee, FL parts, tools and accessories co-located expansion opening in Q2 2019; includes 34k sq. ft. of additional leased space. 13Industry-Leading Management Team
Nesco’s current management team has successfully implemented several growth initiatives
including the launch of the PTA segment, expansion into two new end-markets, internalization of
equipment servicing, development of remounting capabilities and accretive acquisitions
Lee Jacobson – Chief Executive Officer Bruce Heinemann – Chief Financial Officer
▪ More than 19 years of experience in the utility ▪ Over 25 years of experience in finance and
equipment rental and sales industry accounting for a range of industrial and
▪ Prior to joining Nesco in 2012, served as Vice manufacturing companies
President and General Manager for Terex ▪ Prior to joining Nesco in 2016, served as CFO
Utilities, a key supplier and partner of Tyden Group, a global leader in track and
▪ Significant M&A experience having led an trace solutions
acquisition every quarter, on average, over 5 ▪ Over 10 years of operational experience as
years with a prior company Director of Supply Chain Operations for
Unisys Corporation
Title Years of Relevant Experience
Kevin Kapelke Chief Operating Officer 25 Years
Heath Northcutt Regional Vice President of Sales – T&D >25 Years
Tim Bryan President – RLST 20 Years
Kent Upton President – UEO >25 Years
Dennis DePazza Chief Business Development Officer >25 Years
Jameson Ringger EVP of Operations and Eastern Sales 17 Years
Beth Steffen VP of Western Sales >25 Years
Brady Rodgers President – Renta 25 Years
14Industry Trends
15Large and Growing End-Markets
Annual capex spend in Nesco’s end-markets exceeds $100 billion and end-market growth has
limited correlation with broader GDP
$60bn+
Transmission
and Distribution
Spend
$30bn+
Wireless $10bn+
Spend Class I Rail
Spend
Nesco Index Growth Has Limited Correlation with Broader Economy
Growth CAGR
GDP
’01-’05 ’05-’09 ’09-’17 ’01-’17 Correlation
U.S. GDP 5.4% 2.6% 3.8% 3.9% 1.00
Construction(1) 7.3% (5.0%) 4.1% 2.5% 0.72
Nesco Index (2) 7.4% 5.7% 9.0% 7.8% 0.52
Source: FactSet, Federal Reserve Economic Data and Wall Street research.
Note:
1. Total construction spending from Federal Reserve Economic Data.
2. Based on current end-market mix of 81% T&D, 13% telecom and 6% rail excluding other end-markets, which is primarily comprised of signage
and lighting and represents under 2% of revenue. T&D based on T&D capex from Wall Street research. Telecom based on wireless
communication spend from USTelecom research. Rail based on capex of the top 6 public railroads. 16Nesco’s End-Markets Provide Growth Without Sacrificing Stability
Nesco Has Best-in-Class End-Market Mix in the Specialty Rental Industry
Nesco End-Markets(1) Specialty Rental End-Markets(2)
No Construction End-Market Exposure
Nesco’s End-Markets Are Highly Stable
(Change in Spending During the Great Recession – 2008 to 2010)
Source: Company filings, FactSet, Federal Reserve Economic Data, USTelecom research and Wall Street research.
Note:
1. Excludes other end-markets, which is primarily comprised of signage and lighting and represents under 2% of revenue.
2. Based on the average end-market mix of WillScot and Mobile Mini. 17Electric Utilities: Early Innings of Multi-Year Upcycle
Transmission and distribution industry, with an annual spend of over $60 billion, is in the early
years of a decade long secular upcycle driven by utilities’ investments (1) to replace and
strengthen an aging grid; (2) to integrate growing renewable and gas generation; and (3) to
support the electrification of fossil fuel driven sectors
▪ An estimated 40% - 50% of existing transmission and distribution infrastructure is at or beyond engineered lives
▪ Migration to renewables and gas requires extension of the power grid in addition to storm hardening maintenance initiatives
▪ Decarbonization is driving the electrification of vehicles, heating technology and industrial processes which will significantly expand electricity
demand and require a transmission investment of up to $90 billion by 2030
U.S. & Canada Electric Transmission Projects Customer Backlogs Signal Continued Growth
($ in billions) (Backlog – $ in millions)
$8,545
$40.1
$610
$31.9 $12.3 $7,359
$26.3 $27.2
$24.6 $9.3
$354
$11.1 $10.2
$12.6
$27.8
$22.6
$15.2 $17.1
$12.0
2012A 2014A 2016A 2018A 2020E Quanta Mastec
Electrical Power & Infrastructure Electrical
Transmission
Small & Medium-Projects Large-Scale Projects 2017A 2018A
Source: Company filings, The Brattle Group and Wall Street research. 18Telecom: Long-Term Tailwinds from 5G Spend
5G upgrade cycle is driving a new wave of infrastructure spending with 5G capex by the Big 4
wireless providers expected to total ~$240 billion over the next decade while growing at a 40%
CAGR through 2023
▪ 5G wireless infrastructure roll-out is expected to add up to 20 times more small cells than the existing macro structure
▪ Nesco’s equipment is well suited to service the typical deployment locations on telephone poles, streetlights and sides of buildings
▪ Wireline infrastructure continues to require recurring maintenance
5G Spend Expected to Surpass Historical Spend Customer Backlogs Signal Continued Growth
(Communications Construction Spend – $ in billions) (Backlog – $ in millions)
2G Cycle 3G Cycle 4G Cycle 5G Cycle $7,330
$5,847
$4,276
$3,628
Dycom (1) Mastec
Communications
2017A 2018A
Source: Company filings and Wall Street research.
Note:
1. Dycom based on fiscal year ended January 26, 2019 and January 27, 2018. 19Rail: Increasing Investment in U.S. Infrastructure
Urban congestion and increased freight transportation needs have driven a nationwide
investment in improving rail infrastructure
▪ In 2019 the U.S. Senate approved spending of over $16 billion to support commuter rail and transit projects
– Special events like the 2028 Olympics in Los Angeles will require additional investment in transit projects
▪ Class I railroads spend more than $11 billion annually to maintain, upgrade and repair their rail systems
Class I Rail Capital Expenditures(1) Cost of Select Active Commuter Rail Projects
($ in billions) ($ in billions)
Source: FactSet, FY19 Report of the Secretary of Transportation to the US Congress, LA Metro’s Project Tracker, Massachusetts Department of
Transportation, Railway Technology, Smart Cities Drive, U.S. Department of Transportation and Wall Street research.
Note:
1. Figures include Norfolk Southern, Kansas City Southern, Union Pacific, CSX, Canadian National and Canadian Pacific. 20End-Market Shift to Rental Supports Growth
Nesco’s growth is supported by the ongoing secular shift from equipment ownership to rentals
among its customers
▪ Key drivers fueling Nesco’s end-markets to continue to shift to rental:
1. Avoidance of capital outlay
2. Improved asset utilization with significantly reduced storage and maintenance costs
3. Better risk management with dedicated customer care
4. Operational efficiencies drive improved productivity
5. Wider range of modern productive equipment in rental fleets
6. Health & safety regulations have increased implicit cost of ownership & maintenance
▪ Overall U.S. equipment rental market penetration is approximately 53% and is expected to grow to 65% over the next 10 years
– Management expects Nesco’s product categories to grow more rapidly than overall market given current estimated penetration levels of
only 20 to 25%
Rental Penetration Continues to Increase
(Rental Penetration of Equipment Fleet)
United States Other Developed Markets
Source: ARA / IHS Global Insight and Wall Street research. 21Growth Strategy
22Multiple Attractive Growth Levers
3
Actionable M&A
2 Pipeline in
Fragmented
Increase Market
Customer
1 Penetration in
Invest in New Parts, Tools and
Fleet to Fulfill Accessories
Unmet and
Growing
Demand from Inorganic
Continued Customers
Robust End-
Market Growth
Organic
231 Invest in Fleet to Meet Growing Excess Demand
Nesco’s growing excess demand is evidenced by more than 4,000 rental opportunities turned
away from 2017 to 2018 due to product availability
▪ The company expects to accelerate fleet investment in 2019 and 2020
– Growth capex will be allocated to product lines with the greatest excess demand, highest utilization and shortest payback periods
Excess Demand Is Growing Fleet Investment to Meet Excess Demand
(Opportunities Turned Away Due to Lack of Equipment (1)) (Increase in Average Rental Equipment Units)
($ in millions)
Growth Capex $56 $83 $38
Note:
1. Measured by individual pieces of equipment or units. 242 Increase Customer Penetration in Parts, Tools and Accessories
Meaningful opportunity to geographically expand Nesco’s cross-selling and rental of parts, tools
and accessories to large utility, telecom and rail customer bases
▪ Nesco established the parts, tools and accessories division in 2015
– Acquisition of N&L (2018) added certified expertise in regulation-mandated dielectric testing and manufacturing of certified live-line tools
– Acquisition of Bethea (2017) added manufacturing of blocks, the leading parts rental product
▪ Nesco will expand from two locations to six by 2020, providing customers a one-stop shop for test & repair services and a broad inventory of
insulated and non-insulated tools
Parts, Tools and Accessories Cross-Sell Opportunity
(Parts, tools and accessories revenue as a % of equipment rental revenue)
2018 2021E
Revenue $29m $80m
Locations 2 6
253 Pipeline of Actionable Future M&A
Fragmented market with many regional and local players allows Nesco to leverage its national
platform and act as a preferred consolidator
▪ Nesco has made six successful acquisitions since 2012, realizing 100%+ of expected synergies for every target
▪ The weighted average purchase EBITDA multiple of all six acquisitions is 5.7x, or 4.0x including realized synergies
Focus Areas for M&A Strong Record of Accretive M&A
EBITDA
Multiple % of
1▪ Targeted fleet expansion of the Purchase EBITDA (incl. Synergies
Transmission and Distribution, Rail, Target Date Price Multiple Synergies) Realized
Lighting, Signage and Telecom end-
Q3 2018 $5m 5.0x 2.1x 107%
markets and PTA segment at
accretive multiples
Q4 2017 $6m 10.0x 4.0x 100%
2▪ Manufacturers of highly specialized
product lines offering attractive Q3 2016 $25m 5.2x 4.9x 100%
returns (Rental Division)
Q2 2014 $13m 15.0x 4.5x 100%
(Utility Equipment Fleet)
3▪ Rental fleets, or businesses, in
adjacent markets Q4 2012 $64m 5.0x 4.0x 117%
Q3 2012 $12m 6.4x 4.0x 138%
(Utility Rentals)
Weighted Average 5.7x 4.0x
26Financial Overview
27Strong Revenue Growth
▪ In response to significant end-market demand, Nesco has grown revenue through expansion of the fleet, increased utilization and rapid build-
up of the parts, tools and accessories business
▪ With an enhanced capital structure following the merger with Capitol, Nesco can capitalize on the demand it is currently unable to serve
through further fleet expansion and a nationwide expansion of its parts, tools and accessories business
Revenue Growth
($ in millions)
Average Units
Average Utilization
Average Rate per Day
PTA Locations
PTA Revenue / Location
Note: See the disclaimers at the beginning of this presentation for important qualifications and limitations on the use of projections. Actual results
may differ materially. Assumes no acquisitions in the projected period. 28Significant EBITDA Growth
▪ Adj. EBITDA margin has increased 700 basis points from 2016 to 2018 primarily due to increased utilization of the fleet
▪ In order to address demand for its fleet, Nesco plans to invest $177 million over the next three years adding ~1,775 new pieces of equipment
– Average unit cost of ~$100k
– Expected to add $72 million of revenue and $52 million of EBITDA annually by 2021
▪ A nationwide expansion from two locations in 2018 to six by 2020 and a broadening of its product offering and services drives the growth of the
parts, tools and accessories business
▪ Future margin expansion is expected to be driven by:
– Fleet investment increasing high margin rental revenues as a percentage of the overall revenue mix
– Operating leverage as the investment in selling, general and administrative expenses has largely been completed
Adj. EBITDA Growth
($ in millions)
Adj. EBITDA Margin
Note: See the disclaimers at the beginning of this presentation for important qualifications and limitations on the use of projections. Actual results
may differ materially. In addition, please refer to the Appendix for a reconciliation of historical Adjusted EBITDA to GAAP measure. Assumes no
acquisitions in the projected period. 29Attractive Unlevered Free Cash Flow Growth
▪ Growth capex in 2019 and 2020 to meet excess demand is expected to result in over 60% unlevered FCF growth by 2021
– Consistent unlevered FCF growth excluding growth capex
▪ Attractive tax attributes on a levered FCF basis, driven in part by U.S. federal and state net operating loss carryforwards of over $300 million
and approximately $200 million, respectively, as of year end 2018
– Nesco’s net operating loss carryforwards have an estimated net present value of $57 million
Unlevered Free Cash Flow Growth(1)
($ in millions) ‘18-’21
CAGR
19%
17%
Adj. EBITDA
Maintenance Capex
(2)
Cash from UES
Growth Capex
UFCF Conversion (3)
Note: See the disclaimers at the beginning of this presentation for important qualifications and limitations on the use of projections. Actual results may
differ materially. Assumes no acquisitions in the projected period.
1. Defined as Adj. EBITDA - non-cash purchase accounting impact - gains on equipment sales - cash purchases of rental equipment (excluding cost
of new equipment sales) and other property and equipment + cash proceeds from rental equipment sales (excluding new equipment sales).
2. Cash proceeds from rental equipment sales excluding new equipment sales.
3. Defined as unlevered FCF excluding growth capex / Adj. EBITDA. 30Swift Deleveraging Delivers Value to Equity Holders
▪ Significant EBITDA growth and free cash flow generation is expected to result in rapid deleveraging
▪ Net leverage declines to leverage target of 3.0x by year end 2020 with ~1.0x deleveraging accreting to equity holders
Net Leverage(1)
Note: See the disclaimers at the beginning of this presentation for important qualifications and limitations on the use of projections. Actual results
may differ materially. Assumes future period excess cash flow is used to pay down debt. Assumes no acquisitions in the projected period.
1. Pro forma for expected debt refinancing as part of transaction assuming no share redemptions, resulting in $513 million of net debt at close. 31Business Combination
32Transaction Overview
▪ $411 million Capitol investment used to reduce leverage, increase
fleet investment, pay transaction expenses and to provide liquidity Post-Transaction Ownership(1)
to existing investors
▪ Nesco plans to refinance all existing debt as part of the transaction
▪ Existing Nesco Shareholders are maintaining 70% of their existing
equity
▪ Existing Nesco Shareholders will receive up to 1.8 million earnout
shares and Capitol sponsors will place 2.8 million of their founder
shares into earnout. Half of the earnout shares will be released at
$13.00 per share and the remainder at $16.00 per share if such
stock prices are reached within 5 years of closing
▪ Completion of the transaction is expected in 2nd Quarter 2019
Implied Firm Value Sources and Uses
($ in millions) Revenue Adj. EBITDA ($ in millions)
(1) Sources
Shares Outstanding 63.0
Capitol Cash Investment (2) $411
Share Price $10.00
New Senior Notes 400
Equity Value $630
(3) Draw on New ABL 75
Plus: Net Debt 513
Total Sources $886
Less: NPV of NOLs (4) (57)
Adj. Firm Value $1,086
Uses
Paydown of Existing Debt $759
Transaction Multiples Cash to Existing Shareholders 75
FV / 2019E Adj. EBITDA ($137M) 7.9x Estimated Fees and Expenses 52
FV / 2020E Adj. EBITDA ($170M) 6.4x Total Uses $886
Note: See the disclaimers at the beginning of this presentation for important qualifications and limitations on the use of projections. Actual results may differ materially. Assumes no acquisitions in the projected period.
1. Based on fully diluted shares outstanding at $10.00 share price. Excludes 19.95 million outstanding warrants with a strike price of $11.50 per share, 1.8 million incentive earnout shares to be released to existing Nesco
shareholders in 0.9 million increments when the stock price reaches $13.00 and $16.00 per share and 2.8 million incentive earnout shares held by Capitol sponsors to be released in 1.4 million increments when the stock
price reaches $13.00 and $16.00 per share. Assumes no redemptions of Capitol public shares.
2. Includes $402.5 million of cash raised from investors and $8.3 million of estimated interest earned on the trust account by transaction close.
3. Includes $33 million of existing capital leases and $6 million of notes payable assumed to remain with the company post-transaction.
4. Based on the net present value of approximately $300 million federal and approximately $200 million state NOLs as of year-end 2018. 33Highly Attractive Unit-Level Economics
Nesco’s specialty equipment and parts have attractive unit-level economics compared to other
specialty rental equipment types
Specialty Equipment Parts(1) Portable Storage(2) Tanks / Trailers(2) Modular Space
Representative
Sector Leaders
Useful Life of Primary
15 - 25 yrs 20 - 25 yrs (blocks) 30 yrs (containers) 25 yrs (steel tanks) 20 yrs (modular)
Rental Assets
Average Age of
Primary Rental 3.8 yrs 1.3 yrs 12 yrs(3) 10 yrs(3) 14.4 yrs
Assets
2018 Utilization 82% 72% 76% 74% 72%
Payback Period
(Through Rental ~3 yrs ~2 yrs ~3 - 3.5 yrs ~5 - 5.5 yrs ~4 - 4.5 yrs
Revenue(4))
Multiple of OEC
Earned Over 5.0 - 8.5x
Equipment Life 10.0 - 12.5x 8.5 - 10.0x 4.5 - 5.0x 4.5 - 5.0x
(Assuming 15 - 25 yrs)
(Through Rental
Revenue(5))
High
Low Medium Medium
(majority of revenue
Level of Cyclicality (stable growth of T&D demand (~40% construction (~40% construction
derived from oil & gas
over the past decade) exposure) exposure)
end-market)
Peak to Trough Adj.
EBITDA Performance (9%) (39%) (32%)
in Great Recession
Source: Company filings and Wall Street research.
Note:
1. Blocks comprise approximately 60% of parts, tools, and accessories rental revenue.
2. Portable storage comprises 80% of Mobile Mini’s revenue. Tanks / Trailers comprise the remaining 20%.
3. As of 2017 year end.
4. Rental revenue adjusted for 2018 utilization.
5. Useful life divided by payback period. Rental revenue adjusted for 2018 utilization. 34An Attractive Valuation…
Firm Value / 2019E Adj. EBITDA Firm Value / 2020E Adj. EBITDA
2018 Adj. EBITDA Margin
(1)
Source: Company filings, management guidance and Wall Street research.
Note: Market data as of April 4, 2019. Firm value adjusted for NPV of NOLs where applicable. See the disclaimers at the beginning of this presentation
for important qualifications and limitations on the use of projections. Actual results may differ materially. Assumes no acquisitions in the projected
period.
1. Pro Forma for the $1.1bn acquisition of ModSpace on August 15, 2018. 35With Compelling Financial Metrics
2016 - 2018 Revenue Growth 2018 - 2020E Revenue Growth
(1) (1)
2016 - 2018 Adj. EBITDA Growth 2018 - 2020E Adj. EBITDA Growth
(1) (1)
Source: Company filings, management guidance and Wall Street research.
Note: See the disclaimers at the beginning of this presentation for important qualifications and limitations on the use of projections. Actual results may
differ materially. Assumes no acquisitions in the projected period.
1. Pro Forma for the $1.1bn acquisition of ModSpace on August 15, 2018 and the $235 million acquisition of Acton Mobile on December 20, 2017. 36Attractive Opportunity for Investor Returns
Nesco’s growth plan capitalizes on achievable growth initiatives of accelerating fleet investment
to meet growing excess demand and continued penetration of its parts, tools and accessories
business, expected to result in attractive returns to equity holders
Deconstructing Nesco’s Growth
(Adj. EBITDA, $ in millions)
+$43m Investment in Fleet
to Meet Excess Demand
+$14m Increased Parts,
Tools and Accessories
Penetration
+$4m Margin Expansion /
Other
Superior Investor Return Opportunity
As of As of As of
($ per share) 3/31/2019 12/31/2019 12/31/2020
FV / Forward Adj. EBITDA 7.9x 7.9x 7.9x
Implied Stock Price $10.00 ~$13.00(1) ~$15.50(1)
Total Return ~30% ~55%
Note: See the disclaimers at the beginning of this presentation for important qualifications and limitations on the use of projections. Actual results
may differ materially. Assumes no share redemptions and future period excess cash flow is used to pay down debt. Assumes no acquisitions in
the projected period.
1. Calculated using fully distributed shares based on treasury stock method. 37Board of Directors of the Combined Company
▪ Former CFO and Executive Vice President of United Rentals for 10 years until October 2018
▪ Helped United Rentals grow its market capitalization from $385m to $11.4bn while increasing its stock price by 21.5x (compared to 3.4x for S&P 500)
▪ Over 20 years of financial leadership experience
▪ Serves on the boards of Global Payments and John Wiley & Sons and served on the board of UIL Holdings, an electric and natural gas utility company
▪ Prior to United Rentals, served as the CFO and EVP of Dow Jones & Company
▪ Previously served in various senior roles at Alcoa, Mead Corporation and General Electric Capital and worked at Lockheed Corporation, Goldman
William Plummer Sachs and Kidder and Peabody & Company
▪ Member of Financial Executives International and the New York Society of Security Analysts
Chairman
▪ CEO, President and Director of SBA Communications ▪ CEO of Nesco since 2012
since 2002, 2000 and 1999, respectively ▪ Prior to joining Nesco, served at Terex Utilities, a key
▪ Previously served as CFO of SBA Communications supplier and partner, for 10 years as Vice President and
▪ Helped SBA Communications grow its market General Manager, among other roles
capitalization from $553m to $22.6bn while increasing its ▪ Previously served as EVP at Pacific Utility Equipment
stock price by 15.4x (compared to 2.5x for S&P 500) ▪ More than 19 years of experience in the utility equipment
▪ Prior to SBA Communications, practiced law for 13 years rental and sales industry
Jeffrey Stoops in the corporate, securities and mergers and acquisitions Lee Jacobson ▪ Significant M&A experience having led an acquisition every
Director areas as a partner with Gunster Director & CEO quarter, on average, over 5 years with a prior company
▪ Founder, Chairman, and CEO of Capitol I, Capitol II,
Capitol III and Capitol IV ▪ Founder, Senior Partner and investment committee
▪ Chairman of Lindblad Expeditions member at Energy Capital Partners
▪ Vice Chairman of Cision ▪ Current Nesco board member
▪ Strong track record of value creation, having been ▪ Serves on the boards of Calpine, USD Group, USD
involved in early stages of six companies that reached Partners and Sunnova Energy
$1bn valuation ▪ Previously General Partner at Goldman Sachs in the
Mark Ein ▪ Serves on the board of many civic, philanthropic and Doug Kimmelman Pipeline and Utilities investment banking group
Director charitable organizations Director
▪ CFO, President and Director of Capitol III and Capitol IV ▪ Partner and investment committee member at Energy
▪ CFO and Director of Capitol II Capital Partners
▪ Lead investment banker on Capitol I ▪ Current Nesco board member
▪ Director on the boards of Cision and Lindblad Expeditions ▪ Serves on the boards of Sunnova Energy, CM Energy,
▪ Vice Chairman of CDS Logistics Triton Power Partners, and PLH Group
▪ Previously, Managing Director at Citi in the investment ▪ Previously a director at First Reserve corporation and
Dyson Dryden banking division Rahman D’Argenio investment banker at Deutsche Bank
Director Director
38Appendix
39Adjusted EBITDA Reconciliation
Reconciliation of Net Income to Adjusted EBITDA
($ in millions)
Year Ended December 31,
2016A 2017A 2018A
GAAP Net income (loss) ($48.0) ($27.1) ($15.5)
Depreciation and amortization 59.1 64.7 67.1
Interest expense 48.2 53.7 56.7
Income tax expense (benefit) 1.3 (3.5) 1.7
GAAP EBITDA $60.6 $87.9 $110.0
Non-cash purchase accounting impact 12.9 4.3 3.6
Transaction and process improvement costs(1) 1.5 1.9 2.5
Non-routine repairs (2) 2.3 2.1 --
Other non-recurring items(3) 0.9 0.7 2.9
Share-based payments 0.5 1.1 1.1
Asset impairment (4) -- 0.6 1.4
Adjusted EBITDA $78.8 $98.6 $121.7
Note:
1. Primarily transaction fees and financing fees.
2. Per an accounting policy change, these items are capitalized starting in 2018.
3. 2016 amount represents non-cash inventory charge related to acquisitions. 2017 amount represents tax refunds related to overestimated
sales tax. 2018 amount primarily represents operating leases that were acquired out of their lease.
4. 2017 amount represents a non-cash impairment charge related to certain rental assets held for sale. 2018 amount represents an
impairment charge related to the refurbishment/replacement of an asset. 40Capex Reconciliation
Reconciliation of Total Capex to Maintenance and Growth Capex
($ in millions)
Year Ended December 31,
2016A 2017A 2018A
Purchase of equipment - rental fleet (1) $36.7 $47.1 $58.5
Plus: Purchase of other property and equipment 0.5 0.4 0.7
Less: Other (2) (0.1) (0.0) --
Total capex $37.1 $47.5 $59.2
Less: Cost of new equipment sales (13.0) (8.7) --
Total capex excluding cost of new equipment sales $24.1 $38.8 $59.2
Less: Management's estimate of maintenance capex (24.1) (28.0) (41.8)
Growth capex -- $10.8 $17.4
Note:
1. 2016 and 2017 purchase of equipment - rental fleet in the financial statements includes the purchases of new equipment for dealer sales.
2018 excludes the purchases of new equipment for dealer sales.
2. Represents Other from the cash flows from investing. 41Unlevered Free Cash Flow Reconciliation
Reconciliation of Adjusted EBITDA to Unlevered Free Cash Flow
($ in millions)
Year Ended December 31,
2016A 2017A 2018A
Adjusted EBITDA $78.8 $98.6 $121.7
Less: Maintenance capex (24.1) (28.0) (41.8)
Plus: Proceeds from sale of equipment - rental fleet (1) 35.6 26.6 33.3
Less: New equipment sales (14.4) (10.1) --
Less: Non-cash purchase accounting impact (12.9) (4.3) (3.6)
Less: (Gain) Loss on sale of equipment - rental fleet 7.7 (1.8) (3.6)
Unlevered free cash flow excl. growth capex $70.7 $81.0 $105.9
Less: Growth capex -- (10.8) (17.4)
Unlevered free cash flow $70.7 $70.2 $88.5
Note:
1. 2016 and 2017 proceeds from sale of equipment - rental fleet in the financial statements includes the proceeds from new equipment from
dealer sales. 2018 excludes the proceeds from new equipment for dealer sales. 42You can also read