Fixed Income Investor Update Presentation - February 2021 - Seeking Alpha
←
→
Page content transcription
If your browser does not render page correctly, please read the page content below

Fixed Income Investor
Update Presentation
February 2021

Disclaimer

 Forward-Looking Information
 This investor presentation contains “forward-looking statements” within the meaning of applicable securities laws. Forward-looking statements contained in this investor presentation may be based on forecasts of future results and estimates
 of amounts not yet determinable. These statements may include, but are not limited to, comments relating to guidance, strategies, expectations, planned operations or future actions. Forward-looking statements are identified using terms
 and phrases such as “anticipate”, “believe”, “could”, “estimate”, “expect”, “intend”, “may”, “plan”, “predict”, “project”, “will”, “would”, and similar terms and phrases, including references to assumptions. All statements other than statements
 of historical facts included in this investor presentation may constitute forward-looking statements within the meaning of applicable securities laws. Forward-looking statements include, among others, statements pertaining to:
 •     Cineplex Inc.’s (the “Company” or “Cineplex”) outlook, goals, expectations and projected results of operations, including factors and assumptions underlying Cineplex’s projections regarding the duration and impact of a novel strain of
       coronavirus (“COVID-19”) pandemic on Cineplex, the movie exhibition industry and the economy in general, as well as Cineplex’s response to the pandemic related to the closure of its theatres and location-based entertainment (“LBE”)
       venues, employee reductions and other cost-cutting initiatives and increased expenses relating to safety measures taken at its facilities to protect the health and wellbeing of guests and employees;
 •     Cineplex’s expectations with respect to net cash burn, liquidity and capital expenditures, including its ability to meet its ongoing capital, operating and other obligations, and anticipated needs for, and sources of, funds;
 •     Cineplex’s ability to execute cost-cutting and revenue enhancement initiatives in response to the COVID-19 pandemic; and
 •     the Company’s assessment of market risks.
 Forward-looking statements, by their nature, are based on assumptions, including those described in this investor presentation are subject to important risks and uncertainties. In particular, the Company’s expectations with respect to net
 cash burn are subject to current assumptions regarding its ability to successfully implement and sustain a variety of measures to reduce its expenses discussed in this investor presentation. Forward-looking statements cannot be relied upon
 due to, amongst other things, changing external events and general uncertainties of the business of the Company. Actual results may differ materially from results indicated in forward-looking statements due to a number of factors, including
 those discussed below.
 The COVID-19 pandemic has had an unprecedented impact on Cineplex, along with the rest of the movie exhibition industry and other industries in which Cineplex operates, including material decreases in revenues, results of operations and
 cash flows. The situation continues to evolve and the social and economic effects are widespread. As an entertainment and media company that operates spaces where guests gather in close proximity, Cineplex’s business has been
 significantly impacted by the actions taken to control the spread of COVID-19. These actions include, among other things, the introduction of social distancing measures and restrictions including those on capacity. There is limited visibility on
 when these restrictions will be lifted in many of the markets in which Cineplex operates and how quickly guests will return to Cineplex’s locations once its operations resume due to prolonged safety concerns and adverse economic conditions.
 Cineplex is actively monitoring the situation and is adapting its business strategies as the impact of the COVID-19 pandemic evolves.
 Cineplex cautions readers that the foregoing list of factors that may affect future results is not exhaustive. When reviewing Cineplex’s forward-looking statements, readers should carefully consider the foregoing factors and other uncertainties
 and potential events. Additional information about factors that may cause actual results to differ materially from expectations and about material factors or assumptions applied in making forward-looking statements, may be found in the
 “Risk Factors” sections of the Company’s annual information form dated March 16, 2020 for the financial year ended December 31, 2019 and management’s discussion and analysis of results of operations and financial condition (the
 “MD&A”) dated February 10, 2021 for the financial year ended December 31, 2020 and in the Company’s other filings with Canadian securities regulatory authorities. Cineplex does not undertake to update any forward-looking statements,
 except as required by applicable Canadian securities law; such statements speak only as of the date made.
 Non-GAAP Financial Measures
 This investor presentation makes reference to certain non-GAAP measures that are used by management to evaluate the performance of Cineplex. Because non-GAAP measures do not have standardized meanings, securities regulations
 require that non-GAAP measures be clearly defined and qualified, and reconciled to their nearest GAAP measure. The Company’s key performance measures include EBITDA, adjusted EBITDA, adjusted EBITDAaL and Net Cash Burn. Readers
 are advised to review the section entitled non-GAAP measures in the MD&A for a further discussion of such non-GAAP measures and certain other non-GAAP measures used by the Company.
 Certain Other Matters
 In this investor presentation, all amounts are in Canadian dollars, unless otherwise indicated.
 This investor presentation is for the confidential use of only those persons to whom it is transmitted. By their acceptance of this investor presentation, recipients agree that they will not transmit, reproduce or make available to any person
 this investor presentation or any of the information contained herein. No person has been authorized to give any information or to make any representations about Cineplex not contained in this investor presentation.
 Neither Cineplex nor any other person makes any representation or warranty, express or implied, as to the completeness of the information contained in this investor presentation. This investor presentation does not purport to contain all of
 the information regarding Cineplex, its business, affairs or prospects. Investors should refer to Cineplex’s public disclosure for further information regarding Cineplex which is available on SEDAR at www.sedar.com.

© Cineplex Inc. Not to be distributed, reproduced or used without permission.                                                                                                                                            2
Section 1: Introduction
Presenters

                                                                 Ellis Jacob
                                                                 President and Chief Executive Officer
                                                                 •   Mr. Jacob has been working in the motion picture exhibition industry since 1987
                                                                 •   Assumed current position in 2003
                                                                 •   Prior to joining Cineplex, Mr. Jacob was CEO and Co-Founder of Galaxy
                                                                 •   Holds an MBA from Schulich School of Business

                                                                 Gord Nelson
                                                                 Chief Financial Officer
                                                                 •   Appointed CFO of Cineplex Galaxy Income Fund in 2004; continued in this role following
                                                                     the Company’s conversion to a corporation in 2011
                                                                 •   Mr. Nelson oversees the finance, purchasing, investor relations, risk management and
                                                                     corporate development areas of the Corporation
                                                                 •   Holds an MBA from the University of Toronto

© Cineplex Inc. Not to be distributed, reproduced or used without permission.                                                                               4
Section 2: Business Update

Active Liquidity Management
                                •    On February 8, 2021, Cineplex entered into a third amendment agreement to the credit agreement dated November 13, 2018, as amended:
                                        − Third amendment will become effective upon completion of the issuance of at least $200 mm of notes on or prior to March 31, 2021
                                        − Allowance to issue up to $250 mm of second lien debt with a maturity of at least 5 years
                                          ▪    $100 mm of any issuance is to be used as a permanent reduction to credit facilities
                                        − Suspension of financial covenant testing until Q4 2021; total leverage covenant of 3.75x based on annualized adj. EBITDA will apply and step-
  Bank Amendment
                                            down each quarter to 3.00x by Q3 2022
     Agreement
                                        − Addition of senior leverage covenant commencing Q4 2021, which will be set at 1.0x lower than total leverage covenant
                                        − Continuation of liquidity covenant effective at all times through covenant suspension period and for Q4 2021
                                        − A block on distributions during the covenant suspension period and only permitted when total leverage is less than 2.75x (based on LTM
                                            EBITDA)
                                        − Effective with Q4 2021, additional growth capex will be subject to a total leverage covenant of 2.75x (based on LTM EBITDA)

                                •    On January 12, 2021, Cineplex closed the sale and leaseback of its head office building in Toronto, Ontario
 Sale and Leaseback
                                         − The transaction resulted in gross proceeds of $57 mm
  of Headquarters
                                •    50% of the net proceeds were used to permanently pay down existing credit facilities

                                •    On December 18, 2020, Cineplex announced enhancements to its SCENE loyalty program
                                •    Cineplex announced an agreement with Scotiabank that will expand the SCENE loyalty program by bringing together the full benefits of SCENE with Scotia
   Enhanced SCENE                    Rewards, Scotiabank’s flexible customer loyalty program
     Agreements                          − As part of the agreement, Scotia paid Cineplex $60 mm in December 2020
                                         − 50% of the net proceeds were used to permanently pay down existing credit facilities
                                •    Additionally, SCENE signed a three year extension to its agreement with Recipe Unlimited Corporation

                                •    Selected provinces are advancing into initial stages of post-COVID reopening, often with some level of capacity restrictions
                                •    Canada started rolling-out vaccines in December 2020 and has been ramping up vaccination efforts which bodes well for the re-opening of theatres
     Reopening of
                                     across the country
       Theatres
                                •    Looking forward to reopening circuit of theatres and entertainment venues across Canada and currently expecting to see a return to more normal
                                     operating conditions in the second quarter of this year

© Cineplex Inc. Not to be distributed, reproduced or used without permission.                                                                                       6
Managing Cash Flow through COVID-19
                               •    Response to COVID-19 has been focused on the safety of guests / employees and to be responsive to government mandated closures
       COVID-19                •    COVID-19 strategies and financial support programs continue to evolve and the Company continues to maximize its opportunities under these
       Response                     programs
         Plan
                               •    Cineplex has been able to maintain connections with its guests via various channels and will use these to communicate the various safety
                                    measures put in place to ensure their safety during a long-deserved outing

                               •    Non-essential spending has been curtailed (both operating expenses and capital expenditures)
                               •    Salary reductions implemented for all staff in Q2 2020 with key executives continuing to Q3 2020; temporary layoffs of all hourly staff as well as
                                    selected full-time staff and elimination of 130 roles in July 2020 to significantly reduce payroll costs

      Expense                  •    Proactive negotiations with landlords for rent relief, including abatements, fixed rent reductions and converting fixed rent to variable rent
     Management                     depending on attendance, until attendance returns to previous levels
                               •    Working with major suppliers to modify the timing and amount of certain contractual payments
                               •    Continuing the suspension of dividends
                               •    Since March 15, 2020, the Company has experienced a net cash burn of approximately $20 mm per month on average for 2020 (Q2-Q4)

                               •    The Company has received the Canada Emergency Wage Subsidy (“CEWS”) which covers 75% of wages for full-time employees (up to $847 per
                                    week) for the period from March 15, 2020 to December 31, 2020; the federal government announced the program will be extended to June
        Support                     2021, however the benefits have not yet been announced
       Programs
                                         −    As a result of the measures mentioned above as well as the CEWS, Cineplex has reduced theatre payroll expenses from ~$41.9 mm in Q4
                                              2019 to ~$5.2 mm in Q4 2020

                               •    Purchases of property, plant and equipment to be reduced to focus on maintenance capex and certain agreed upon projects
  Capex Reductions
                                         −    FY2020 purchases of property, plant and equipment (net of tenant inducements) of $49 mm ($132 mm in FY2019)

© Cineplex Inc. Not to be distributed, reproduced or used without permission.                                                                                     7
Learnings from Partial Theatre Openings and Outlook

                   Learnings from Partial Theatre Openings                                         COVID-19: Enhanced Measures
 • Positive guest response to health and safety protocols                       •   Top priority is the health and safety of our employees and our guests
                                                                                •   Sought advice from the country’s top infectious disease experts
 • No impacts on concession sales
                                                                                •   Developed and implemented an industry-leading program
 • Significant growth in home delivery platforms
 • Pent-up consumer demand – willingness to see old catalogue titles                           Seat, handrails and                   Auditorium capacity is
 • No issues with willingness of staff to return when recalled                               children’s booster seats                  reduced to ensure
                                                                                            are wiped down between                  compliance with physical
 • Strong demand from agency and media clients – just need certainty                             each show time                       distancing guidelines
   on reopening

                                                                                             Hand sanitizer available               Contactless purchase and
                                                                                            in lobby and games areas                     entry methods

                                                                                            Masks are encouraged for                  Employees must wash
                                                                                            guests and required by all              their hands at least every
                                                                                                   employees                               30 minutes

© Cineplex Inc. Not to be distributed, reproduced or used without permission.                                                           8
Theatre Exclusivity and Streaming Trends
Canadian Box Office Trends(1) Streaming and Direct-to-Home
Source: Movie Theatre Association of Canada • COVID has challenged the status quo of exclusive release of major films
through traditional exhibitors
$1,031 − Some studios are electing to release their films straight to streaming
$1,006 $994 $993 $1,022
services
• Universal has entered into Premium Video on Demand (PVOD) models with
78% 78% 77% 75% 75% many exhibitors which ensures an exclusive theatrical release window of 17-
31 days with revenue sharing agreements in place for PVOD revenues
− Typically, theatres make 85% of their revenue in the first 3 weeks
after release, a dynamic structure will ensure that profitable movies
2015 2016 2017 2018 2019 remain in theatres longer
Gross Box Office Revenues (C$ mm) • Cineplex’s market share, online TVOD, PVOD store and SCENE program
provide a differentiating relationship with studios
Cineplex Box Office Market Share (%)
• Pre-COVID Canadian box office revenue has remained stable despite Movie Revenue Contribution by Week(2)
pressures from streaming services and direct-to-home offerings
First
First Week Week ofFirst
of Release Release
Week of Release Second
Second Week Week
of Releaseof Release
Second ~85%ofofRelease
Week revenue earned
• Cineplex has continued to grow its box office revenues by focusing on Third Week of Release
Third Week of Release
Third Week of Fourth
ReleaseWeek or Later
Fourth WeekFourth
or Later
Week orinLater
first 3 weeks
increasing revenue per patron through a focus on premium theatre
100% 100% 100%
formats and expanded food service offerings 80% 80% 80%
− In 2019, premium theatre formats made up 42% of box 60%office
60% 60%
revenues
40% 40% 40%
20% 20% 20%
0% 0%
1999 0%
2006
2013
1998
2000
1999
1998
2001
2002
2000
2003
2001
2004
2002
2005
2003
2004
2007
2005
2006
2008
2009
2007
2010
2008
2011
2009
2012
2010
2011
2014
2012
2013
2015
2016
2014
2017
2015
2016
2017
1999
2006
2013
1998
2000
2001
2002
2003
2004
2005
2007
2008
2009
2010
2011
2012
2014
2015
2016
2017
1. Canadian gross box office revenues include taxes charged. Market share data based on net box office revenues, which exclude taxes.
2. Source: StephenFollows.com; Originally sourced from Box Office Mojo, The Numbers and IMDb.
© Cineplex Inc. Not to be distributed, reproduced or used without permission. 9
Upcoming Film Slate / Outlook

                         Pipeline of Selected Upcoming Titles                                     Pent-up Consumer Demand
 • Many highly anticipated films that were scheduled for an early               • Canadians are looking forward to resuming a number of activities
   2020 release have been delayed until 2021                                      post-COVID
      − Strong product pipeline for theatres in the near / medium-              • Cineplex expects significant pent-up demand as the nationwide
          term                                                                    reopening effort continues
 • Cineplex is optimistic that the industry will recover over time as                − Cineplex believes that consumer demand for the theatrical
   consumer demand for the theatrical experience, combined with a                       experience and a backlog of anticipated releases will drive
   build-up of anticipated releases of strong film content, will help                   visitation
   drive visitation as people look to return to normalcy
                                                                                     − The Company also expects demand for LBE activities to
                                                                                        increase as people seek out-of-home experiences that have
                                                                                        been restricted
                                                                                • Theatres have historically fared well during periods of economic
                                                                                  hardship; the Company believes the industry will benefit from
                                                                                  pent-up social demand as people look for a return to normalcy
                                                                                     − Theatres and LBE outings provide an outlet for affordable
                                                                                        out-of-home entertainment
                                                                                     − A recent national omnibus survey(1) found that the #1 most
                                                                                        missed activity by Canadians during the pandemic was going
                                                                                        to the movies
                                                                                              ▪ Missed by 53% of Canadians surveyed

 1. Source: Abacus Data; National Omnibus Survey of 1,500 Canadians.
© Cineplex Inc. Not to be distributed, reproduced or used without permission.                                                   10
Section 3: Company Overview
Business Overview & Strategy

                           Diversified Business Segments                                                           Corporate Strategy

                                   Theatre
                                                                                              ✓ Continue to enhance and expand Cineplex’s presence as
                                                            Alternative
                                    Food
                                                           Programming
                                                                                                  an entertainment destination for Canadians in-theatre,
                                   Services                                                       at-home and on-the-go
                      Theatre                 Film                         Digital            ✓ Capitalize on our core media strengths and infrastructure
                     Exhibition          Entertainment                    Commerce
                                                                                                  to provide continued growth of Cineplex’s media
                                       and Content (57%)
                                                                                                  business, both inside and outside theatres

                                                                                              ✓ Develop and scale amusement and leisure concepts by
                                                                                                  extending existing capabilities and infrastructure
                                                SCENE
      Amusement                                 Loyalty                              Cinema
       Solutions                                                                      Media   ✓ Drive value within businesses by leveraging opportunities
                         Amusement
                                                                    Media                         to optimize value, realize synergies, implement customer-
                         and Leisure
                            (9%)
                                                                    (34%)                         centric technology and leverage big data across the
           Location                                                                Digital
                                                                                                  Cineplex ecosystems
             Based                                                              Place-Based
         Entertainment                                                             Media      ✓ Short term focus on continued operational and cash flow
                                                                                                  management
    Percentages above represent 2019 EBITDAaL (excl. Corporate & Other) split by division

© Cineplex Inc. Not to be distributed, reproduced or used without permission.                                                              12
Film Entertainment and Content – Box Office
Segment Description Location Overview
• Largest motion picture exhibition company in Canada Operates 1,667 screens in 162 theatres across Canada
• Operates modern multiplex theatres in major metropolitan and
mid-sized markets BC NL 3
AB
• Premium viewing options offer more immersive viewing 24 SK
19 MB QC
experiences through special screen, seating and auditorium PE
features; options include: 6 ON
5 18 2
68
NB NS
# Number of Locations 5 12
Box Office Revenue (C$ mm) Box Office per Patron (C$)
From 2015 to 2019, premium experiences(1) as a percentage of box
office revenue increased from 39% to 42%
$10.17 $10.46 $10.63 $10.17
$9.84
$734 $716 $724 $706
74.6 70.4 69.3 66.4 $133
13.1
2016 2017 2018 2019 2020 2016 2017 2018 2019 2020
Theatre Attendance (Millions)
1. Premium experiences include 3D, 4DX, UltraAVX, IMAX, ScreenX and VIP.
© Cineplex Inc. Not to be distributed, reproduced or used without permission. 13Film Entertainment and Content – Theatre Food Service & Digital Commerce
Food Service Overview Digital Commerce Overview
• Highly diversified product offering consisting of proprietary and
third-party brands
• Integrated loyalty program with targeted promotions to drive sales • Online ticketing and showtimes,
exclusive entertainment content
• Liquor offered at 91 locations and home delivery service via Uber
Eats and/or Skip the Dishes offered at 148 locations(1) • Advertising and digital commerce
opportunities
• Select Partnerships:
Cineplex.com
• Provides entertainment content
before the show
Theatre Food Service Revenue (C$ mm) • Mobile ticketing – no lines, touchless
entry
$441 $447 • Mobile food ordering at VIP Cinemas
$421 $422 Mobile App
$6.73 $6.99
$5.65 $6.00 $6.36 • Buy, rent and download digital movies
$100
(TVOD, PVOD)
• At home and on-the-go viewing
• SCENE members earn and redeem
2016 2017 2018 2019 2020 points
Concession Per Patron (C$) Cineplex Store
1. Home delivery service offered at 140 theatres and 8 Rec Room locations.
© Cineplex Inc. Not to be distributed, reproduced or used without permission. 14Media
Extensive Portfolio of Cinema Media Assets Digital Place-Based Media Overview
• On-screen advertising: Show-Time and Pre-Show • Full-service, digital place-based ecosystems based on experiential
• Cineplex.com and Cineplex App/Mobile advertising technologies
• Digital Lobby: Digital Posters and Digital Lobby Screens • Revenue streams include: technology licensing, network
management, creative services, advertising sales, design and
installation
• Primarily service quick service restaurants, financial, retail and
shopping mall & concourse clients
Media Revenue (C$ mm)
$197
$167 $167 $163
$81
$57 $56 $56
$65 Digital Out of Home Quick Service Restaurants
$109 $112 $107 $115 $42
$24 Financial Retail
2016 2017 2018 2019 2020
Cinema Media(1) Digital Place-Based Media
1. Cinema Media includes revenue for Cineplex Magazine which has been discontinued.
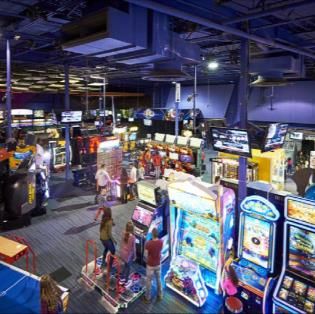
© Cineplex Inc. Not to be distributed, reproduced or used without permission. 15Amusement & Leisure
Amusement Solutions Division Overview Location-Based Entertainment Division
• Through its subsidiary, Player One Amusement Group, operates • Amusement gaming, live
one of the top amusement solutions companies in North America entertainment, feature
• With 21 offices in Canada and the U.S., provides comprehensive attractions and dining
sales & distribution, merchandising & consultation, and parts and experiences
services to over 500 customers
• Large attractions area, bar,
• Also supplies arcade equipment to Cineplex theatres, The Rec
Room and Playdium auditorium-style space for live
entertainment and casual and
upscale dining
• Target: Millennials and baby
Amusement Revenue (C$ mm) boomers with kids, and groups
• Large entertainment complexes in
$228 mid-sized communities across
$205
$185 Canada
• Indoor play, fun and fresh food
$100
$78 and modern, technology-
enhanced amenities
• Target: Teens, their friends and
2016 2017 2018 2019 2020 family
© Cineplex Inc. Not to be distributed, reproduced or used without permission. 16Section 4: Business Highlights
Business Highlights

                       Proactive Liquidity Management

                                 Leading Box Office Market Share and Diversity of Markets Across Canada

                                    Diversification of Business and Revenue Streams

                                    Extensive Portfolio of Media Assets

                                 Leading Customer Loyalty Program

                       Experienced Management Team

© Cineplex Inc. Not to be distributed, reproduced or used without permission.                             18
1 Proactive Liquidity Management
Minimization of Cash Burn ($mm) Liquidity Optimization ($mm)
Costs of Operations (1) 2019 2020 Q4 2020 Cash Balance $16
Q4 2020 Undrawn Revolver Capacity $154
$393 $381 $407 SLB of Headquarters Proceeds $57
Less: Permanent Paydown of Credit Facilities ($28)
Total Liquidity $199
$129 $136 $141
Incremental Liquidity
Anticipated CRA Tax Refund $66
Q2 Q3 Q4 Estimated net liquidity from second lien secured notes offering (2) $144
Total Incremental Liquidity $210
Total Pro Forma Liquidity $409
• Cost structure rapidly downsized in response to COVID-19 operating restrictions • Notable liquidity enhancing measures completed:
• Broad range of cost and expenditure reductions, including: − Issuance of $316.25mm in new convertible debentures
− Employee layoffs and voluntary salary reductions (Q2 and Q3 2020) − Enhanced SCENE partnership agreement for $60 mm in gross proceeds
− Reduction of non-essential operating and capital expenditures with FY2020 − Sale and leaseback of head office for $57 mm in gross proceeds
net capex of $49 mm vs $132 mm for FY2019 • Incremental sources of liquidity:
− Suspension of dividend payments resulting in savings of ~$9.5 mm per − CRA tax refunds expected in early 2021 in the amount of ~$66 mm
month − Seeking to raise an additional $250 mm in gross proceeds through a second
− Participation in government wage subsidies resulted in the receipt of lien secured notes offering which will increase liquidity by ~$144 mm
approximately $57 mm in subsidies by the end of FY2020 • Bank Covenant relief:
− Materially reduced net cash lease outflows by approximately $72.5 mm to − Suspension of financial covenant testing until Q4 2021
date through negotiations with landlords
− Monthly liquidity testing and restriction on distributions during covenant
relief period
− Growth capex to be subject to a total leverage covenant
1. Represents total costs included in Net Income from Continuing Operations adjusted to add back impairment of long-lived assets, goodwill and investments of $65.6 mm and $56.2 mm in Q3 2020 and Q4 2020, respectively.
2. Assuming $250 mm in gross proceeds raised.
© Cineplex Inc. Not to be distributed, reproduced or used without permission. 192 Leading Box Office Market Share and Diversity of Markets Across Canada
2
Box Office Market Share (as at 31-Dec-2019) Cineplex Box Office Market Share Over Time(1)
2% 78% 78% 77% 75% 75%
11% Cineplex
12% Landmark
Other
75% Guzzo
2015 2016 2017 2018 2019
Diversified Provincial Exposure
(# of Locations by Province)
Ontario: 68
• A key component of Cineplex’s business strategy is to position itself
20% British Columbia: 24
as the leading exhibitor in the Canadian market by focusing on
Operations providing customers with an exceptional entertainment experience
in all 42%
Canadian 11% Alberta: 19 • Cineplex’s leading market position enables it to effectively manage
provinces film, food service and other theatre-level costs in order to maximize
12% Quebec: 18
operating efficiencies
15% Other: 33
Largest and most successful motion picture exhibition company in Canada
1. Source: Rentrak; based on Canadian industry box office revenues.
© Cineplex Inc. Not to be distributed, reproduced or used without permission. 203 Diversification of Business and Revenue Streams
Revenue Mix – Then and Now Growth Drivers
2015 2019 • Expansion of premium theatre experiences
2% 3% 3% • Alternative programming including classic films, sports
events, and live experiences
Box Office Box Office
11% 14%
Food Service
42% • Expanded food offerings through development of
12% Media(1)
53% proprietary brands and QSR partnerships
31% • Increasing number of locations in AB, ON and MB having
Amusement liquor licenses
29%
Other • Home delivery through Uber Eats and Skip the Dishes
Food Service
• High impact cinema advertising
• Focus on diversifying its business beyond traditional movie exhibition • Online advertising on Cineplex.com and mobile app
model has resulted into shift in revenue mix to other revenue sources • Expansion of digital place-based media offerings in
restaurants, financial centres and retail locations
• Strong growth in Media and Amusement & Leisure businesses Media
continues to reduce dependence on film studio content and reduce
seasonality in business results • Expansion of the number location based entertainment
locations (Rec Room, Playdium)
• Diversification in revenue streams provides protection from • Growth in third party amusement volumes through Player
competitive pressures facing the film and entertainment business Amusement & One Entertainment Group subsidiary
Leisure
Diversification of revenue streams continues to drive growth and reduces company risk profile
1. Media includes revenue for Cineplex Magazine which has been discontinued.
© Cineplex Inc. Not to be distributed, reproduced or used without permission. 214 Extensive Portfolio of Media Assets
À la carte menu of media options with integrated cross-channel campaigns and deep market penetration
Digital Place Based Media Cinema Media
Canadian Cinema Show-Time
Equals Ad Effectiveness
Cineplex reaches • Banners, Wraps On-screen
and Decals
over 480 million
shoppers annually • Interior Vehicle
advertising across 65% 84% 37% Showtime
Displays
Canada’s largest Advertising Correct Brand Likability
over 53 locations movie theatre Awareness Association
across Canada • Digital Posters
Shopping Centres network with the Canadian Cinema Pre-Show Equals
Ad Effectiveness
lowest ad
avoidance of all
media
59% 85% 41%
More than 884K Advertising Correct Brand Likability
Awareness Association
consumers are exposed to
Cineplex concourse
Concourses
screens daily Digital Signage Cinema Lobby
• Digital Posters
50%
Of customers
• Digital Lobby Screens able to recall
• Interactive Media Zones digital signage
or screen
Cineplex offers an array of
options including Video
Boards, Wraps, and Screens
3.5
MILLION
Travelers per Year
6.8
Average
monthly
M
Mobile advertising on
Cinplex.com and Cineplex
Mobile app, one of
20 M
at 20 ONRoute locations unique
Cumulative
Stop at OnRoute Service
Centres
visitors to Canada’s most popular mobile app
downloads
Cineplex
ONRoute Website mobile brands
Extensive media portfolio with tremendous reach across a wide breadth of media channels
© Cineplex Inc. Not to be distributed, reproduced or used without permission. 225 Leading Customer Loyalty Program
5
SCENE Overview Competitive Advantages
• Canada’s top loyalty program for movie lovers with over 10 million
members ✓ Drives theatre attendance frequency
• Leader in loyalty program member satisfaction in Canada
• Members are represented in 45% of Canadian households ✓ Encourages concession spend
• One in four Canadians are SCENE members
• In late Dec 2020, announced enhanced partnership with Scotiabank on ✓ Better target offers to guests
SCENE loyalty program and concurrent three year extension of
partnership with Recipe Unlimited Corporation ✓ The Rec Room and Playdium: Encourages spend on food and
beverage, gaming and entertainment
Number of SCENE Members (mm)
✓ Cineplex Store: Builds awareness and promotes trial
10.3 10.4
8.1 8.9 9.6 ✓ Great opportunity for film studios and promotional partners
✓ Marketing automation platforms
✓ Valuable data and insight
2016 2017 2018 2019 2020
Leading loyalty program helps drive increase customer spend and provide valuable customer insight via data analytics
© Cineplex Inc. Not to be distributed, reproduced or used without permission. 236 Experienced Management Team
6
Ellis Jacob Anne Fitzgerald
President and Chief Executive Officer Chief Legal Officer and EVP, Real Estate
• Assumed position in 2003; previously served as Chief Executive • Director at the Academy of Canadian Cinema and Television,
Officer and co-founder of Galaxy the Movie Theatre Association of Canada and the National
• Director at the Toronto International Film Festival Group, the Association of Theater Owners
Movie Theatre Association of Canada and the National • Member of the Executive Committee of the Global Cinema
Association of Theater Owners Federation
• 30+ years of industry experience • 15+ years of industry experience
Dan McGrath
Kevin Watts
Chief Operating Officer
EVP, Exhibition and LBE
• Assumed position in 2011; previously served as Executive Vice
• Assumed position in 2020; previously served as Senior Vice
President of Galaxy
President, Exhibition, Vice President, Film and Vice President,
• Director at SCENE and the Movie Theatre Association of
Operations
Canada
• 25+ years of industry experience
• 30+ years of industry experience
Fab Stanghieri
Gord Nelson
EVP and Managing Director, Media
Chief Financial Officer
• Assumed position in 2018; previously served as Senior Vice
• Appointed Chief Financial Officer of Cineplex Galaxy Income
President, Business Development, Account Services and
Fund in 2004 and continued in this role following the
Marketing
Company’s conversion to the Corporation in 2011
• One of the founders of EK3, which was acquired by Cineplex in
• Named Canada’s CFO of the Year for 2016
2013 and renamed Cineplex Digital Media
• 30+ years of industry experience
• 25+ years of industry experience
Highly experienced management team with over 150 years of combined industry experience
© Cineplex Inc. Not to be distributed, reproduced or used without permission. 24Section 5: Historical Financial Summary
Revenue and Adj. EBITDAaL

                                          Revenue (C$ mm)                                                               Adj. EBITDAaL (C$ mm)

                                                                                                                                                    (2)
                                                                             $1,665                                                 $247        $242
                                                     $1,612                                                  $223    $225
                             $1,550
     $1,470                                           $44                     $51
                               $40                    $163                    $197
      $38                     $167
      $167                                                                                                   15.2%                 15.3%
                              $185                     $205                    $228                                  14.5%                      14.5%
      $100

     $1,165                  $1,157                  $1,200                  $1,189              $418
                                                                                             $65 $34
                                                                                                 $78                                                      ($179)(2)
                                                                                                 $241
     2016          2017          2018      2019          2020                                                2016    2017            2018        2019     2020
                                                     (1)
     Box Office and Food Service    Amusement   Media      Other                                                             Adj. EBITDAaL Margin (%)

 1. Media includes revenue for Cineplex Magazine which has been discontinued.
 2. 2019 and 2020 adj. EBITDAaL excludes Cineworld transaction costs of ~C$12 mm and ~C$4 mm respectively.
© Cineplex Inc. Not to be distributed, reproduced or used without permission.                                                                      26
Capex and Free Cash Flow
Net Capex (C$ mm) Simple Free Cash Flow (C$ mm)(1)
$167 $152
$124 $110(2)
$132 $58 61.5%
55.5% 45.4%
25.7%
$99 $95
$49
10.8% 11.7%
6.8% 5.9% 8.0% (2)
($228)
2016 2017 2018 2019 2020 2016 2017 2018 2019 2020
% Revenue Free Cash Flow Conversion (%)
1. Simple free cash flow equal to adj. EBITDAaL less capex; free cash flow conversion equal to simple free cash flow as a percentage of adj. EBITDAaL.
2. 2019 and 2020 simple free cash flow excludes Cineworld transaction costs of ~C$12 mm and ~C$4 mm respectively.
© Cineplex Inc. Not to be distributed, reproduced or used without permission. 27Financial Policies
• Cineplex has historically operated with modest leverage
Leverage − 2018 and 2019 Debt / Adjusted EBITDAaL of 2.3x and 2.6x, respectively
• Post resumption of full operations, Cineplex will target run-rate leverage of ~2.5x
• Strong free cash flow supported a consistent monthly dividend to Cineplex’s shareholders
− Over the past 5 years, payout ratio ranged between 60 – 70%
Dividend Policy • Management committed to deleveraging post resumption of operations and will evaluate the payment of dividends
based on anticipated free cash flows
− Existing bank credit facility agreement restricts dividends until Total Leverage, on an LTM basis, is below 2.75x
• Reduction in near term capex with focus on maintenance capex only
Capex − Existing bank credit facility agreement restricts growth capex until Total Leverage, on an LTM basis, is below
2.75x
Prudent financial policies developed and implemented by management team
© Cineplex Inc. Not to be distributed, reproduced or used without permission. 282020 Full Year Results
In C$ millions, except adjusted EBITDAaL margin and per patron amounts
FY2020 FY2019 %
Box Office $132.8 $705.5 (81.2%)
Food Service $108.6 $483.3 (77.5%)
Media(1) $65.4 $196.8 (66.8%)
Amusement $77.9 $228.2 (65.9%)
Other $33.6 $51.3 (34.6%)
Total Revenue $418.3 $1,665.1 (74.9%)
Adjusted EBITDA(2) ($51.8) $417.5 NM
Adjusted EBITDAaL(2) ($178.7) $242.3 NM
Adjusted EBITDAaL Margin (42.7%) 14.5% (57.3%)
Theatre Attendance 13.1 66.4 (80.3%)
BPP $10.17 $10.63 (4.3%)
CPP $6.99 $6.73 3.9%
1. Media includes revenue for Cineplex Magazine which has been discontinued.
2. 2019 and 2020 adj. EBITDA and EBITDAaL exclude Cineworld transaction costs of ~C$12 mm and ~C$4 mm respectively.
© Cineplex Inc. Not to be distributed, reproduced or used without permission. 29You can also read