TRENDS - 2021 Real Estate Investment HENRY S. MILLER COMPANY
←
→
Page content transcription
If your browser does not render page correctly, please read the page content below
HENRY S. MILLER COMPANY

                                     2021
 Real Estate Investment

                                              TRENDS
          Methods Change. Principals Endure. Service and Integrity Since 1914.

5151 Belt Line Rd., Suite 900 | Dallas, TX | 75254 | 972.419.4000 | henrysmiller.com | Social Media: @hsmcompanies
BROKERED

Methods Change.
Principles Endure.
Service and Integrity since 1914.

Brokerage - All Property Types          DEVELOPED & SOLD
• Commercial Sales
• Land Sales
• Investment Sales
• Commercial Leasing
• Tenant Representation
• Business Brokerage

Consulting
• Commercial Appraisals
• Market/Feasibility Studies
• Cash Flow Modeling                          APPRAISED

Development
• Single-Family Subdivisions
• Multi-Family
• Commercial
• Industrial
• Mixed-Use

Property Management
• Commercial Management Supervision
• Construction Management
                                              APPRAISED
• Budgeting, Forecasting & Accounting

Investment Partners
• Syndication
• Mortgage Banking
• Asset Management
• Equity Partnerships

henrysmiller.com
Greg Miller
President & CEO
Henry S. Miller Companies
2020 was a life-changing year. Around this time last year, the U.S. was Retail real estate was hurt the most by the pandemic. We have a large
enjoying the longest economic expansion in history. The rapid escalation portfolio of shopping centers and spent much of the year negotiating
of the coronavirus pandemic brought it to an abrupt halt. No one could rent deferral programs for struggling tenants. In general, we agreed to
have imagined just how weird the world would become over the course defer a few months of rent or more to be paid back over a period of time.
of a year. In some ways, it will never be the same.
Some retailers were hit harder than others, such as fitness and
The pandemic caused millions of deaths and historic job losses. Life entertainment centers. Essential businesses thrived, such as grocers
came to a standstill with lockdowns, quarantines, remote working, and home improvement stores. Online sales increased dramatically at
school closures and reduced gatherings. Who can forget the countless the beginning of the pandemic. Conversely, in-store sales increased
Zoom calls, hoarded paper products and hand sanitizer and wearing as restrictions eased. The U.S. Census Bureau reports that a record
masks? Entertainment, sports and other live events, tourism, airlines, $788 billion was spent online in 2020, a 32% increase over 2019. Total
hotels and most restaurants were decimated. Fortunately, vaccines annual retail sales (excluding auto, gas and restaurants) grew by 6.4%
were generated in record time. over 2019 to $4 trillion.
Remember the wildfires? The year began with the Australian bushfires, The International Council of Shopping Centers predicts that 62% of
which raged for 80 days, killing and harming nearly three billion animals, all online orders will be fulfilled in physical stores in 2021. Despite
and the west coast wildfires became the largest in California’s history. ever-increasing e-commerce, 80% of all sales occur in physical stores.
Successful retailers must continue to increase their omnichannel sales
Another historic event occurred when oil prices went negative for the
capabilities to supplement their growing online business.
first time ever with producers actually paying traders to take oil off their
hands. In a stunning reversal, the 2020 bear market ended in August Also according to the U.S. Census Bureau, the population growth in Texas
when the S&P 500 exceeded previous highs. With trillions of dollars in over the last decade far surpasses that of any other state. Furthermore,
stimulus response, markets recovered in record time. Texas’ population is one of the youngest in the Union. This is good news
for the residential market, because this is the highest demographic for
Finally, thousands of Black Lives Matter protests raged across the
apartment renters, and they will begin purchasing homes in the coming
country following the death of George Floyd. The year ended with a
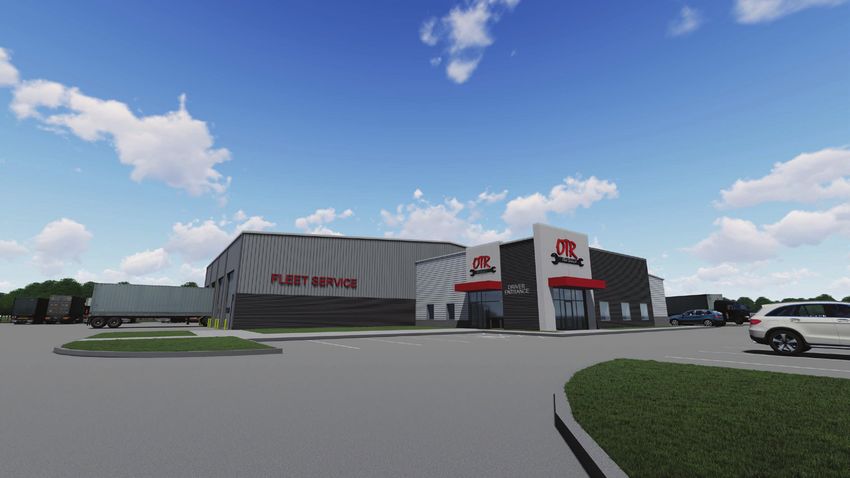
years. Accordingly, we’re investing heavily in residential real estate, with
tumultuous presidential election with the results called into question
several new single-family lot developments, a senior housing project
by President Trump. If 2020 was the year from hell, in 2021 hell froze
and a multifamily apartment project underway.
over, beginning with an unprecedented riot at the Capitol followed by a
massive and devastating winter storm. We’re fortunate to live in the great state of Texas. We remain the
premier state for doing business, as evidenced by all the corporate
relocations. Tesla, Oracle, Hewlett Packard and CBRE, just to name a
Henry S. Miller Company: Resilient and Bullish few, have recently moved their headquarters to Texas. Our measured
History has proven that the U.S. economy is amazingly resilient to horrific approach to the pandemic appears to be the right one. We’re at the
events such as those that occurred during the past year. According to beginning of the end of the pandemic and our economy is poised to take
ITR Economics, the recovery of the economy is progressing nicely - off. With one party in control of the executive and legislative branches
consumers are happy and businesses are buying capital equipment. of the U.S. government, things could become difficult on the national
However, there are concerns that excessive government stimulus level. However, take comfort in the fact that Texas, if it were a nation,
spending will cause runaway inflation in the future. would be the world’s ninth largest economy based on GDP as reported
by the Texas EDC.
There were lots of winners and losers in the pandemic. Industrial
benefitted the most with the dramatic increase in e-commerce. Costar Great things are happening at Henry S. Miller Company. Please consult
reports that the industrial market is very tight with low vacancies and with a Henry S. Miller agent to learn more!
increasing rents. Demand for distribution logistics space is at an all-
time high. More and more warehouse space is needed closer to the
consumer. As a result, Henry S. Miller Company has begun developing Greg Miller
more industrial projects. Greg Miller is Chief Executive Officer and President of Henry S. Miller
The office market is struggling and may take years to recover as Companies, a family of companies that includes a full array of commercial
employees continue to work remotely until they have to return to work. real estate services. Greg has extensive working experience involving
Many Texas office buildings were already hurting with the struggling oil the acquisition, financing, development, leasing and disposition of
and gas market. Available office space is near record highs according to millions of square feet of commercial real estate. As former President
Costar. While the office working environment may undergo fundamental of Miller Realty Investment Partners and HSM Equity Partners, Greg
changes, not everyone can work from home and office amenities and supervised the acquisition and structuring of commercial real estate
networking opportunities cannot be duplicated at home. transactions for the Henry S. Miller investment portfolio, including
office, multi-family, retail, hotel and industrial properties throughout the
Dallas-Fort Worth area, Texas and the United States.
2021 Real Estate Investment TRENDS henrysmiller.com
EXECUTIVE LEADERSHIP TEAM
             EXECUTIVE BRANCH                                                                       EQUITY PARTNERS

Greg Miller       Robert DuBois          Geraldine “Tincy” Miller                   Jim Brownlow        Darrell Hurmis   Mark Smith
President & CEO   CFO                    Chair Lady                                 Sr. VP / Managing   EVP              Sr. VP /
                                                                                    Partner, Capital                     Commercial
                                                                                    Markets                              Development

                            BROKERAGE                                                 APPRAISAL / CONSULTING
Corporate                                Investments/
Services          Industrial/Office      Land               Retail

Dan               Dan Spika              Darrell Hurmis    Frank Bullock                     Craig Christensen
Polanchyck        EVP/Principal          EVP/Principal     EVP                               EVP
EVP

                  DEVELOPMENT                                        PROPERTY MANAGEMENT                      FRANCHISE OFFICES
Commercial         Multi-Family            Single-Family                                                Houston          San Antonio

Mark Smith         William “Bill” Bush     Steve Donosky                   Shelton Weeks                Shawn Ackerman   Keith Coelho
Sr. VP             Managing                President                       Managing                     Principal        Principal
                   Director                                                Director

                                                                                                                         BUILD TO SUIT

                          2021 Real Estate Investment TRENDS                               henrysmiller.com
TRENDS
The information contained herein represents the results of participants surveyed in the commercial real estate markets of North
Texas for 2021. The respondents include local and national developers, asset managers, loan officers in local and national lending
institutions, brokers, as well as appraisers/consultants, mortgage bankers and individual investors.

CAPITALIZATION RATES
What capitalization rates are being achieved or do you see reflected by the market?
                                                                               Capitalization Rates
                                                                              Current                                                               Reversion
 Property Type           Property Class
                                                      Average                  Low                      High                 Average                  Low                      High
                                  A                    4.40%                   4.25%                   4.75%                   4.92%                  4.25%                   5.25%
 Apartments                       B                    5.30%                   4.75%                   6.25%                   5.64%                  4.75%                   6.25%
                                  C                    6.08%                   5.25%                   7.75%                   6.63%                  5.25%                   7.75%
                                  A                    6.13%                   5.25%                   7.75%                   6.69%                  6.25%                   7.25%
                                  B                    6.89%                   6.75%                   7.25%                   7.31%                  6.75%                   7.75%
 Office
                                  C                    8.31%                   7.75%                   9.25%                   8.69%                  7.75%                   9.75%
                              Medical                  6.75%                   6.25%                   7.25%                   7.31%                  6.75%                   8.25%
                             Anchored                  6.67%                   5.25%                   9.25%                   7.11%                  5.75%                   8.75%
 Retail                    Unanchored                  7.30%                   6.25%                   9.25%                   7.55%                  6.75%                   9.75%
                           Freestanding                6.44%                   4.25%                   7.75%                   6.72%                  5.75%                   7.25%
                                Bulk                   5.75%                   4.25%                   7.25%                   5.88%                  4.75%                   7.75%
 Industrial                 Distribution               6.00%                   4.75%                   7.25%                   6.25%                  5.25%                   8.25%
                                 Flex                  6.80%                   5.25%                   8.25%                   8.25%                  7.25%                   9.25%
                            Full-Service               8.25%                   7.25%                   9.25%                   8.75%                  7.25%                   9.25%
 Hotel                   Limited-Service               9.42%                   8.75%                   9.75%                   9.58%                  8.75%                  10.25%
                             Economy                   8.38%                   4.25%                  10.25%                   9.92%                  9.25%                  10.75%
                              National                 5.25%                   4.25%                   6.25%                   5.88%                  5.25%                   6.75%
 Net Lease
                              Regional                 6.50%                   5.75%                   7.25%                   6.88%                  5.75%                   7.75%
 Credit
                                Local                  7.25%                   6.75%                   7.75%                   7.58%                  7.25%                   7.75%
                              National                 4.75%                      *                       *                    5.25%                  4.75%                   5.75%
 Ground Leases                Regional                 5.25%                      *                       *                    5.75%                      *                      *
                                Local                  7.00%                   6.75%                   7.25%                   7.25%                      *                      *
*Insufficient data responses
Comments:
Hotel: The rate ranges presented for hotels can be misleading in current times. If cap rates are applied to pre-pandemic NOI’s, then rates are 100 to 300 basis points higher than 2019.
If applied to 2020 or TTM 2021 NOI, rates are in the range of 1% to 5% particularly if the property was impacted by mitigation efforts. If applied to the forecasted stabilized NOI, a rate
consistent with pre-pandemic rates are seen. Reversionary rates are from 0 to 150 basis points higher than current.
Distribution: Amazon Warehouse in Houston was 4.5%
Restaurants: McDonald’s and Starbucks can achieve sub 4% cap rates

REQUIRED LAND YIELDS
What are your IRR requirements for the following?
                                                                Yields for Land
                                                           Leveraged Equity Rates                           Unleveraged Equity Rates
 Property Type                                          Avg         Low         High                      Avg         Low         High
 Residential Lot Development                         18.83%           10.00%           30.00%           12.92%            7.00%           20.00%
 Speculative Land Purchase                           21.00%           12.00%           30.00%           16.43%           10.00%           30.00%

                                      2021 Real Estate Investment TRENDS                                                    henrysmiller.com
DISCOUNT RATES
What leveraged yields or discount rates do you see reflected by the market?
                                                        DISCOUNT RATES
                                                    Range                                                            Range
Property Type   Property Class    Average                          Property Type   Property Class   Average
                                            Low             High                                              Low            High
                    Class A        7.1%     5.0%            8.0%                       Bulk          7.8%     7.5%           8.0%
Apartments          Class B        7.8%     6.0%            9.0%   Industrial       Distribution     6.4%     5.0%           7.5%
                    Class C        8.5%     7.0%           10.0%                        Flex         7.4%     6.0%           8.5%
                    Class A        7.9%     6.5%           10.0%                     Anchored        7.7%     5.0%           12.0%
                    Class B        8.8%     7.5%           11.0%                    Unanchored       8.5%     5.0%           12.0%
Office                                                             Retail
                    Class C        9.8%     8.0%           12.0%                   Freestanding      7.9%     7.0%           10.0%
                   Medical         8.1%     7.0%           10.0%                    Restaurant       8.4%     5.0%           12.0%
                  Full Service     9.3%     8.0%           10.0%                      National       5.8%     5.5%           6.0%
Hotel           Limited Service    10.3%    9.8%           11.0%   Net Leases        Regional        7.2%     6.5%           8.0%
                   Economy         10.6%    9.8%           12.0%                       Local         8.2%     7.5%           9.0%

                                                    LEVERAGED EQUITY RATES
                                                    Range                                                            Range
Property Type   Property Class    Average                          Property Type   Property Class   Average
                                            Low             High                                              Low            High
                    Class A        11.1%    5.0%           25.0%                       Bulk          9.6%     5.5%           15.0%
Apartments          Class B        12.2%    6.0%           25.0%   Industrial       Distribution     10.3%    5.5%           18.0%
                    Class C        13.8%    8.0%           28.0%                        Flex         10.3%    8.0%           16.0%
                    Class A        11.6%    7.5%           20.0%                     Anchored        12.6%    7.5%           25.0%
                    Class B        12.0%    8.5%           25.0%                    Unanchored      13.70%    8.5%           35.0%
Office                                                             Retail
                    Class C        11.4%    9.0%           15.0%                   Freestanding      12.0%    7.0%           20.0%
                   Medical         10.3%    8.0%           15.0%                    Restaurant       8.4%     5.0%           12.0%
                  Full Service     15.9%    12.0%          25.0%                      National       8.0%     7.0%           9.0%
Hotel           Limited Service    13.8%    13.0%          15.0%   Net Leases        Regional        9.0%     8.0%           10.0%
                   Economy         14.5%    13.5%          16.0%                       Local         10.0%    9.0%           11.0%

                                                UNLEVERAGED EQUITY RATES
                                                   Range                                                             Range
Property Type   Property Class    Average                          Property Type   Property Class   Average
                                            Low             High                                              Low            High
                    Class A        7.1%     4.5%        13.0%                          Bulk          7.6%     4.5%       10.0%
Apartments         Class B         8.4%     5.0%        13.0%      Industrial       Distribution     8.2%     4.5%       12.0%
                   Class C         9.6%     6.0%        15.0%                           Flex         8.8%     6.5%       11.0%
                    Class A        9.7%     7.0%        20.0%                        Anchored        9.3%     6.5%       15.0%
                   Class B         8.8%     7.0%        10.0%                       Unanchored      10.0%     7.0%       15.0%
Office                                                             Retail
                   Class C         9.8%     8.0%        11.0%                      Freestanding      9.7%     5.5%       15.0%
                   Medical         8.6%     6.0%        12.0%                       Restaurant       8.4%     5.0%       12.0%
                 Full Service      9.7%     9.5%        10.0%                        National        7.5%     7.0%           8.0%
Hotel           Limited Service   10.3%     10.0%       11.0%      Net Leases        Regional        8.5%     8.0%           9.0%
                   Economy        11.0%     10.0%       12.0%                          Local         9.5%     9.0%       10.0%

                         2021 Real Estate Investment TRENDS                          henrysmiller.com
REVENUE & EXPENSE EXPECTATIONS
What growth rates do you anticipate for revenue and expenses during the next few years?

                                   REVENUE EXPECTATIONS (RANGE)
Property                   Year 1                         Year 2                             Year 3
Type               Low               High         Low              High              Low               High
Apartments        0.00%             3.00%        1.50%             3.00%             1.50%            4.00%
Office            -5.00%            2.50%        -2.00%            2.50%             0.00%            5.00%
Retail            -5.00%            3.00%        -3.00%            4.00%            -3.00%            5.00%
Industrial        0.00%             5.00%        2.00%             5.00%             2.00%            5.00%
Hotel             -5.00%            6.00%        -2.50%            5.00%             2.00%            5.00%

                                   EXPENSE EXPECTATIONS (RANGE)
Property                   Year 1                         Year 2                             Year 3
Type               Low               High         Low              High              Low               High
Apartments        0.50%             3.00%        0.50%             3.00%             1.00%            3.00%
Office            0.00%             3.50%        0.50%             3.00%             1.00%            3.00%
Retail            -5.00%            3.00%        -5.00%            3.50%            -5.00%            5.00%
Industrial        0.00%             4.00%        0.50%             3.00%             0.50%            3.00%
Hotel             2.00%             3.00%        2.50%             4.00%             2.50%            10.00%

                                            REVENUE AND EXPENSE EXPECTATIONS (AVERAGE)
                                        Year 1                                         Year 2                                        Year 3
Property Type
                           Revenue               Expense                   Revenue                Expense                Revenue              Expense
Apartments                   1.83%                2.00%                     2.39%                     2.29%               2.83%               2.36%
Office                       0.27%                2.15%                     1.20%                     2.28%               2.40%               2.44%
Retail                       0.03%                0.56%                     0.65%                     0.94%               1.32%               1.28%
Industrial                   2.55%                2.17%                     2.90%                     2.11%               3.15%               2.22%
Hotel                        0.50%                2.38%                     1.88%                     2.88%               3.13%               4.38%

THREAT & EXPANSION
What is the greatest threat and enhancement to expansion in North Texas?

    Interest Rates
                                      Greatest Threat to Expansion                                      Greatest Enhancement to Expansion
    Covid Pandemic
    Oversupply                                                                                  Interest Rates
    National Changes Politically                                                                National Changes Politically
    Other                                                                                       Corporate Relocations
                                      27.78%
                                                 25.00%                                                                            80.00%
             22.22%      22.22%

                                                                                                          17.14%
                                                             2.78%
                                                                                                                      2.86%

                             2021 Real Estate Investment TRENDS                                          henrysmiller.com
HOLDING PERIOD
What do you consider to be a reasonable holding (acquisition to resale) period?
Reasonable Holding Period (years)
Property Type YEARS Property Type YEARS
Apartments Avg Low High Industrial Avg Low High
Class A 6.5 3.0 10.0 Bulk 7.5 3.0 10.0
Class B 5.4 3.0 10.0 Distribution 7.0 3.0 10.0
Class C 4.7 3.0 6.0 Flex 6.1 5.0 8.0
Office Retail
Class A 6.2 1.0 10.0 Anchored 5.9 3.0 10.0
Class B 5.5 4.0 8.0 Unanchored 5.8 3.0 10.0
Class C 5.4 3.0 8.0 Freestanding 7.3 4.0 10.0
Medical 7.6 5.0 10.0 Restaurant 7.1 3.0 10.0
Hotel Net Lease
Full Service 7.8 5.0 10.0 National 9.0 7.0 10.0
Limited Service 7.5 5.0 9.0 Regional 8.0 7.0 10.0
Economy 6.4 3.0 8.0 Local 7.3 5.0 10.0
VACANCY AND COLLECTION LOSS
What stabilized vacancy and collection loss percentage do you use when analyzing the following?
Vacancy and Collection Loss
Multi Tenant Loss (%) Single Tenant Loss (%)
Retail Avg Low High Retail Avg Low High
Strip Center 9.43 5.0 20.0 Credit 4.09 0.0 10.0
Neighborhood 8.03 5.0 12.0 Non-Credit 7.16 0.0 20.0
Anchored 7.92 0.0 15.0
Multi-anchor 8.14 0.0 15.0
Office Avg Low High Office Avg Low High
Class A 8.80 5.0 12.0 Credit 3.00 0.0 5.0
Class B 9.89 6.0 15.0 Non-Credit 7.19 3.0 10.0
Class C 11.50 6.0 20.0
Small 8.50 5.0 10.0
Industrial Avg Low High Industrial Avg Low High
Bulk 5.60 0.0 10.0 Credit 2.70 0.0 5.0
Distribution 6.29 3.0 10.0 Non-Credit 7.00 5.0 10.0
Flex 9.21 3.0 15.0
Apartments Avg Low High
Class A 6.17 5.0 7.0
Class B 6.13 5.0 7.0
Class C 6.86 5.0 9.0
2021 Real Estate Investment TRENDS henrysmiller.comREASONABLE MARKETING TIME
What is a reasonable marketing period?
REASONABLE MARKETING TIME (MONTHS)
Property Type MONTHS Property Type MONTHS Property Type MONTHS
Apartments Avg Low High Land Avg Low High Industrial
Class A 3.6 1.0 6.0 Ground Leases 9.2 6.0 12.0 Bulk Warehouse 5.8 2.0 9.0
Class B 3.6 1.0 6.0 Fee Simple Land 11.5 8.0 18.0 Distribution 6.4 3.0 9.0
Other 4.6 1.0 12.0 Flex 8.6 6.0 12.0
Office Retail Hotels
High Rise 9.8 5.0 18.0 Anchored 7.4 3.0 18.0 Full Service 12.7 11.0 15.0
Class A Suburban 8.6 6.0 12.0 Unanchored 9.9 3.0 16.0 Limited Service 11.7 10.0 15.0
Class B 8.8 6.0 12.0 Freestanding 7.0 2.0 12.0 Economy 10.0 6.0 15.0
Class C 10.6 6.0 12.0 Restaurant 8.0 3.0 12.0
*Insufficient data responses
FINISH-OUT COSTS
What are typical finish-out costs per square foot for the following?
FINISH-OUT (PER SQUARE FOOT) OFFICE & INDUSTRIAL
Shell New Renewal
Property Type Avg Low High Avg Low High Avg Low High
Office $54.50 $35.00 $75.00 $38.50 $20.00 $50.00 $12.60 $0.00 $25.00
Office/Medical $82.22 $50.00 $110.00 $43.50 $10.00 $75.00 $13.67 $0.00 $25.00
Industrial Flex $45.00 $15.00 $125.00 $26.31 $5.00 $100.00 $12.06 $0.00 $70.00
Industrial Bulk $34.44 $2.50 $100.00 $22.81 $1.50 $100.00 $9.64 $0.00 $70.00
FINISH-OUT (PER SQUARE FOOT) RETAIL
Shell New Renewal
Property Type Avg Low High Avg Low High Avg Low High
Retail/Anchored $47.33 $20.00 $100.00 $33.85 $0.00 $60.00 $10.33 $0.00 $25.00
Retail/Unanchored $45.00 $20.00 $100.00 $31.33 $0.00 $60.00 $9.59 $0.00 $25.00
Restaurant $84.88 $25.00 $200.00 $68.75 $0.00 $300.00 $17.35 $0.00 $50.00
Cycle and Threat
What is your near-term outlook for the North How will the change in the Administration impact the
Texas CRE market? North Texas CRE market?
NEAR TERM OUTLOOK CHANGE IN THE ADMINISTRATION’S IMPACT
FOR THE NORTH TEXAS CRE MARKET ON THE NORTH TEXAS MARKET
66% Optimistic 31% Decline
29% Neutral 61% Remain Stable
3% Pessimistic 8% Improve
Henry S. Miller Realty Services, LLC is a full service Real Estate Company providing brokerage, leasing, asset and property management, corporate services, investment banking,
development, construction management, consulting and appraisal services. Since 1914, the Henry S. Miller family of companies has been building a reputation on strong leadership,
great integrity and wise investment.
2021 Real Estate Investment TRENDS henrysmiller.comNEW TRENDS FOR ENCLOSED MALLS AND OFFICE BUILDINGS:
HOW IS PROPERTY MANAGEMENT ADAPTING?
By Shelton Weeks
Managing Director
REGIONAL MALLS human interaction. For example, adding multi-family living spaces creates an
urban environment in which people can live, work, shop and play. This option
Have you heard a colleague say, “Malls are dead”? That’s not true. Malls are
especially can sustain and adapt to the evolving demands of an evolving
not dead—they are evolving. They are having new life breathed into them. Malls
society.
have always been a destination, but now they offer amenities, experiences,
and entertainment that together are called “experiential retail.” OFFICE BUILDINGS
As Millennials’ and Gen Zers’ purchasing power has evolved and increased, With work from home becoming commonplace as a result of the 2020 COVID
the traditional department store anchored mall is readapting. While the lives pandemic, property owners and managers have had to adapt and respond.
of these generations are rooted in digital experiences, they still demand and Just like malls, the workplace is evolving. Co-working, the latest approach
enjoy a physical environment in which to interact. Traditionally, malls have to take down large Class A office space floors, has even evolved with new
relied on the department store anchor as their draw. Now, however, they must strategies in response to the pandemic; virtual work-from-home memberships
adapt the vacating big boxes with other uses that complement the destination include the terms flex or hybrid. Floor plans and space design are being
experience, such as motels, self-storage facilities or fulfillment centers. changed to respond to the way we must work in this new socially distanced
society. Large companies are now embracing fully or partially remote teams,
The 2020 COVID pandemic has tested that desire during a time when we all
while still providing a place where distributed teams can meet and collaborate
had to work and play from home…the live, work, play singular environment
physically. Just like mall environments that now combine digital and physical
was tested.
interactions, offices must provide digital and physical workspace.
RETHINKING LONG TERM TACTICS FOR MALLS
Within physical office communities, amenities are important. These include
Property management has had to re-think merchandising strategies in an reliable and fast Wi-Fi; socially distanced conference space; easy access to
environment where so many retail store closures have occurred. For us at parking and transportation; dining options; and outdoor spaces such as patios
Henry S. Miller Co., these closures are an opportunity to provide new pop-up or scenic rooftops that are good for recharging.
retail concepts that enable entrepreneurs to test a market and location before
Finally, integrating coworking and retail in urban areas is yet another approach
committing to a long-term lease. These activations can be an enhancement
for the evolving mall and office building. Those vacated big box retail spaces
to an existing online presence, combining the digital and physical in the
in malls can be backfilled with a new office environment. There are significant
experiential realm. Thus, shoppers/consumers are offered an even more
benefits to the density of occupying space that is both commercial, retail and
diverse selection of retail choices than previously existed. Gone are the days
close to residential areas. To ensure work-life quality, everything needed for
of the mall’s center court with a jewelry store on each corner.
digital and human interaction will remain essential during the next cycle of
So rather than resignedly let properties succumb to the rumor of dead malls, long-term growth and adaptation. This is the new future.
we choose to help them evolve. Other approaches can include exploring
Let our teams at Henry S. Miller help you adapt and evolve as we find your new
alternative uses for a mall site that further address the need for physical
future, and explore new, highest and best uses for your real estate.
PANDEMIC LENGTH
How much longer do you anticipate the Pandemic to adversely impact by property type?
PANDEMIC EFFECT AND REMAINING LENGTH OF ADVERSITY
Property Type Property Type Property Type
Apartments Primary Impact Hotels Primary Impact Net Lease Primary Impact
Class A 0-6 months Full Service 12 - 24 months; up to 42 months National 0-6 months
Class B No Adverse Impact Limited Service 6 -24 months; up to 36 months Regional 0-6 months
Class C No Adverse Impact - 6 months Economy 6 -24 months; up to 36 months Local 6-24 months
Office Primary Impact Retail Primary Impact Ground Lease Primary Impact
Class A 6 - 18 months Anchored 6 - 12 months Class A No Adverse Impact - 6 months
Class B 6 - 12 months Unanchored 6 - 12 months Class B No Adverse Impact - 6 months
Class C 6 - 12 months Freestanding No adverse Impact Class C No Adverse Impact - 6 months
Medical 0 - 6 months Restaurant 6 - 18 months
Industrial Primary Impact
Bulk Positively Influenced
Distribution Positively Influenced
Flex 6 - 12 months
2021 Real Estate Investment TRENDS henrysmiller.comPeople in the Know
The Hot industrial market is all about land, land, land! Online shopping has increased dramatically within the last year due to social
distancing and this is a trend that will remain. Soaring demand for E Commerce and 3rd party Logistics property is overwhelming.
Everyone and their brother would like to jump into the warehouse development business whether they have experience or not.
Cold storage is a hot commodity; particularly specialty foods and niche products. Whereas developers want to do the largest warehouse
Dan Spika, SIOR they can build cold storage is usually found in smaller facilities.
EVP/Principal
Prices PSF on 2nd gen warehouse have soared in the DFW area. $110-140.00 psf is not uncommon. This is for unairconditioned space.
Industrial/ Finding buildings to purchase is impossible. Sellers may want to sell the building they paid $40.00 psf several years ago but there is no
Office Division place for them to move. Companies needing outside storage of a few acres is also impossible to find. Cities don’t like outside storage even
in Heavy industrial zoned areas.
Hot Areas are Forney, Terrell, Haslet, McKinney and Denton and clearly south Dallas. PSF for land prices have doubled!
Industrial will remain at the top along with residential dirt. Very difficult working with understaffed cities while working on Zoom. Office will
clearly lag as many companies will allow people to remain working from home.
The retail sector of commercial real estate in DFW and nationally has been significantly impacted over the past 12 months. The pandemic
caused by the COVID 19 virus has shuttered tens of thousands of retail and restaurant and bar businesses. Coupled with over forty retail
chains filing for bankruptcy both Chapter 7 and 11, including Lord & Taylor, Sears, Brooks Brothers, Pier I, Neiman Marcus, 24-Hour
Fitness, Forever-21, and Payless Shoes, the prospects for backfilling these spaces is bleak. Granted, several of these companies’ futures
were tenuous at best and this ultimate demise was inevitable, the pandemic expedited their closure. It is akin to “shooting the horse
Frank Bullock before it suffers too badly.”
EVP, Retail
The two PPP stimuli are a band-aid, rather than a true economic stimulus. They are a bridge to a hopeful future, nothing more. Time will
Division tell.
There are several concerns for the prospects of a retail recovery in 2022… not 2021… 2022. Primarily, the lost revenue from city, county
and state sales taxes, plus a deviation on the ad valorem taxes due to vacancies and declining rents, will cause these governments to cut
badly needed services to help those greatly affected by closings, layoffs and the pandemic.
Another real concern on the part of users and tenants in retail CRE is governmental uncertainty on future COVID-related closings. Any new
lease negotiated in 2021, will have an extensive “COVID Provision” explaining how rents will be either deferred or abated during a future
shut down. This is something lenders are not fond of including but a necessary evil in a COVID world.
On the bright side, as always, properties with the best locations, even in secondary or tertiary submarkets, will generally out-perform their
competitors in an inferior location (bad access, visibility, parking issues). Location is more important than ever, even more important than
the credit worthiness of the tenants.
Retail generally operates on a seven-year cycle with the exception of grocery, home improvement and automobiles. So landlords need to
grab these retailors early in their life cycle and make hay while the sun is shining.
The pandemic of 2020 obviously affected all phases of every day life and took a toll on the investments and land side of commercial real
estate. Several income properties we had LOI’s or contracts on were withdrawn from buyers concerned of the unknown length of the crisis.
Many purchasers assumed that there would be massive foreclosures on retail and office properties and great deals would be coming
shortly. Luckily, several lenders have been reluctant to overreact and, in most cases, have worked with the owners to prevent taking back
properties and extending the term of the loans.
Darrell Hurmis
2021 has already started with much more activity especially on land properties with single family and multi-family land leading the
Principal /
way. Low interest rates have also prompted the investment purchasers back towards retail properties which have shown resilience or
EVP – Land / (pandemic proof) tenants. Restaurant owners stayed open with curbside and “to go” business to cover overhead. I feel the hardest hit
Investments sector will be office properties. The pandemic forced many companies to have employees work from home and have discovered that they
Division work just as efficiently as if in the office using Zoom conferencing. Office tenants might continue this process in the future when all things
get back to normal resulting in cutbacks on total square footage requirements.
EVP – HSM
Equities As of this article, Moderna, Pfizer and Johnson & Johnson are providing the vaccine to the public and hopefully things will slowly but surely
return to some resemblance of normalcy by the last quarter of the year. If interest rates stay low, I anticipate a wonderful recovery in 2021.
The new political administration will definitely have a say in the future as there are talks of tax and capital gains adjustments. Hopefully,
the changes won’t be too significant – we will wait and see!
HSM Equities Division
We have been very active on the equity side with three projects in 2020. We closed on two single family land properties that we are
developing lots pre-sold to builders and one industrial build-to-suit for a trucking company headquarters. We see tremendous opportunity
in the near future for more of these types of property to purchase and hope to also find opportunities on some income deals.
2021 Real Estate Investment TRENDS henrysmiller.comDALLAS-FORT WORTH
5151 Belt Line Rd.
Suite 900
Dallas, Texas 75254
972.419.4000
CORPORATE OFFICE
HOUSTON
9434 Katy Freeway
Suite 180
Houston, Texas 77055
713.626.2828
SAN ANTONIO
10123 Broadway
San Antonio, Texas 78217
210.821.5323
Methods Change.
Principles Endure.
Service and Integrity since 1914.
TRENDS is published annually by Henry S. Miller Companies. The
information contained herein represents the results of participants
Appraisal & Consulting Staff
surveyed in the commercial real estate markets of North Texas in
First Quarter 2021 reflecting data as of Year-End 2020. Craig Christensen, MAI EVP (35+)
The respondents include: Kyle Dieterich Appraiser (12+)
• local and national developers
• asset managers Blake Gaddy VP (7+)
• loan officers in local and national lending institutions
• brokers Spencer Gerhart Analyst (4+)
• appraisers/consultants
• mortgage bankers
• individual investors The Appraisal & Consulting Division uses this information as a tool
to support the expectations of buyers and sellers based upon data
obtained from the market.
2021 Real Estate Investment TRENDS henrysmiller.comYou can also read