A new method for measuring fabric visual attributes: Wrinkle recovery
←
→
Page content transcription
If your browser does not render page correctly, please read the page content below
Preprints (www.preprints.org) | NOT PEER-REVIEWED | Posted: 19 June 2018                   doi:10.20944/preprints201806.0293.v1

                                 A new method for measuring fabric visual attributes:
                                                 Wrinkle recovery

                                              Ning Pan a,*, Chengwei Lin a and Jun Xu b
                                                 a
                                         Division and Textile and Clothing
              Department of Biological and Agricultural Engineering, University of California at Davis,
                                                 CA 95616, USA
                                  b
                                      College of Clothing, Northwest Polytechnic University
                                                  Xian, Shanxi, 710048, China
                                          *
                                              Corresponding author: npan@ucdavis.edu

             Key Words:       Fabric classification; Fabric wrinkle recovery; PhabrOmeter; Directional
                              and side effects.

                                                               Abstract

             It is demonstrated in this study that PhabrOmeter creates genuine wrinkle on fabrics
             comparable to that in AATCC specifications, and measures fabric wrinkle recovery values fast
             with repeatable and reliable results with high resolution, over wide range of fabric types. It thus
             provides an appealing alternative to the existing test methods that are known to be slow,
             insensitive and unreliable.

             In addition, with enormous varieties of fabrics, we used a new criterion termed fabric linear
             density λ so that fabrics can in general be divided into relatively homogeneous groups for further
             study. The calculation and application of this parameter are showed in this report.

             Introduction
             Wrinkles are ubiquitously common phenomena in natural world and are defined as ‘‘small
             furrows, ridges, or creases on a normally smooth surface, caused by crumpling, folding, or
             shrinking’’[1], and occur over a range of length scales and different types of substrates[1-3].
             Although long being a research topic in textiles[4-8], it was not until more recent years, that an
             increasing interest has emerged on the physics of wrinkling [2, 3, 9, 10] due to mechanical
             instabilities such as wrinkles, creases, and folds observed in such instances as aging of human
             skin [1], the texturing of many citrus fruits[11], and the formation of mountains[12] are just a few
             everyday examples.

                                                                                                                         1

            © 2018 by the author(s). Distributed under a Creative Commons CC BY license.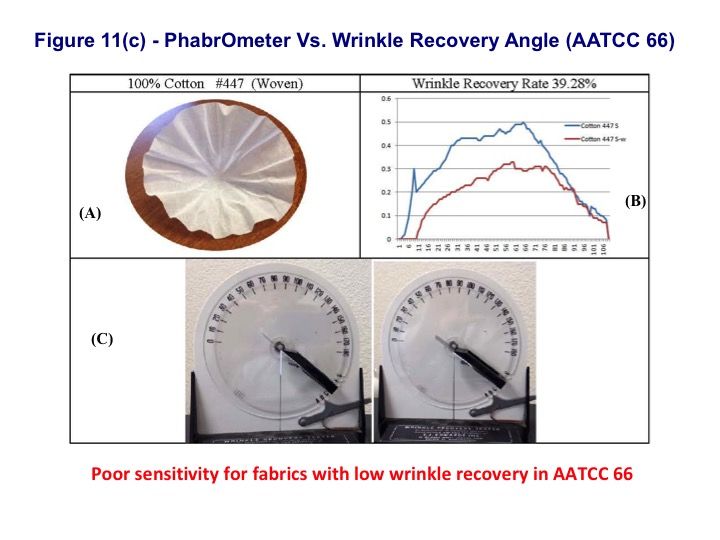
Preprints (www.preprints.org) | NOT PEER-REVIEWED | Posted: 19 June 2018           doi:10.20944/preprints201806.0293.v1

             Wrinkling refers to the loss of the original state, morphologies, shape and appearance of a
             surface due to mechanical instability of the surface and “wrinkling is sensitive to exceedingly
             small initial imperfections that significantly reduce the compressive strain at which the instability
             occurs” [13], the cause for the elusiveness, ubiquity or even mysteries nature of wrinkling.
             Harnessing these instabilities to provide critical insight into the properties of soft materials and
             even as a tool in manufacturing novel soft materials have been the focus of many scientific
             applications [12]. Genzer and Groenewold [1] reviewed the scientific aspects of wrinkling and
             the related issues. Specifically, they discussed how and why wrinkles/buckles form in various
             materials, with several examples from everyday life, demonstrating that wrinkling or buckling is
             indeed a commonplace phenomenon that spans a multitude of length scales. They emphasized
             interestingly that wrinkling is not always a frustrating (destructive) feature, as it can help to
             assemble new structures, understand important physical phenomena, and even assist in
             characterizing chief material properties [1].

             Focusing on textiles where the initial research on wrinkle and wrinkle recovery were conducted
             as early as in 1920s[7], fabric wrinkling is considered one of the most important surface
             appearance properties, and a reflection of the        fabric quality and the aesthetic and visual
             appealing[14].   As wrinkling and its recovery is a perceived attribute, i.e., it is a result of
             interaction between physical, human physiological and psychological factors of both the fabric
             and the observer.

             Visual attributes of textile fabrics represent a sub-group of sensory properties perceived by the
             senses of consumers and include fabric drape, surface state and luster, and, by logical
             extension, the fabric wrinkle recovery. Fabric wrinkle recovery on the other hand is the ability of
             fabric recovery from its wrinkled state – again a very important esthetic feature, and for instance
             the critical improvement in cotton fabric is in its wrinkle resistance or recovery ability [4, 15, 16]
             [17].   It is interesting to note that drape and wrinkle recovery, along with fabric hand, are
             interconnected and determined by the same group of mechanical properties [15] [18], laying
             down a useful foundation for instrumental measurement of them.

             Although there are many occasions where such terms as folding (bending) and wrinkling
             (creasing, crumping) have been used interchangeably, there are nonetheless significant
             differences between them when dealing with textile wrinkling.            In a typical textile fabric

                                                                                                                 2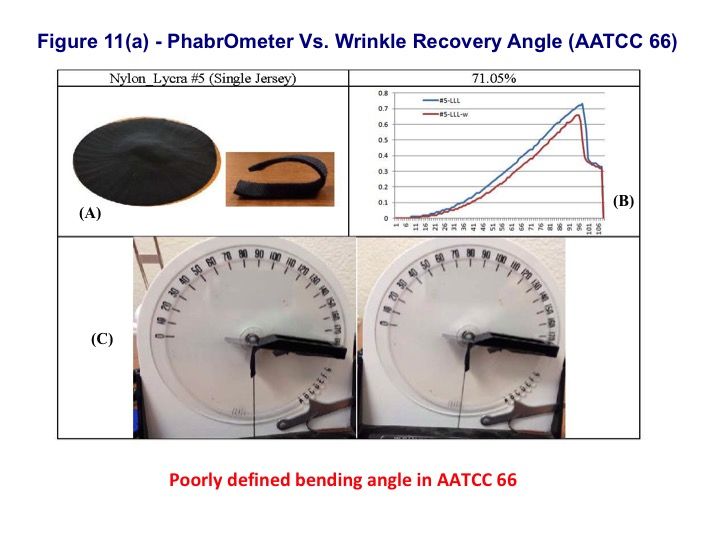
Preprints (www.preprints.org) | NOT PEER-REVIEWED | Posted: 19 June 2018           doi:10.20944/preprints201806.0293.v1

             “f(F)riction forces serve as the only adhesive agent in our clothing to assure, apparently
             contradictorily, both system coherence and inter-component mobility (whether through twisting,
             entangling, interlacing or braiding). Sufficient integrity is thus maintained in the fibrous network
             structures where the seemingly opposing properties including strength, pliability, stretch, body-
             shape conformity are combined harmonically”[19].         This is not true in, for instance, paper
             products.

             As a result, when a piece of fabric is hanging on a rod tip, it drapes or turns into a wrinkled state
             under its own weight (Fig. 1(a)), also reflecting the anisotropy in properties of the fabric due to
             various directional differences [7]. We know this is essential for clothing purpose, as opposed to
             a normal sheet of paper or plastic film that can only bend over on a rod tip (Fig. 1(b)). It is
             therefore critical to differentiate the two phenomena: wrinkle is a multi-curvature deformation
             occurred simultaneously in more than one axial direction, whereas folding describes more
             appropriately the bending deformation of a uniaxial curvature. That is, wrinkling captures the
             inherent anisotropy in fabric performance where as bending or folding are unable to do that.

                                                                                                                 3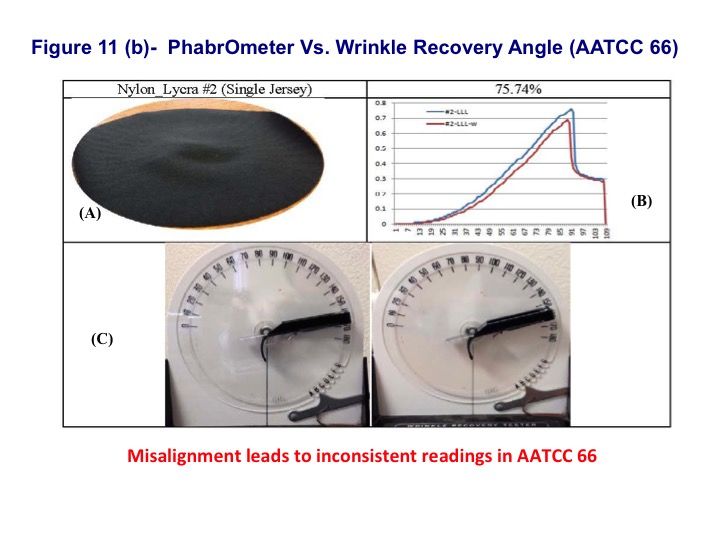
Preprints (www.preprints.org) | NOT PEER-REVIEWED | Posted: 19 June 2018         doi:10.20944/preprints201806.0293.v1

             For such an important quality indicator, accurate measurement of wrinkle behavior of fabrics is
             of both scientific and practical significance. Various new attempts in fabric wrinkle measurement
             have been reviewed and compared by Liu in [8]. This is mainly due to the fact that even the
             physical fabric hand is basically a reflection of the overall fabric quality, attributed to many
             individual fabric properties [20]. However, to separately measure individual fabric properties
             (such as bending, compression, tensile and surface properties) deemed to be associated with
             fabric sensory attributes will destroy the intrinsic connections.

             Testing methods used in this study
             Logically a typical wrinkle test procedure involves 3 key steps: wrinkle generation, wrinkle
             recovery, determination/quantification of the residual deformation in the sample. Also for any
             functional measurement instrument, there are 2 essential requirements: reasonable repeatability
             and sensitivity. For practical industrial uses, easy operation and acceptable cost will be
             important as well.

             There exist two AATCC standard test methods as shown in Fig. 2, i.e., AATCC 66 Wrinkle

                                                                                                               4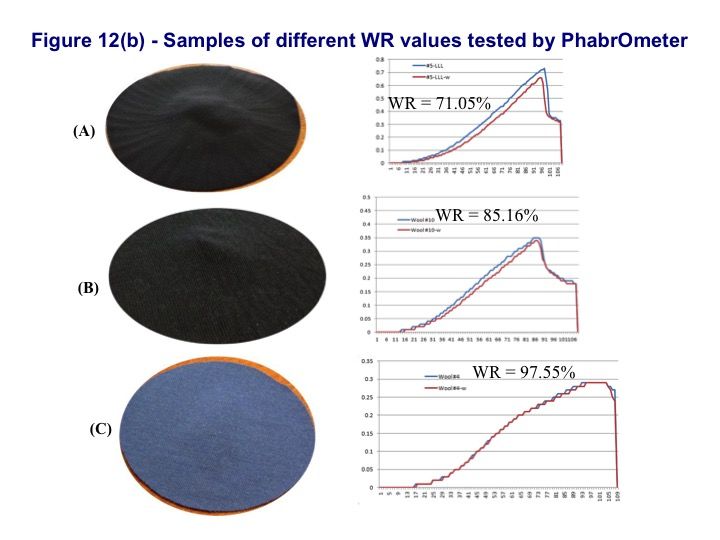
Preprints (www.preprints.org) | NOT PEER-REVIEWED | Posted: 19 June 2018           doi:10.20944/preprints201806.0293.v1

             Recovery Angle [21] and AATCC 128 Wrinkle Recovery of Fabrics: Appearance Method [22],
             and, and the corresponding testing apparatuses. During the use of the two AATCC methods,
             frequent reports have been published in revealing the problems with them, including:

                 1. Poor reproducibility, i.e., multiple tests of the same sample often do not yield reasonably
                     close results [6];
                 2. Low sensitivity - only significant difference in fabric drape can be detected [20];
                 3. Slow and cumbersome test process [20, 23];
                 4. Many fabrics tend to curl and twist when cut into small specimens, and this further
                     affects the reproducibility, and even alters the physical meaning of the test results [16];
                 5. In both tests, the final reading is taken by the operator through visual judgment, thus is
                     prone to subjectivity and bias. Inconsistencies between wrinkle judgments of observers
                     have been widely reported [4, 17], and often the results are severely influenced by the
                     color and the fabric texture [14].      Even though imaging analysis has been [24-28]
                     applied to the test, but it can only improve the analysis of the results, but do little in
                     dealing the problems intrinsic in the test principles.

             In addition, fabric anisotropy is difficult to characterize by AATCC 66 method because multiple
             tests have to be run over all directions[29].

                                                                                                                   5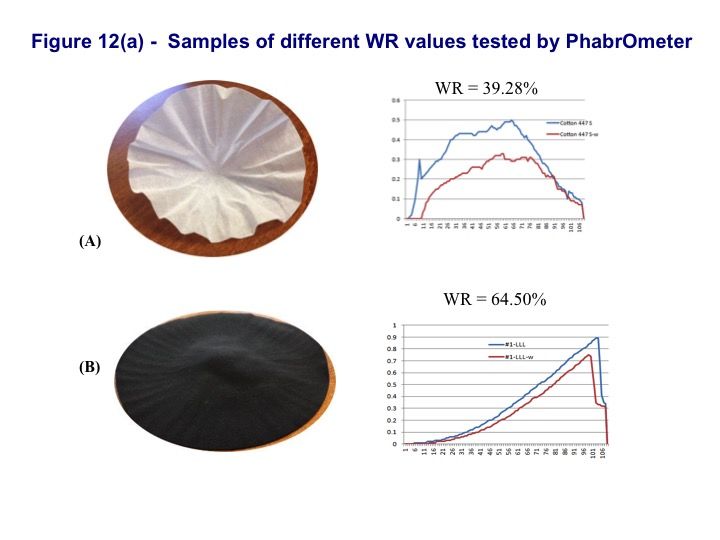
Preprints (www.preprints.org) | NOT PEER-REVIEWED | Posted: 19 June 2018 doi:10.20944/preprints201806.0293.v1
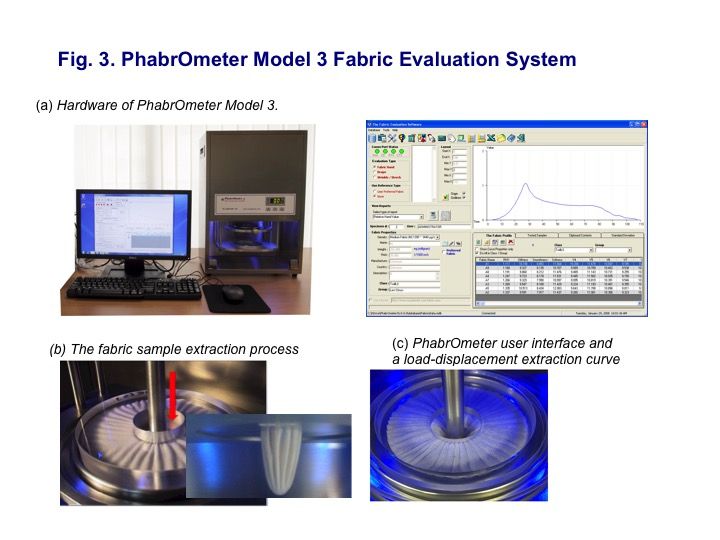
On the other hand and as a result of research by Pan and his coworkers since 1983 [20, 30, 31],
a new instrument called PhabrOmeter fabric test system [32] has been developed, as shown in
Fig. 3(a). Unlike the Japanese KES system, no attempt is made to separately measure
individual fabric properties deemed to be associated with fabric sensory attributes. Instead, this
instrument is based on the previously proposed fabric extraction method [20] with some key
patent-protected improvements. During test, a force-displacement curve, Fig. 3(a), is generated
through the fabric extraction process, which has been shown to contain implicitly the same
fabric properties related to the fabric sensory attributes [20, 30, 31]. Then a computer algorithm
was developed based on the pattern recognition technique to derive a series of parameters
defining fabric hand, fabric drape and wrinkle recovery. With the key improvements over the
original testing extraction action, the instrument possesses very high test repeatability,
sensitivity and fast test speed. The instrument has been adopted by various companies in
major countries, and some successful applications have been reported [33, 34]. In addition, an
AATCC standard test method for the PhabrOmeter, AATCC TM202, has been officially
established to guide the users [35]. Also it is clearly shown in Fig. 3(b) and (c) that this test
method indeed creates genuine wrinkles on fabric samples tested.
In the following sections, we will compare the 3 methods by testing and analyzing the test
results to establish a case that PhabrOmeter is a much better replacement of AATCC 66 and
128 methods. There are other testing methods often used along with AATCC 66 to measure
fabric bending stiffness, e.g., Cantilever Stiffness Tester (ASTM D1388), but they have little
relevance with our topic and hence are excluded.
Fabric samples used
Facing huge varieties of textile fabrics the first challenge for any quality evaluation scheme is to
categorize the various types of the products into fewer, manageable and meaningful groups.
Classification or sorting is arguably the first step of any scientific investigation, and comparison
of product quality is meaningful only when conducted within a group of comparable products.
The Japanese Kawabata’s system is probably among the very few who attempted to address
this issue. Kawabata approached the problem by first choosing fabrics for the same
applications, and then grouping them based on the fabric weight alone. Table I shows the four
groups officially established for the Japanese system [36].
Table I the major fabric categories for the Japanese system [36]
Men’s Women’s
6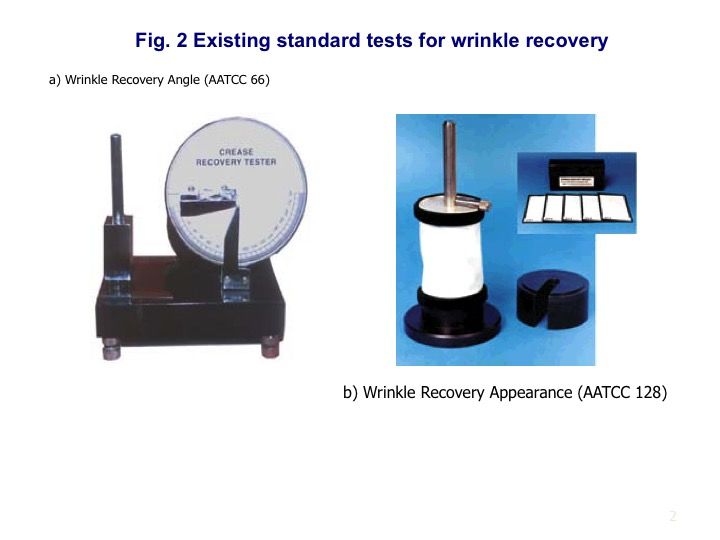
Preprints (www.preprints.org) | NOT PEER-REVIEWED | Posted: 19 June 2018          doi:10.20944/preprints201806.0293.v1

                 Winter suits     Summer suits      Medium-thickness dress       Thin-dress

             When our attempt is to develop a scheme that covers much wider range of products, more
             general and representative criteria have to be established. Furthermore, product thickness is a
             parameter of broad range over the various products, and is too critical to be ignored.

             Here are the 3 criteria we used [23] to develop a system for the fabric extraction method in
             classifying all the products into groups which makes sense first, and also easy to use:

                 1. Weight and thickness should be both considered;

                 2. It is known that in such an extraction method, heaver/thicker products will lead to
                     changes of testing results in the same trend [31, 37];

                 3. Structural differences (weaves, fiber types etc.) have to be reflected during the
                     measurement within each group.

                 According to the rules above, a parameter reflecting both weight and thickness, i.e. density
             should be used. The actual fabric volumetric density ρ (weight/volume) is defined as

                                                          w
                                                     ρ=                                   (1)
                                                          T
                 where w is the fabric weight (weight/area), and T is the fabric thickness (length). However,
             use of ρ will violate the second rule above. We can then define a fabric linear density λ

                                                     λ = wT                                      (2)

                 In this case, change either fabric weight or thickness will alter the λ value in the same trend.
             λ has the unit of (weight/length) and is hence termed the linear density. Table II provides the
             possible ranges for the three parameters of fabric products.

                 Table II The possible ranges of fabric parameters
                                  Parameter               unit         Minimum    Maximum
                                                                   2
                                  Fabric weight           w (mg/cm )   >0.10*     0.001     < 25
                                * estimated data.
                 The next question is how to group fabrics based on this λ value. It would be convenient if λ
             value is evenly distributed over its entire range so that we can group all products by evenly

                                                                                                                7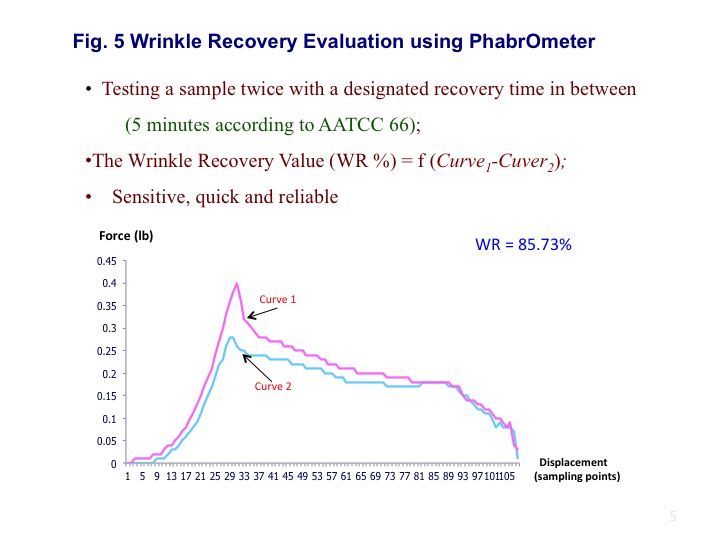
Preprints (www.preprints.org) | NOT PEER-REVIEWED | Posted: 19 June 2018              doi:10.20944/preprints201806.0293.v1

             dividing the λ value. However it is more conceivable that over the possible fabric ranges, there
             are fewer extremes in both ends and more in the center for the λ value; in other words, a
             normal distribution of λ would be a more acceptable assumption. By using λ as the primary
             parameter, all textile fabrics can be divided into 4 different Major groups as shown in Table III
             based on data tested. It has been working well so far with satisfying results [33, 34, 38].

                 Table III The different fabric groups
             Groups          Extra light       Light              Medium        Heavy           Super heavy
             λ (mg/mm)       20.0

             As it is less meaningful to compare samples from different groups, in data processing, all
             calculations, transformations and comparisons should be conducted within each group. Of
             course, fabric classification is a hugely complex issue and the groups shown in Table III are just
             general yet useful results. Rule 3 above may then be practiced to classify products in the same
             Major group further into subgroups if deemed necessary.

             For this project, 40 fabrics were collected from Cotton Inc., and were found to span over all 4
             major groups (S=2), (L=27), (M=10) and (H=1) according to the calculated linear density λ, as
             listed in Table IV.
             Table IV Groups for collected fabrics
               Groups    Super light (S)        Light (L) n= 27            Medium (M) n= 10        Heavy (H) n=1
                             n=2
               Fabrics     #26, #38        #1~#14,#18~#20,#22~#25,       #15~#17,#21,#27,#28,           #31
                                           #29,#30, #34,#36, #39,#40       #32,#33,#35,#37

             Testing and results
             The 40 fabrics in Table IV were first tested for wrinkle recovery by following the instructions in
             the established standard tests including AATCC 66 wrinkle angle recovery [21] and AATCC 128
             Appearance recovery [22]. Note that as AATCC 66 wrinkle angle recovery is valid only for
             woven fabrics, there are only AATCC 66 data for 12 woven fabrics out of Table IV available.

                                                                                                                    8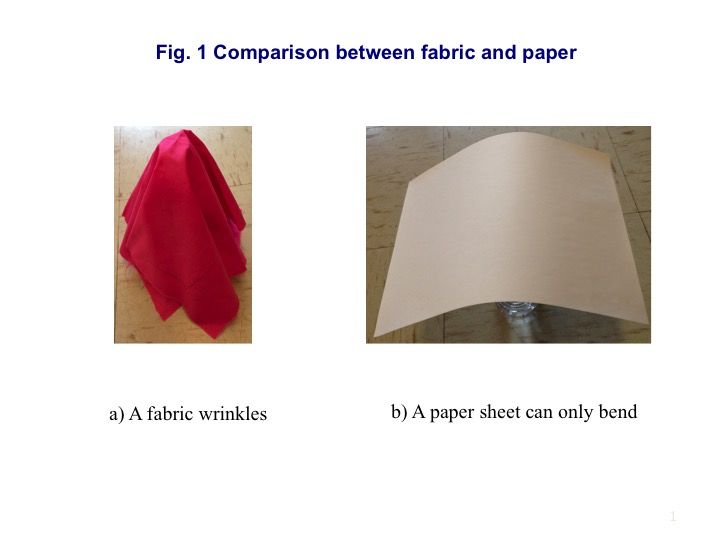
Preprints (www.preprints.org) | NOT PEER-REVIEWED | Posted: 19 June 2018        doi:10.20944/preprints201806.0293.v1

             First of all, we would like to explore more about the two existing AATCC methods by comparing
             the data generated from them for the 12 woven fabrics as in Fig. 4. It is seen from the data that
             the consistency between the results is not sufficiently high. Although there is more or less some
             trend, the correlation between the two data groups is r = 0.47; a little too low to verify the
             reliability of the methods. We have often witnessed or heard from other presentations that
             AATCC 66 and 128 failed to give consistent results.

             It is not surprising though if we review the criteria we listed when introducing the test methods
             above. A typical wrinkle test procedure involves 3 key steps: wrinkle generation, wrinkle
             recovery, determination/quantification of the residual deformation in the sample.       Clearly to
             attain any consistence between the test methods, the 3 key steps have to be carefully
             determined. The 3 test methods are summarized in Table V.

                                                                                                              9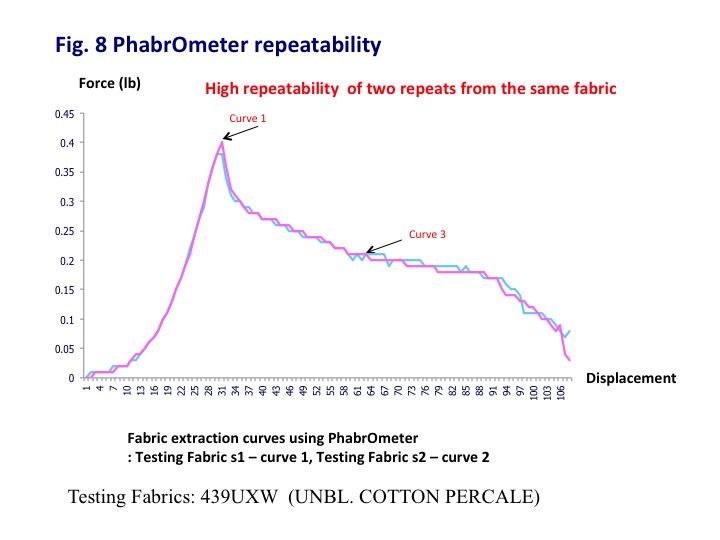
Preprints (www.preprints.org) | NOT PEER-REVIEWED | Posted: 19 June 2018                            doi:10.20944/preprints201806.0293.v1

             Table V comparison between different test methods
             Method              Sample (cm)            Wrinkle generation     Wrinkle recovery            Data determination
             AATCC 66 Recovery   1.5 x 4.0 strip        Folding sample under   5 min recovery before       Visual reading
             angle                                      0.5 kg for 5 min.      reading
             AATCC 128           15 x 28                Crashing sample with   24 hrs recovery before      Comparing with replicas 1 to
             Appearance          rectangle              3.5kg weight for 20    reading                     5.
                                                        min.
                                                    2
             PhabrOmeter         Circular 100 cm        Sample extraction to   5 min recovery before the   Difference between 2 tests,
                                                        generate wrinkle       second test                 computer determination.

             Clearly due to the differences in sample size and shape, deformation weight used in wrinkle
             generation, recovery time allowed collectively contribute to the inconsistence between the two
             test results of AATCC 66 and 128. Multiple and tedious actions during sample test and the
             visual subjective nature of data determination in both tests lead to the slow, insensitive, and
             poorly repeatable results.            In other words, we are unable to validate the effectiveness of either
             method. However in between the two methods, AATCC 128 appears to be even less reliable
             because only 5 levels (replicas) are available for grading.

             Next to PhabrOmeter, as stated in last section, during an extraction process on the
             PhabrOmeter, the fabric sample is going through a deformation with complex wrinkles at low
             stress state and then more or less recovered afterwards. If we can detect the residual wrinkle
             after given time, it gives us numerically how much wrinkle not been recovered – this is the
             principle for the PhabrOmeter to be applied to fabric wrinkle recovery tests.

             A sample is cut into the circular shape of 100cm2 area using a standard cutter and mounted
             onto a secure sample holder in PhabrOmeter. Once ready to operate the instrument, the
             computer will prompt for both fabric weight and thickness so that the linear density λ value for
             this sample is calculated. Accordingly the sample is assign to the corresponding density group
             in Table IV for subsequent testing and analysis. The process of wrinkle recovery test on
             PhabrOmeter is briefed below and the details on testing operation and data generation can refer
             to the PhabrOmeter User Manual [32].

                                                                                                                                     10
Preprints (www.preprints.org) | NOT PEER-REVIEWED | Posted: 19 June 2018 doi:10.20944/preprints201806.0293.v1
For a given sample, the normal fabric extraction test is done using PhabrOmeter and the
corresponding result is termed the test Curve 1 in Fig. 5. The sample is left alone to recover
from the deformation for 5 min, according to AATCC 66, and is tested again to generate Curve 2
in Fig. 5. In most cases, Curve 2 is under Curve 1 due to more or less residual deformation from
the first test. If however the sample has a perfect wrinkle recovery capacity, the wrinkles
generated in the first test will be completely recovered so that the two curves will exactly overlap
with each other. Otherwise, the difference between the two curves represents the unrecovered
wrinkles of the sample, i.e., the wrinkle recovery coefficient. Once the second test is done, the
computer will automatically calculate the fabric wrinkle recovery coefficient, e.g., WR = 85% in
Fig. 5, and save it into a data file.
A1 − A2
WR(%) = (3)
A1
Where Ai is the area under Curve i. Note that in general this area under Curve is not unique, i.e.,
11Preprints (www.preprints.org) | NOT PEER-REVIEWED | Posted: 19 June 2018 doi:10.20944/preprints201806.0293.v1
different fabrics may produce the same Ai value even though they have different curves. But, in
this case, we are dealing with two curves from the same fabric, this Ai value is unique for each
curve. As the entire test is computer controlled once the sample is mounted, and the unique
features for PhabrOmeter listed in Table V, the process is fast and easy with demonstrated high
sensitivity and repeatability [34, 38].
Before examining the wrinkle recovery data from PhabrOmeter, we have to tackle the
fundamental difficulty - there is no established means to calibrate the wrinkle recovery capacity,
to validate the effectiveness of any wrinkle recovery test methods. Nevertheless, via the
comparison summarized in Table V, we can rank the three methods in terms of reliability
PhabrOmeter (1), AATCC 66 (2), and AATCC 128 (3).
Fig. 6(a) compares the results from both PhabrOmeter and AATCC 128 Appearance recovery
methods for all 40 samples, and a very poor agreement r = 0.33 is shown between them. Then
concerning the many varieties of the fabrics used, we selected only the woven samples (n = 12)
in Fig. 6(b) and very little improvement, r = 0.44, was achieved.
12Preprints (www.preprints.org) | NOT PEER-REVIEWED | Posted: 19 June 2018 doi:10.20944/preprints201806.0293.v1
Fig. 7 compares the PhabrOmeter data with the results from AATCC 66 wrinkle angle recovery.
Because of the limitation of AATCC 66 method, we tested the 12 woven fabrics only. Again
because of the insensitivity and the difficulty in determining a reliable data in the standard test,
we expected a strong disagreement between the data, but r = 0.0 is still surprising.
Effectiveness validation of PhabrOmeter method for wrinkle recovery testing
13Preprints (www.preprints.org) | NOT PEER-REVIEWED | Posted: 19 June 2018 doi:10.20944/preprints201806.0293.v1
Lacking credible reference to calibrate the wrinkle recovery data, we instead examine the
PhabrOmeter method to validate it independently based on its testing principle.
In fact, the tests reported below to validate the effectiveness of PhabrOmeter for fabric wrinkle
recovery testing have been done before and repeated this time by using a standard fabric
purchased from Testing Fabrics, 439UXW. All data were tested statistically significant, and the
results introduced briefly here.
First, we cut two samples from the fabric 439UXW, and tested successively on PhabrOmeter.
Fig. 8 shows the two extraction curves with high repeatability, demonstrating the reliability of the
PhabrOmeter.
During our tests, one concern was that the wrinkle created by PhabrOmeter might not be
comparable with the existing standards. Another trial was conducted by using a new sample.
After the initial extraction to generate Curve 1 as in Fig. 5, the sample was wrinkled by following
the instruction of AATCC 128 Appearance Method. Once done, the same sample was tested
again as Curve 4 in Fig. 9. Still, the results in Fig. 9, WR = 84.20%, were consistent with the
14Preprints (www.preprints.org) | NOT PEER-REVIEWED | Posted: 19 June 2018 doi:10.20944/preprints201806.0293.v1
wrinkle recovery value WR = 85.73% in Fig. 5. The relative error between the two values =
(85.73-84.20)/85.73 = 0.018 or 1.8%. In other words, the level of the wrinkles generated during
PhabrOmeter testing is equivalent to the instruction of AATCC 128 Appearance Method.
Another logical question was if multiple times of wrinkling a fabric would alter the results. We
therefore did another test by strictly wrinkling the already wrinkled sample of Curve 2 in Fig. 5
again and then tested it to get Curve 5 in Fig. 10. The results here indicate clearly that using
PhabrOmeter, successive wrinkle of a sample would not produce significantly different data, and
the sample seems to have memorized and returned to its first wrinkled state. This is very
beneficial for data reliability, as some fabrics may have already been wrinkled before. That is,
the first test of a sample by PhabrOmeter has likely erased more or less the previous
deformation in the samples.
15Preprints (www.preprints.org) | NOT PEER-REVIEWED | Posted: 19 June 2018 doi:10.20944/preprints201806.0293.v1
Figs. 11 and 12 show a few examples tested using PhabrOmeter versus AATCC 66 recovery
angle test. Fig. 11(a), (b) and (c) include the results for three fabric samples with clearly
different wrinkle recovery capacities; Diagram A shows the cut samples for the two tests, where
the uneven recovery of the bending angle reveals the potential inaccuracy in the AATCC 66
recovery angle test; Diagram B are the results from PhabrOmeter; Diagram C depicts the
blurredness in determining the recovery angle in AATCC 66 test, illustrating the difficulties and
uncertainties encountered when using the recovery angle tester. Fig. 12(a) and (b) show 5
samples with ascending wrinkle recovery (WR) values tested using PhabrOmeter, indicating the
sensitivity and effectiveness of using PhabrOmeter for fabric wrinkle recovery test.
16Preprints (www.preprints.org) | NOT PEER-REVIEWED | Posted: 19 June 2018 doi:10.20944/preprints201806.0293.v1
Conclusions:
The fabric linear density λ defined in this paper is an intrinsic fabric parameter and it reflects the
influence of both fabric weight and thickness (hence the compaction density) on the fabric
extraction process when using PhabrOmeter. It has been demonstrated in this study that
PhabrOmeter creates genuine wrinkle on fabrics comparable to that in AATCC specifications,
and measures fabric wrinkle recovery values fast with repeatable results, over wide range of
fabric types. The data demonstrated that using PhabrOmeter, successive wrinkle of a sample
would not produce significantly different data. Unless more creditable fabric wrinkle recovery
reference exists to disprove it, PhabrOmeter is shown here to be effective for fabric wrinkle
recovery measurement.
Acknowledgement:
This project is partly supported by Cotton Inc. through grant No. 12-241, and also supported by
US NIFA projects CA-D*-TXC-6426-RR and CA-D*-TXC-7694-H.
17Preprints (www.preprints.org) | NOT PEER-REVIEWED | Posted: 19 June 2018 doi:10.20944/preprints201806.0293.v1
Reference Cited
1. Genzer, J. and J. Groenewold, Soft matter with hard skin: From skin wrinkles to templating and
material characterization. Soft Matter, 2006. 2(4): p. 310-323.
2. Cerda, E., K. Ravi-Chandar, and L. Mahadevan, Thin films - Wrinkling of an elastic sheet under
tension. Nature, 2002. 419(6907): p. 579-580.
3. Cerda, E. and L. Mahadevan, Geometry and physics of wrinkling. Physical Review Letters, 2003.
90(7).
4. Rippon, J.A., COMPARING THE WRINKLE RECOVERY OF COTTON FABRICS - AN
APPRAISAL OF AATCC TEST METHOD 66-1978. Textile Research Journal, 1985. 55(2): p.
103-106.
5. Kim, J.O. and B.L. Slaten, Objective evaluation of fabric hand - Part I: Relationships of fabric
hand by the extraction method and related physical and surface properties. Textile Research
Journal, 1999. 69(1): p. 59-67.
6. Memarian, F., M. Amani-Tehran, and M. Latifi, Rank Ordering and Image Processing Methods
Aided Fabric Wrinkle Evaluation. Fibers and Polymers, 2011. 12(6): p. 830-835.
7. Merati, A. and H. Patir, Anisotropy in wrinkle properties of woven fabric. Journal of the Textile
Institute, 2011. 102(7): p. 639-646.
8. Liu, C.X., New Method of Fabric Wrinkle Measurement Based on Image Processing. Fibres &
Textiles in Eastern Europe, 2014. 22(1): p. 51-55.
9. Holmes, D.P. and A.J. Crosby, Draping Films: A Wrinkle to Fold Transition. Physical Review
Letters, 2010. 105(3).
10. Huang, J., et al., Capillary wrinkling of floating thin polymer films. Science, 2007. 317(5838): p.
650-653.
11. Yang, S., K. Khare, and P.C. Lin, Harnessing Surface Wrinkle Patterns in Soft Matter. Advanced
Functional Materials, 2010. 20(16): p. 2550-2564.
12. Howarter, J.A. and C.M. Stafford, Instabilities as a measurement tool for soft materials. Soft
Matter, 2010. 6(22): p. 5661-5666.
13. Cao, Y.P. and J.W. Hutchinson, From wrinkles to creases in elastomers: the instability and
imperfection-sensitivity of wrinkling. Proceedings of the Royal Society a-Mathematical Physical
and Engineering Sciences, 2012. 468(2137): p. 94-115.
14. Zaouali, R., S. Msahli, and F. Sakli, Fabric wrinkling evaluation: a method developed using digital
image analysis. Journal of the Textile Institute, 2010. 101(12): p. 1057-1067.
15. S, O., K. E, and B. B., Comparison of Bending, Drapability and Crease Recovery Behaviors of
Woven Fabrics Produced from Polyester Fibers Having Different Cross-sectional Shapes. Textile
Research Journal, 2010. 80: p. 1180-1190.
16. Kim, E.H., Objective evaluation of wrinkle recovery. Textile Research Journal, 1999. 69(11): p.
860-865.
17. Yang, X.B. and X.B. Huang, Evaluating fabric wrinkle degree with a photometric stereo method.
Textile Research Journal, 2003. 73(5): p. 451-454.
18. Hearle, J.W.S., P. Grosberg, and S. Backer, Structural Mechanics of Yarns and Fabrics. 1969,
New York: Wiley-Interscience.
19. Pan, N. and R. Postle, “10 Commandments” in Wearable Technologies. China Textile Leader,
2016: p. 54-57.
20. Pan, N., Quantification and evaluation of human tactile sense towards fabrics. International
Journal of Design and Nature 2006. 1: p. 48–60.
21. 66, A., TM66-2014, Wrinkle Recovery of Woven Fabrics: Recovery Angle. 2014.
22. 128, A., TM128-2013, Wrinkle Recovery of Fabrics: Appearance Method. 2013.
23. S., K. and P. N. Some issues in performance evaluation of fibrous sheets. in INTC. 2006.
Houston, TX.
24. Jeong, Y.J., A study of fabric-drape behaviour with image analysis part I: Measurement,
characterisation, and instability. Journal of the Textile Institute, 1998. 89(1): p. 59-69.
25. Kown, E.S., et al., A Quantitative Fabric Drape Evaluation System Using Image-Processing
Technology, Part 2: Effect of Fabric Properties on Drape Parameters. Journal of Testing and
Evaluation, 2010. 38(3): p. 263-270.
18Preprints (www.preprints.org) | NOT PEER-REVIEWED | Posted: 19 June 2018 doi:10.20944/preprints201806.0293.v1
26. Park, C.K., S. Kim, and W.R. Yu, Quantitative fabric drape evaluation system using image
processing technology (Part 1: Measurement system and geometric model). Journal of Testing
and Evaluation, 2004. 32(2): p. 131-137.
27. Taha, I., Y. Abdin, and S. Ebeid, Analysis of the Draping Behaviour of Multi-Layer Textiles using
Digital Image Processing. Polymers & Polymer Composites, 2012. 20(9): p. 837-843.
28. Willems, A., et al., Drape-ability characterization of textile composite reinforcements using digital
image correlation. Optics and Lasers in Engineering, 2009. 47(3-4): p. 343-351.
29. Wang, L., et al., Inspecting anisotropy in wrinkle recovery angle of woven fabric. Journal of the
Textile Institute, 2016. 107(6): p. 711-718.
30. Pan, N., et al., A new approach to the objective evaluation of fabric handle from mechanical-
properties. Textile Research Journal, 1988. 58(8): p. 438-444.
31. Pan, N. and K.C. Yen, Physical interpretations of curves obtained through the fabric extraction
process for handle measurement. Textile Research Journal, 1992. 62(5): p. 279-290.
32. Nu Cybertek, I. PhabrOmeter. 2014; Available from: http://www.nucybertek.com.
33. Wang, H., et al., Objective handle evaluation of next-to-skin fabrics knitted from merino wool. 86th
Textile Institute World Conference, Vol 3, Conference Proceedings. 2008.
34. Mahar, T.J. and H. Wang, Measuring fabric handle to define luxury: an overview of handle
specification in next-to-skin knitted fabrics from Merino wool. Animal Production Science, 2010.
50: p. 1082-1088.
35. AATCC, Test Method 202-2012, Relative Hand Value of Textiles: Instrumental Method. 2012.
36. Kawabata, S., The Standardization and Analysis of Handle Evaluation. 2nd ed. 1980, Osaka,
Japan: The Textile Machinery Society of Japan.
37. Alley, V.L., Jr., Revised Theory for the Quantitative Analysis of Fabric Hand. J. Eng. Ind. , 1980.
102: p. 25-31.
38. Wang, H., T.J. Mahar, and R. Hall, Prediction of the handle characteristics of lightweight next-to-
skin knitted fabrics using a fabric extraction technique. Journal of the Textile Institute, 2012.
103(7): p. 691-697.
19Preprints (www.preprints.org) | NOT PEER-REVIEWED | Posted: 19 June 2018 doi:10.20944/preprints201806.0293.v1
20Preprints (www.preprints.org) | NOT PEER-REVIEWED | Posted: 19 June 2018 doi:10.20944/preprints201806.0293.v1
Table 5b. Fabric data tested
21You can also read