DNA Origami Advanced Lab Course - Supervisors: TUM
←
→
Page content transcription
If your browser does not render page correctly, please read the page content below
DNA Origami
 Advanced Lab Course

Supervisors:

Alba Monferrer (alba.monferrer@tum.de)
Volodymyr Mykhailiuk (v.mykhailiuk@tum.de)
Michael Pinner (michael.pinner@tum.de)
Ali Khoshouei (ali.khoshouei@tum.de)
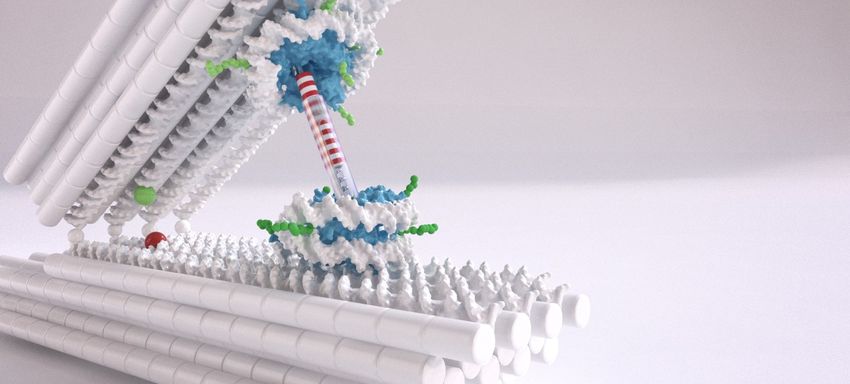
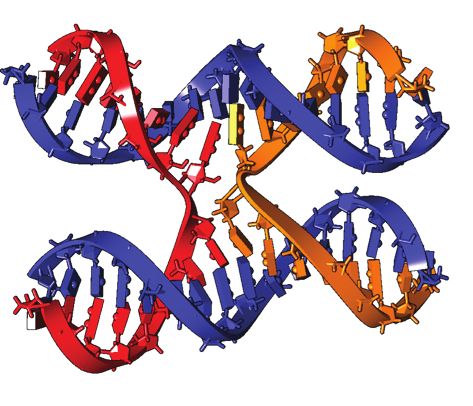
DNA Origami Advanced lab course

1 Introduction and goals
Deoxyribonucleic acid (DNA) has ideal features for producing artificial structures of user
defined shape and functions on the nanometer scale. The folding of a long DNA scaffold
strand assisted by shorter strands (brief: DNA origami [1,2]) was a decisive breakthrough in
the field of DNA nanotechnology: thousands of atoms are arranged relative to each other
with an unprecedented precision due to the pair-wise interactions of the nucleotides. The
production of DNA nanostructures is based on the principle of self organisation and is
therefore relatively simple and efficient, making it possible to produce highly complex
structures with molecular weights in the megadalton range. DNA-origami based
nanotechnology has an immense potential in the production of basic applications in
various fields of science and technology.
The goal of this lab course is to give an insight into the field of DNA origami structures,
including their fabrication, structural analysis, and an application. In the first part of the
practical course the folding behaviour of an DNA origami brick is analysed via gel
electrophoresis. In the second part, the energy landscape of two hybridising DNA single
strands is measured by using a DNA origami force spectrometer.

 Fig 1.1: DNA origami force spectrometer. In this model the measurement of the
 interaction between two nucleosomes is shown. DNA segments and fluorescent dyes
 are represented by cylinders and coloured spheres, respectively. The forces between
 the nucleosomes are illustrated by a spring balance.

 ! of 17
 1 !
DNA Origami Advanced lab course

2 Theoretic background
In many organism, DNA serves as storage for genetic information, encoded in the
sequence of its building blocks. In DNA nanotechnology, the user defined sequence of
many different DNA single strands contains the structural information of the desired shape
and function of the nanoobject. The following chapter explains the basic properties of DNA
and how they are exploited to design DNA nanostructures.

2.1 Basic properties of DNA

DNA is a biopolymer of repeating subunits, termed nucleotides. Each nucleotide is
composed of the monosaccaride 2-deoxyribose with a phosphate at its 5' carbon atom
and nucleobase at its 1' carbon atom [5]. In natural DNA four different nucleobases,
termed adenine (A), thymine (T), guanine (G) and cytosine (C) can be found. Two

 A B

 C

 Fig 2.1: DNA properties. (A) Three dimensional structure of a DNA double helix
 (PDB 1D28) [5]. The planar bases are located in the interior between the two
 backbones, stabilising the double helical conformation via base pairing and base
 stacking interaction. (B) Base pairing. The complementary bases adenine and thymine,
 and guanine and cytosine form base pairs via hydrogen bonds (dashed lines). (C) Base
 stacking. The overlapping sp2 orbitals of the nucleobase carbon ring atoms form a
 framework of σ-bonds in one plane, with the pz orbitals building a delocalised π-system
 above and below the σ-plane. The energetically favoured shifted conformation of the
 base stacks leads to the helical structure.

 ! of 17
 2 !
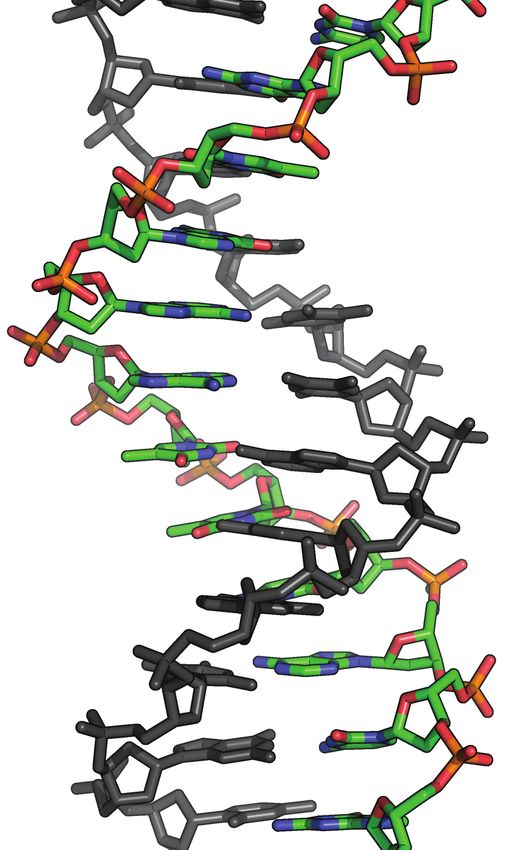
DNA Origami Advanced lab course

neighbouring nucleotides are connected with each other via a phosphodiester bond
between the 3' carbon atom of the ︎first nucleotide and the phosphate at the 5' carbon
atom of the second nucleotide. Double stranded B form DNA (in the following referred to
as DNA) consists of two strands running antiparallel to each other in a double helical
shape. The two backbones are located at the exterior of the double helix with the
nucleobases point inwards facing each other (fig. 2.1a). Bases facing each other are
complementary and form so called base pairs (bp) via hydrogen bonds (fig. 2.1b).
Additionally to the inter-strand base pairing, adjacent nucleobases interact with each other
via non covalent base stacking between the aromatic rings giving the major contribution to
the stability of the double stranded conformation of DNA (fig. 2.1c).
In solution, DNA has a helical pitch of 35.7 Å and an inter-strand base stack distance of
3.4 Å, which results in 10.5 bp per turn and a twist angle of 34.3°. Due to the non-linear
geometry of the base pairs, DNA shows a mayor and a minor groove. These geometric
properties have to be taken into account during the design of DNA origami objects.

2.2 DNA Origami

A typical DNA origami object is formed by a long circular “scaffold” DNA strand and
multiple short “staple” oligonucleotides interacting with each other via the hydrogen bonds
of the base pairs [1]. The helices are arranged on a square or a honeycomb lattice and
connected with each other via Holliday Junctions (fig. 2.2a-c). These two preferred lattice
arrangements result from the geometric properties of DNA allowing a connection between
a helix and one of its neighbours every 7 and 8 base pairs, corresponding to a 240° and a
approximately 270° turn in the honeycomb and square lattice, respectively. In general,
each staple connects multiple helices with each other, contributing to the overall stability of
the DNA origami object.
The formation, also termed folding, takes place in a one pot reaction where the many
single strands are mixed in a buffer solution. The objects self assemble via hybridisation of
the individual strands whereby the well folded object displays the global minimum in the
folding energy landscape. However, local energetic minima can act as kinetic traps leading
to misfolded objects. The folding quality can be analysed via gel electrophoresis and
transmission electron microscopy. The approach of DNA origami allows high precision
design and high yield production of nanoobjects. They find application for instance in form
of a nano force spectrometer to measure the interaction strength of various test
specimens.

 ! of 17
 3 !
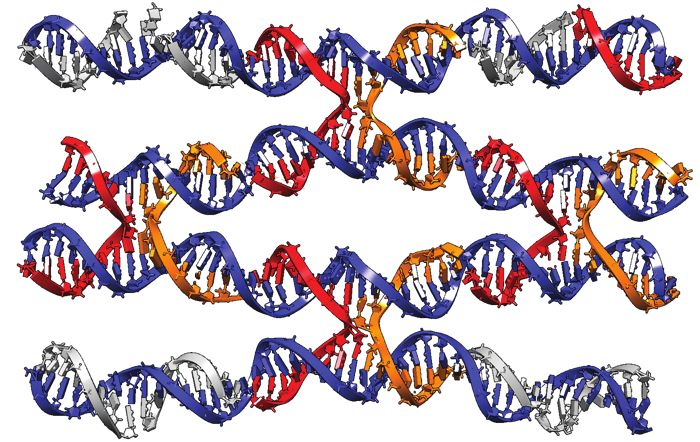
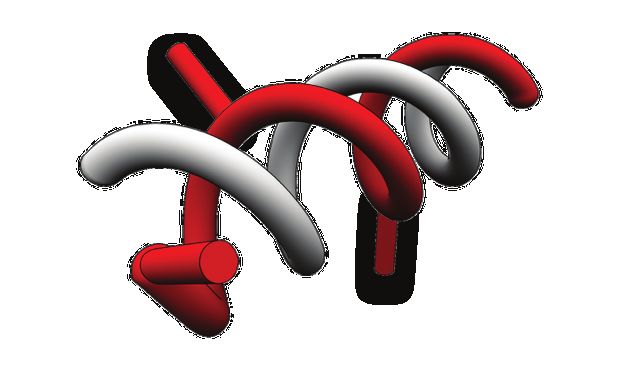
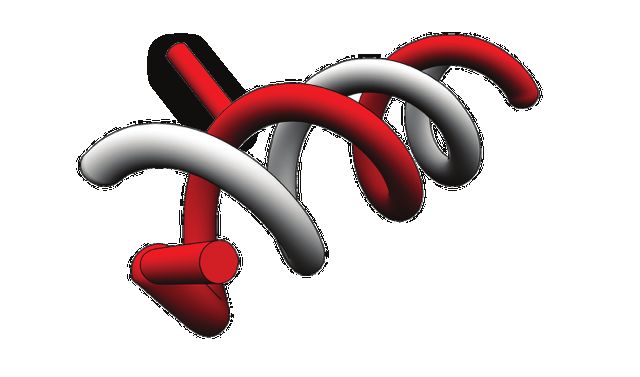
DNA Origami Advanced lab course

 A B

 C

 Fig 2.2: DNA properties. (A) Holiday junction. Four DNA single strands, part wise
 complementary to each other, form a Holiday junction. (B) Network of Holiday junction.
 (C) Honeycomb lattice. In this arrangement a helix can be connected to one of its three
 neighbours every 7 base pairs corresponding to a 240° turn.

2.3 DNA Origami force spectrometer

Single-molecule force-spectroscopy methods have led to important insights into the
functions and mechanical properties of proteins and nucleic acids. For example, one can
measure the unfolding landscape of proteins or the force-dependent extension of ssDNA.

 ! of 17
 4 !
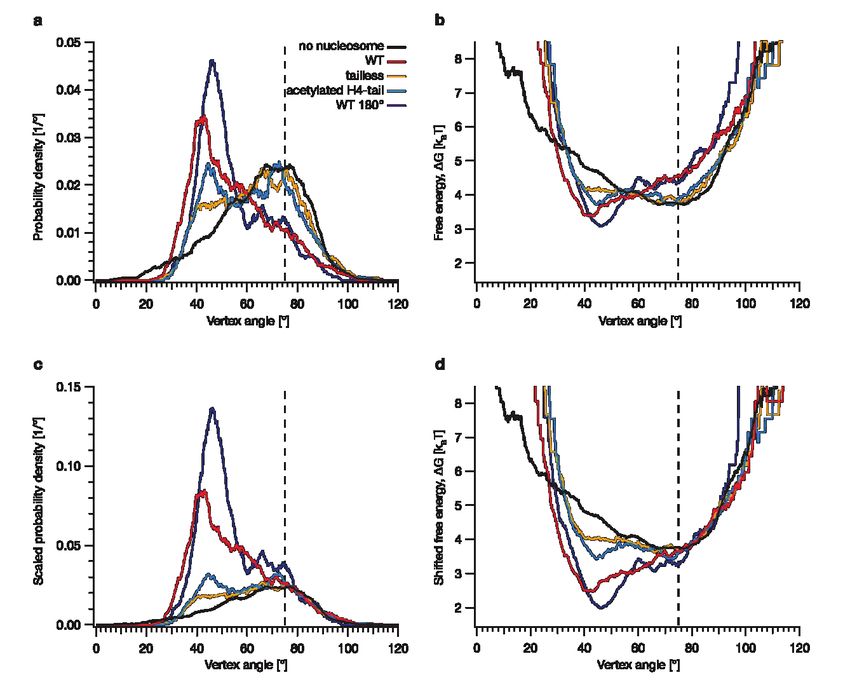
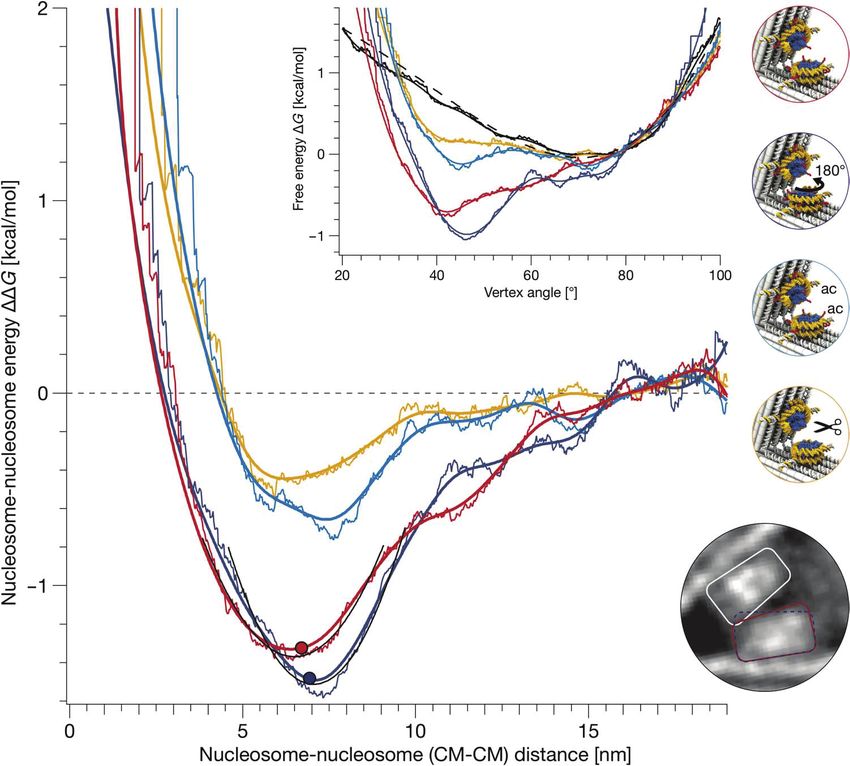
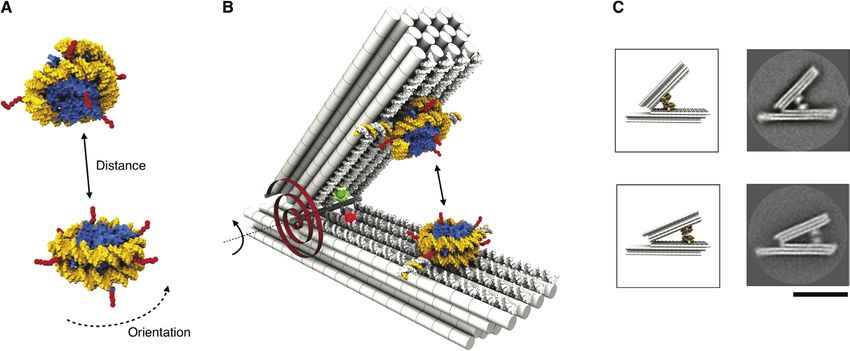
DNA Origami Advanced lab course

 A C

 B

 Fig 2.3: DNA Origami Force Spectrometer. (A) DNA origami force spectrometer
 with nucleosomes as test sample. Consisting of two arms connected with a hinge the
 force spectrometer can be used to measure the interaction between two test sample
 specimens, in this case between two nucleosomes. The spring-like force of the hinge is
 illustrated by a spring. Cylinders represent DNA helices. The histone octamer, its tails
 and the DNA of the nucleosome is coloured in blue, red, and yellow, respectively. (B)
 Angle probability density of the bare spectrometer (black) and loaded with different
 nucleosome test specimens (coloured). (C) Energy landscape. The nucleosome-
 nucleosome energy landscape is calculated from the energy landscapes of the force
 spectrometer with and without test specimens [3].

Conventional force-spectroscopy methods are, however, challenged by their low
throughput and by their requirement for connecting microscopic specimens to
macroscopic instrumentation - it is like playing Jenga with an excavator. Furthermore,
these methods do not allow the user to control the orientation of mounted target
molecules. To overcome these challenges, we developed a nanoscopic force spectrometer
made from DNA.
The DNA origami force spectrometer (fig 2.3a) was developed as a tool of similar size as
the test specimen [3]. It consists of two arms connected by a hinge and a spring with
attachment sides for the test specimens on each arm. In solution, the arms can open and
close and therefore vary their enclosed angle. Every angle corresponds to a certain state of
the underlying energy landscape (fig 2.3b-c). In turn, the probability of the force

 ! of 17
 5 !
DNA Origami Advanced lab course

spectrometer to be in a certain state, i.e. a particular angle , is determined by its free
energy as described by the Boltzmann distribution:

 2π
 1 − E(θ)
 ∫0
 − E(θ)
 !p(θ ) = e kBT ! =
 Z e k T
 B dθ (1)
 Z

with the probability p( ) of the particle being in the state with the arms enclosing the angle
 and having the energy E( ), and the partition function Z as a normalisation.
From this, the energy distribution E( ) can be calculated by taking the logarithm of the
probability density.

 E(θ )
 ! = − ln( p(θ )) − ln(Z ) (2)
 kBT

with ln(Z) as a normalisation constant depending on the underlying energy landscape.

The potential of the test specimen (TS) pair can then be calculated from the probability
densities of the force spectrometer with and without test specimen:

 ! TS = EwithTS (θ ) − EnoTS (θ ) = kBT [−ln( pwithTS (θ )) + Δ + ln( pnoTS (θ ))]
 E (3)

Assuming zero interaction of the two test specimens at high angles one can calculate the
test specimen dependent shift constant Δ
 2π
 ∫θ pwithTS(θ )dθ
 ( ∫ 2π pnoTS(θ )dθ )
 0
 Δ
 ! = ln (4)
 θ 0

where pwithTS and pnoTS are the probability density estimates of the spectrometer with and
without test specimen, and 0 as a cut off where the interaction goes to zero.

Question: Which assumptions have to be made to use this approach?

 ! of 17
 6 !
DNA Origami Advanced lab course

3 Experimental procedure

3.1 General lab safety rules

The lab in which we are going to work is a S1 area. Drinking and eating in the lab is not
allowed. Please pay attention to the instructions of the supervisors and do not touch
anything without adequate protection (lab coat and gloves, in particular nitrile gloves in the
gel area). Pay particular attention to the areas delimited with red tape (potentially
contaminated areas). Change gloves every time you touch something in the contaminated
areas.

During the course we will handle dangerous material, in particular EtBr for gel preparation
and UFO stain during TEM sample preparation. In both cases particular attention must be
taken to ensure cleanliness. The sample preparation must only be carried out on properly
equipped and marked benches or fume hood. Radioactive and EtBr-containing waste
must only be disposed in labelled containers.

3.2 42 helix-bundle

In the first part of the lab course we will fold 42 helix-bundles (42 hb), once using all DNA
strands and once leaving out 20 strands. This brick consists of 42 DNA double helices
arranged in a honeycomb lattice (Fig. 3.1). 140 staples fold the 7560 base long scaffold
strand into the desired shape.

3.2.1 Folding of 42 helix-bundle

The staples are delivered in well plates, where each kind of staple is inside a different well
at a concentration of 100 µM. The first step consists in mixing 5 µL per staple in a reaction
tube. This mixture is called pre-stock. Which is the final volume and concentration of the
pre-stock? For the folding itself, we need 4 different components: scaffold, staples from
the pre-stock, folding buffer and magnesium chloride.

 ! of 17
 7 !
DNA Origami Advanced lab course

Fig 3.1: 42 helix bundle. Model and TEM class averages of a 42 helix bundle [6].

 1. Scaffold: the scaffold is available at a concentration of 100 nM. The final
 concentration for the folding has to be 20 nM.
 2. Staples: each staple must be in a 10x excess with respect to the scaffold.
 3. Folding buffer: the folding buffer consist in a mixture of 50 mM NaCl, 50 mM Tris-
 Base, 10 mM EDTA. For the folding we need 5 mM NaCl, 5 mM Tris-Base, 1 mM
 EDTA.
 4. Magnesium chloride: this solution is available at 100 mM. For the folding, a final
 concentration of 20 mM MgCl2 is needed.

 Considering a final volume of 50 µL, calculate the necessary volume for each of the
 components. To reach the final volume, water may be added if needed.

 SAMPLE A initial final final volume of volume needed
 concentration concentration the reaction

 Scaffold

 Staples

 Folding Buffer

 MgCl2

 ddH2O

 ! of 17
 8 !
DNA Origami Advanced lab course

Calculate the same also for the reaction in which 20 staples are missing. Which are the
differences from the first reaction?

SAMPLE B initial final final volume of volume needed
 concentration concentration the reaction

Scaffold

Staples

Folding Buffer

MgCl2

ddH2O

The two reaction mixtures need to be warmed for the components to fold correctly. First,
the reaction is warmed up at 65°C for 15 minutes in order to destroy all potential
unspecific bounds among the DNA components. After that, the sample is incubated at
50°C for 90 minutes to let the structure fold correctly.

To check the quality of the folding products, we will use gel electrophoresis analysis (see
next session).

Together with the folded samples we will load into the gel three pre-prepared samples
(called sample C, D and E) for comparison: sample C is a 42 hb where the 20 slowest
binding staples are missing. Sample D consists in a 42 hb which was folded according to
the protocol written above and then heated to 65°C for 15 minutes (denatured). Sample E
is a 42 hb which underwent the same temperature steps as sample C, but afterwards was
re-folded at 50°C for 15 minutes (denatured and reheated).

In the first two and last lane of the gel we will load a 1 kb ladder and 10 µL of 20 nM
scaffold as references.

 ! of 17
 9 !
DNA Origami Advanced lab course

3.2.2 Gel electrophoresis: product analysis

The principle of agarose gel electrophoresis consists in the separation by size of the
different components present in the sample. The negative charged backbone of the DNA
origami structures interacts with an applied electric field, such that the structures migrate
towards the anode. Since the charge of the origamis is proportional to their mass, smaller
structures migrate in general faster than bigger ones. In general, bigger aggregates remain
in the pockets, while well folded structures form a sharp and bright leading band. Bands
with smaller migration distance consist of partially or not well folded origami. The excess
staples can be recognised as very bright and diffuse bands with the fastest migration
distance.

The gel is composed of a solution containing 0.5xTBE (44.5 mM TrisBase, 44.5 mM Boric
Acid, 1 mM EDTA), 2% agarose and 5.5 mM MgCl2. In case the structures do not contain
fluorescent dyes, EtBr can be added to detect the structures due to its ability to intercalate
the DNA molecules.
The running buffer consists in 0.5xTBE and 5.5 mM MgCl2. Prior to loading, the samples
are mixed with 20% (v/v) loading dye (containing Ficoll 400, 0.1% Bromophenole blue and
5 mM Tris PH88). This causes the molecules to sink in the gel pocket and allows their
tracking during the migration.
After loading the samples, a constant voltage of 90 V is applied for 1.5 hours. The gel can
later be visually inspected in a laser scanner, which can excite the EtBr molecules.

Protocol for agarose gel electrophoresis:

CAUTION:
change gloves every time you need to touch something outside the red-marked
area (avoid contamination!!). The laser scanner computer must be handled without
gloves

1. Gel preparation:
 a. Weight 1.00 g agarose in a flask
 b. Add up to 50 g 0.5xTBE
 c. Boil in microwave until agarose dissolved completely (max power, 1.5 min, shaking
 every 30 s)

 ! of 17
 10 !
DNA Origami Advanced lab course

 d. Replace evaporated water by adding ddH2O (check on balance)
 e. Cool flask under running tap water until it is cold enough to be held with gloved
 hands
 f. Add 200 µL 1.375 M MgCl2 solution for a total conc. of 5.5 mM
 g. Add 2 droplets EtBr
 h. Pour into gel tray
 i. Remove air bubbles and insert comb
 j. Let the gel dry for 20 min

2. Sample loading and running:
 a. Once the gel is solidified, remove comb and orient gel tray with pockets facing the
 cathode ("black cable plug”)
 b. Fill gel box with running buffer (0.5 x TBE + 5.5 mM MgCl2) up to 1-5 mm above gel
 surface
 c. Remove any air bubbles that may be entrapped inside pockets, then load sample
 d. Mix an appropriate amount of your samples with 6 x loading dye
 e. Carefully load the samples into the pockets of your gel
 f. Set appropriate parameters at power supply and start electrophoresis: 90 V, 1 h
 g. Clean used flask immediately while gel is running. Clean gel box (especially cathode
 wire!) as soon as you are done.

3. Gel scanning:
 1. After 1.5 h, stop the gel. With clean gloves open the laser scanner, position and
 block the gel and close the scanner again
 2. Make a new folder on the computer
 3. Select EtBr, 400 PMT and 50 µm as scanning parameters
 4. Select the appropriate scanning area and click on Start scan
 5. If some of the bands are red (saturated signal), stop the scanning and start it again
 using a lower PMT
 6. Once the scanning is finished, remove the gel and clean the laser scanner

 ! of 17
 11 !
DNA Origami Advanced lab course 3.3 Force Spectrometer You will be provided with a sample of the force spectrometer with two DNA single strands attached to the arms as test specimen. The DNA strands are partly complementary to each other. Depending on the energy landscape they adopt hybridised and de-hybridised states resulting in different angles of the force spectrometer. Each group will have a different binding sequence positioned at different distances from the hinge (the supervisors will provide you with all the info). Prepare the sample for TEM, image it, and measure the angle distribution. You will be provided with the angle distribution of the bare force spectrometer (without a test sample). Calculate the probability distributions and the energy landscapes of the force spectrometer with and without test specimen, and the energy landscape of the DNA single strands. 3.3.1 Transmission Electron Microscopy During sample preparation for the TEM, the samples are stained negatively using a solution of Uranyl Formate which fills the cavities of the DNA origami objects. Due to the high mass of the uranium atoms compared to the lighter atoms of DNA (H, C, O, etc) the electron are scattered more strongly than by the DNA origami objects. This leads to spatial differences of the detected intensity (contrast) in the image. In principle, an electron microscope has similar components like a bright-field or transmitted light microscope, including an illumination source, condenser, objective and magnifying lenses, and apertures. Compared to a light microscope the information carrier in a TEM the information are electrons. They are emitted by an electron gun and accelerated in a high voltage field, in case of the TEM used in this lab course by a heated LaB6 filament and to an energy of 100 keV. Electromagnetic lenses are used to condense the electron beam to an even and parallel illumination of the sample, and to magnify and focus the image onto the detector after the electrons were scattered by the sample. Questions: Would it be possible to use a light microscope instead of a TEM? What happens if we would not negatively stain our sample? Why do many DNA objects have stripes in the TEM images? ! of 17 12 !
DNA Origami Advanced lab course

CAUTION:
The used Uranyl Formate is a radioactive alpha source. Handling is only allowed in the
labelled area, wearing protective gear, and after the instruction of the supervisor. Waste
has to be discarded in the labeled containers.

Grid Staining Protocol:
1. Add a 1µl droplet of 5M NaOH to the inner wall of a tube containing 200µl Uranyl
 Formate (UFO) solution. The droplet must not touch the solution.
2. Vortex the tube for one minute using a Lab Dancer to mix the NaOH and the UFO.
3. Centrifuge the tube at 19k rcf for 6min.
4. Carefully take the grids from the box using a pair of tweezers and only touching the
 very edge of the grid, and place it onto a parafilm wrapped glass slide with the shiny
 side up.
5. Treat the grids in the glow discharge device at 35 mA for 45 s to make it hydrophilic.
6. Place filter paper and a piece of parafilm onto the bench in the labelled area. Fix the
 parafilm by a few water droplets.
7. Use the pipette to place two droplets of 5 µl and 20 µl UFO next to each other onto the
 parafilm.
8. Grab a grid with a pair of tweezers, pipette 5 µl sample on it and incubate it for 5 s.
9. Touch the filter paper perpendicularly with the grid to remove excessive sample
 solution and immediately pick up the small UFO droplet with the grid.
10. Remove it with the filter paper, pick up the big droplet, incubate it for 30 s, and remove
 it with the filter paper.
11. Let the grid dry for 15 min.
12. Clean the working area.

The TEM is a sensitive and expensive instrument. Do not touch any components or press
any knobs etc without instruction by the supervisor.

3.3.2 Energy Landscape Determination

For the determination of the energy landscape of the force spectrometer from its angular
fluctuations, a library with TEM images of individual particles is provided. The following

 ! of 17
 13 !
DNA Origami Advanced lab course

protocol allows an optimised angle measurement of many single particles using the
program ImageJ:

1. Open ImageJ
2. Press “O” and open the first image
3. Measure the angle with the "angle tool". Set three points which define the angle. The
 points can be moved and adjusted with the mouse.
4. “M” measures the angle and opens a table with the measured angles. Each new value
 is continuously added to the table. It is recommended to save the table from time to
 time.
5. “Shift + O” opens the image of the next particle. After the particles have been
 measured, the table is saved with the measured angles.

Not all particles are suitable for angle measurement. Define selection criteria before you
start the measurements. Think about which are appropriate selection rules are and apply
them to the angle measurement (Tip: What causes the parallel stripe pattern on the
particles?).
Use a program of your choice (e.g. origin) to make a histogram for the opening-angle
probability density from the measured angles. Explore what happens when you change the
width and offset. Make uniform and normal kernel density estimations for the opening-
angle probability density using different band width parameters. Compare the histograms
and the kernel density estimations with each other.
Plot the uniform kernel density estimation of the probability density of the empty and the
loaded force spectrometer dataset with band width 5°. Plot the energy landscapes by
taking the logarithm of the kernel density estimates: ∆Gi=-ln(pi( )). Calculate the energy
shift parameter ∆. The upper and lower integration limit depend on the test specimen and
will be told you by the supervisor (is there an alternative way to calculate the shift
parameter?) Calculate and plot the energy landscape of the test specimen as a function of
the distance between the two DNA test specimen attachment points and discuss your
results.

 ! of 17
 14 !
DNA Origami Advanced lab course

3.3.3 Optional: 3D reconstruction

In the previous parts of this lab course, TEM has been used to acquire images of the DNA
origami structures. As the name indicates, transmission electron microscope images are
2D projections of the 3D specimen, similar to common medical X-ray imaging.
Like in the medical computer assisted tomography (CAT) where images acquired via x-rays
from multiple angles can be combined to reconstruct a 3D model of the patient, TEM can
be used to reconstruct the 3D structure of a DNA nanoobject.
In the field of TEM, Single Particle is the mostly used approach where images of thousands
of particles in random orientations are taken, instead of multiple images from one single
object. Unlike with tomography were the angles under which each image had been taken
are known, the orientations of the particles in the thousands of images have to be
determined to be finally combined to a 3D electron density map. This process is performed
in software packages like RELION.
In this optional part of this lab course, you can learn the basic theoretically principles and
perform a 3D reconstruction of the force spectrometer on your own using the RELION
software package on a NVIDIA gpu node.

 ! of 17
 15 !
DNA Origami Advanced lab course

4 Results and discussion
The protocol follows the classical documentation of scientific experiments. Some points
are noted below for the individual experiments, which should be dealt with in the protocol.

4.1 Folding of 42 helix bundle

In the protocol the materials and methods should be described e.g. which are the
ingredients for the folding, what role they play in the reaction and in which volume and
concentration they are present in the mixture, sample preparation, etc.
In the result part, the scan of the gel has to be shown and discussed. What are the
different bands present in the gel? Are there some differences among them, and why?
What is the effect of leaving out 20 oligo from the folding reaction (sample B and C)? What
is the effect of heating and re-folding the sample (samples D and E)? Which conclusions
can we draw from this experiment (keywords to be discussed: pathways of folding,
nucleation during folding, out-of-equilibrium assembly, hysteresis in the folding)? Are there
other ways to detect miss-folded structures?

4.2 Force spectrometer

The opening angles of the force spectrometer (FS) have to be measured. Not every particle
is suitable for the measurement. Based on which criteria did you choose the particles?
Plot the distributions of the opening angle of the force spectrometer with and without test
specimen as histograms and kernel density estimates. What are the effects of bin/band
width, offset, and the number of evaluated particles? Calculate the energy landscape of
the test specimen as a function of the distance between the two arms of the force
spectrometer. Compare the result to the value of the literature, discuss the result and
possible error sources.

 ! of 17
 16 !
DNA Origami Advanced lab course

5 Bibliography
[1] P. Rothemund, Folding DNA to create nanoscale shapes and patterns, Nature, 2006.
[2] S. M. Douglas, H. Dietz, T. Liedl, B. Hogberg, F. Graf, and W. M. Shih, Self-assembly of
DNA into nanoscale three-dimensional shapes, Nature, 2009.
[3] Jonas J. Funke, Philip Ketterer, Corinna Lieleg, Sarah Schunter, Philipp Korber, Hendrik
Dietz, Uncovering the forces between nucleosomes using DNA origami, Science
Advances, 2016.
[4] Dinesh Puri, Textbook of Medical Biochemistry, Elsevier Health Sciences APAC, 2014.
[5] N. Narayana, S. L. Ginell, I. M. Russu, and H. M. Berman, Crystal and molecular
structure of a DNA fragment: d(CGTGAATTCACG), Biochemistry, 1991.
[6] F. Schneider, N. Möritz and H. Dietz, The sequence of events in DNA origami folding,
Science Advances, 2019.

 ! of 17
 17 !
You can also read