Elucidation of the mechanism of subunit exchange in αB crystallin oligomers
←
→
Page content transcription
If your browser does not render page correctly, please read the page content below
www.nature.com/scientificreports
OPEN Elucidation of the mechanism
of subunit exchange in αB crystallin
oligomers
Rintaro Inoue1*, Yusuke Sakamaki1, Takumi Takata1, Kathleen Wood2, Ken Morishima1,
Nobuhiro Sato1, Aya Okuda1, Masahiro Shimizu1, Reiko Urade1, Noriko Fujii1 &
Masaaki Sugiyama1*
AlphaB crystallin (αB-crystallin) is a key protein for maintaining the long-term transparency of the eye
lens. In the eye lens, αB-crystallin is a “dynamical” oligomer regulated by subunit exchange between
the oligomers. To elucidate the unsettled mechanism of subunit exchange in αB-crystallin oligomers,
the study was carried out at two different protein concentrations, 28.5 mg/mL (dense sample) and
0.45 mg/mL (dilute sample), through inverse contrast matching small-angle neutron scattering.
Interestingly, the exchange rate of the dense sample was the same as that of the dilute sample. From
analytical ultracentrifuge measurements, the coexistence of small molecular weight components and
oligomers was detected, regardless of the protein concentration. The model proposed that subunit
exchange could proceed through the assistance of monomers and other small oligomers; the key
mechanism is attaching/detaching monomers and other small oligomers to/from oligomers. Moreover,
this model successfully reproduced the experimental results for both dense and dilute solutions. It
is concluded that the monomer and other small oligomers attaching/detaching mainly regulates the
subunit exchange in αB-crystallin oligomer.
α-crystallin, which is a major protein in the eye lens, contributes to the long-term transparency of the eye lens
due to its chaperone a ctivity1. It is known that α-crystallin is an oligomer composed of 20–40 s ubunits2, and
two types of subunits, αA and αB, serve as building components of the oligomer. To unveil the mechanism of
its chaperone activity, the quaternary structure of the α-crystallin oligomer has been tackled by state-of-the-art
experimental techniques. However, the structure has not been solved, and even the association number, n, has
been dispersed depending on the reports (n = 20–32)3–7. To explain this chaotic situation, it has been hypoth-
esized that the α-crystallin oligomer intrinsically lacks a “static” quaternary structure. To be more specific, their
association numbers are not fixed, and their corresponding quaternary structures fluctuate dynamically because
α-crystallin oligomers exchange subunits between them. van den Oetelaar et al.8 firstly suggested the existence
of subunit exchange in α-crystallin utilizing reaggregated bovine α-crystallin. After their pioneering work, some
groups have studied the subunit exchange in α-crystallin under several experimental conditions through fluo-
rescence resonance energy t ransfer9,10. Baldwin et al.11 have also studied the subunit exchange in αB-crystallin
through solution nuclear magnetic resonance (NMR). Despite of the extensive works on the subunit exchange
in α-crystallin, the final consensus concerning the mechanism of subunit exchange in α-crystallin has not been
reached. It is expected that elucidation of the mechanism of subunit exchange must contribute to unveiling
the mechanism of its chaperone activity. Motivated by such an idea, we commenced to investigate the subunit
exchange in homo-oligomer of αB-crystallin with deuteration-assisted small-angle neutron scattering (DA-
SANS) technique12. We succeeded in proving the existence of this subunit exchange from the time dependence
of forward scattering intensity (I0)13.
As a next step, we then aimed to elucidate the subunit exchange mechanism. One of the possible models is
that the subunit exchange proceeds through a collision between the oligomers. Under this model, an increase in
the exchange rate is observed with protein concentration because a higher protein concentration increases the
frequency of collisions. This model must be examined by observing the exchange rate as a function of protein
concentration. Since our previous study was performed using a dilute protein c oncentration13, we should study
the subunit exchange at higher protein concentrations. Here, it evokes an inherently difficult problem: an increase
in protein concentration accompanies inter-particle interference, especially in the low Q region, hindering the
1
Institute for Integrated Radiation and Nuclear Science, Kyoto University, Kumatori, Sennan‑gun, Osaka 590‑0494,
Japan. 2Australian Nuclear Science and Technology Organization, Lucas Heights, NSW, Australia. *email: rintaro@
rri.kyoto‑u.ac.jp; sugiyama@rri.kyoto‑u.ac.jp
Scientific Reports | (2021) 11:2555 | https://doi.org/10.1038/s41598-021-82250-z 1
Vol.:(0123456789)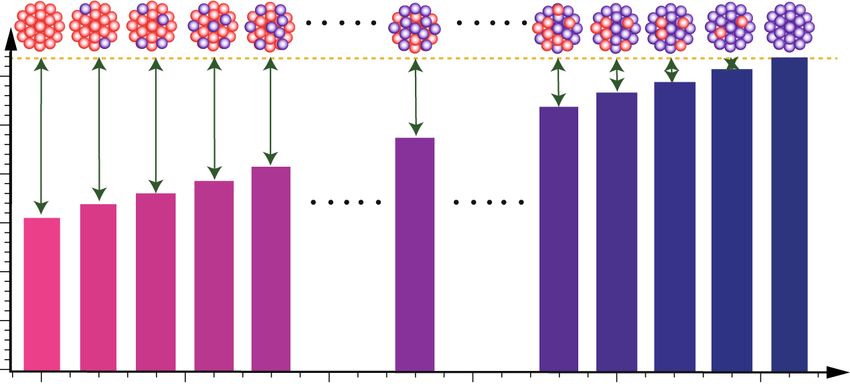
www.nature.com/scientificreports/
accurate determination of I0. To overcome this problem, we should develop a new experimental approach that
enables free inter-particle interference, even at high protein concentrations.
One promising technique is inverse-contrast matching SANS (iCM-SANS)14,15. It makes partially (approxi-
mately 75%)-deuterated (pd-) protein “scatteringly invisible” in D2O through matching the scattering length
density (SLD) of a 75d-protein to that of D 2O. In other words, a hydrogenated (h-) protein is “scatteringly visible”
and pd-protein is “scatteringly invisible” in D2O. Accordingly, when “dilute” h-proteins and “dense” pd-proteins
are mixed in D 2O, it is possible to exclusively observe the scattering from the “dilute” h-proteins without inter-
particle interference under high protein concentrations.
In this study, we applied the iCM-SANS technique to study subunit exchange in αB-crystallin oligomers at
two different protein concentrations. One is a dense sample, which consists of dense “scatteringly invisible” pd-
αB-crystallin oligomer and dilute “scatteringly visible” h-αB-crystallin oligomer. The other is a dilute sample,
which consists of dilute “scatteringly invisible” pd-αB-crystallin oligomer and dilute “scatteringly visible” h-αB-
crystallin oligomer. Based on the experimental results, we propose a reasonable model for the mechanism of
subunit exchange in αB-crystallin oligomers.
Results and discussion
Monitoring of subunit exchange through iCM‑SANS. We first prepared two types of oligomers: one
fully consisted of pd-subunits, and the other was composed of h-subunits. Here, we denote the oligomer with m
from pd-subunits as OLG(m) and, with this notation, the first as OLG(26) and the last as OLG(0) since the aver-
age association number of the αB-crystallin oligomer was found to be 26 in our previous w ork13. It was observed
that dilute OLG(26) (0.45 mg/mL) was nearly invisible in the full D2O buffer (99.6% D 2O ratio) (Fig. S1).
Next, we set the target protein concentration of αB-crystallin oligomers in the dense system to ~ 30 mg/mL,
which is similar to that found in the eye lens of human babies (~ 30 mg/mL)16. To overcome the inter-particle
interference in such a dense system, our system was composed of dense OLG(26) (28.5 mg/mL) and dilute
OLG(0) (0.45 mg/mL) in D 2O. Even though OLG(26) was dense, they are, in principle, “scatteringly invisible,”
and it was expected that the dilute OLG(0) would be exclusively observed without inter-particle interference, even
in the dense system. To confirm this, the scattering visibilities for both the dense OLG(26) and the dilute OLG(0)
were observed using iCM-SANS. Figure S2 shows the SANS profiles. It was found that the dense OLG(26) was
nearly “scatteringly invisible” in D
2O. In addition, we should emphasize that the scattering intensity of the dilute
OLG(0) was approximately four times higher than that of the dense OLG(26) around 0.01 Å−1, supporting that
the dilute OLG(0) is exclusively observable in the dense system.
An explanation of how to monitor subunit exchange with iCM-SANS follows. The dense system (~ 30.0 mg/
mL) is created with a mixture of OLG(26) (28.5 mg/mL) and OLG(0) (0.45 mg/mL). When subunit exchange
occurs, the oligomers, including the pd- and h-subunits, such as OLG(m) (0 < m < 26), are gradually generated,
and finally, the distribution of OLG(m)s reaches the equilibrium state. Here, the time evolution of the SANS
intensity is measured, especially the forward scattering intensity, I0, just after mixing I0 is expressed by the fol-
lowing equation:
I0 = NV 2 (ρprotein − ρsolvent )2 = NV 2 �ρ 2 , (1)
where N, V, ρprotein, and ρsolvent correspond to the number density, volume, and SLDs of protein and solvent,
respectively, and Δρ (= ρprotein − ρsolvent) is the “scattering contrast”. Figure 1 shows the SLDs of OLG(m) and full
D2O buffer (99.6% D 2O ratio), respectively, and |Δρ| of OLG(m), which is proportional to (26 − m), is indicated
by the length of the double-sided arrows. As given in Eq. (1), I0 is proportional to the square of Δρ. I0 starts to
decrease with the progress of subunit exchange until reaching the equilibrium state.
In the present study, we performed time-resolved iCM-SANS experiments with two samples: the mixture
of OLG(26) (28.5 mg/mL) and OLG(0) (0.45 mg/mL) as the dense sample (~ 30.0 mg/mL) and the mixture of
OLG(26) and OLG(0) both with 0.45 mg/mL as the dilute reference sample. Figure 2a,b show the time evolutions
of the SANS profiles of the dilute and dense samples after mixing. In order to track the time dependence of I0
(I0(t)), we performed Guinier analyses for both dilute and dense samples. The Guinier plots from both dilute and
dense samples are plotted in Fig. S3 and clear decrease of intensity at the low Q region were observed for both
samples with the progress of time. Fig. S4 shows the time dependence of radius of gyration (Rg) from both dilute
and dense samples and Rg (= 51.9 ± 1.2 Å) of OLG(0) at the concentration of 0.45 mg/mL measured by small-angle
X-ray scattering (SAXS) is also included in Fig. S4. Just after mixing of OLG(0) and OLG(26), Rg of dilute and
dense samples coincided with that determined by SAXS within experimental error. This finding supports the
absence of inter-particle interference and the validity of evaluation of both Rg and I0 in present Q range. We then
focused on I0(t) from both samples to figure out the progress of subunit exchange and inset figures of Fig. 2 show
the time evolutions of the forward scattering intensity, I0(t). Both samples reached equilibrium states at around
12 h after mixing. For the evaluation of the exchange rate Γ, the following single decay function was applied.
I0 (t) = I0 (0)[A + (1 − A) exp(−Ŵt)], (2)
where A corresponds to the ratio of the intensity at the equilibrium state to the initial intensity. Both I0(t) val-
ues were well fitted with Eq. (2), as shown by the solid lines in the inset figures. A and Γ were calculated to be
0.50 ± 0.02 and 0.21 ± 0.02 h−1 for the dilute sample, and 0.05 ± 0.02 and 0.20 ± 0.02 h−1 for the dense sample,
respectively. Assuming that every subunit has the same exchangeability, A values for the dilute and dense samples
were calculated to 0.52 and 0.053, respectively (refer to Supplementary Information and Fig. S5). This means
that the subunits were completely exchanged in both samples. It was reported that the dimers serve as assem-
bling components for oligomer of small heat shock p rotein17. To consider the possibility that dimers serve as an
Scientific Reports | (2021) 11:2555 | https://doi.org/10.1038/s41598-021-82250-z 2
Vol:.(1234567890)www.nature.com/scientificreports/
: h-subunit
: pd-subunit
OLG(0) OLG(2) OLG(4) OLG(6) OLG(8) OLG(13) OLG(18) OLG(20) OLG(22) OLG(24) OLG(26)
full D2O
6x10⁻⁶
buffer
5
|∆ρ|
SLD (Å-2)
4
3
2
1
0
0 2 4 6 8 13 18 20 22 24 26
m
Figure 1. SLDs of OLG(m) (bars) and full D2O buffer (yellow dotted line). The pink and purple spheres
correspond to the h- and pd-subunits, respectively. The double-sided arrows indicate the absolute values of the
scattering contrast (|Δρ|). This figure is prepared by the usage of IGOR Pro 6.34A (https://www.wavemetric
s.com/forum/news-and-announcements/igor-634a-now-shipping) and Adobe Illustrator CC 2015.2.1 (19.2.1)
(https://www.adobe.com/jp/products/illustrator.html).
exchange unit in αB-crystallin, we also calculated the A values (Ad) for the dilute and dense samples under the
assumption that every dimer in αB-crystallin oligomer possess the same exchangeability. The Ad values for the
dilute and dense samples were calculated to 0.52 and 0.091, respectively. Especially, it was revealed that Ad value
from the dense sample deviated from experimentally calculated A value (= 0.05 ± 0.02) beyond the experimen-
tal error. From our previous work, the monomer was mainly observed in low m/z region from αB-crystallin at
37 °C13. In addition, Aquillina et al.5 concluded that monomers serve as assembling components of αB-crystallin
oligomer. It is then considered that monomers are candidate for the exchanging units in the subunit exchange
of αB-crystallin.
The most stressing point was that the exchange rate of the dense sample was the same as that of the dilute
sample within experimental error. We firstly assumed that subunit exchange could occur through a random col-
lision between two αB-crystallin oligomers, however this model is excluded as an appropriate model because it
cannot explain the subunit exchange mechanism with the observed experimental data (Refer to collision model
and Fig. S6, S7 in the Supplementary Materials).
Detection of small molecular weight components using analytical ultracentrifugation meas-
urements. In our previous work with a dilute sample of ~ 1 mg/mL through native mass spectrometry meas-
urements, the coexistence of oligomers and monomers were o bserved13. Although native mass spectrometry is
a powerful technique for unveiling the particle distribution as a function of the molecular weight even in the
polydisperse system, it is not applicable for dense protein solutions such as αB-crystallin solution at 28.5 mg/
mL. To overcome this technical limitation, we performed analytical ultracentrifugation (AUC) for αB-crystallin
in solution at 0.45 and 28.5 mg/mL. The insets of Fig. 3a,b show the distributions of the sedimentation coef-
ficient (c(s20,w)) of αB-crystallin in the solutions at 0.45 and 28.5 mg/mL measured at 40,000 rpm, respectively.
Although the dense sample was affected by non-ideality due to its high c oncentration18, the minor peaks cor-
responding to small molecular weight component were observed at low s20,w region. In order to observe the
small molecular weight component accurately, we also performed AUC measurements at 60,000 rpm of which
condition is fitted to the detection of small molecular weight contribution. Results of sedimentation velocity
analysis of dilute and dense samples are plotted in Fig. S8 and both data were successfully analyzed without
exhibiting systematic error. Sedimentation coefficient distributions from the dilute and dense samples measured
at 60,000 rpm are plotted in the main panel of Fig. 3 and clear peaks are observed from both samples. We also
calculated the Mw of each peak in Fig. 3a,b from the conversion of s20,w value to Mw (Fig. S9). For the dilute sam-
ple, it was calculated to 19 kDa, 56 kDa, 101 kDa from the low c(s20,w) to high one. As for the dense sample, it was
calculated to 21 kDa, 53 kDa, 87 kDa from the low c(s20,w) to high one. Taking into consideration of result from
native mass spectrometry m easurement13 and amino acid sequence of αB-crystallin, the main peak from both
dilute and dense samples measured at 60,000 rpm is considered to be monomer.
The weight ratios of the small molecular weight components to the oligomer at 0.45 and 28.5 mg/mL were
0.015 ± 0.002 and 0.015 ± 0.003, respectively. It should be noted that the population of small molecular weight
components was not affected within the present protein concentration range (< 28.5 mg/mL).
Scientific Reports | (2021) 11:2555 | https://doi.org/10.1038/s41598-021-82250-z 3
Vol.:(0123456789)www.nature.com/scientificreports/
(a) 0.24 0.33 h
I0(t) (cm )
-1
1.3h
0.20 0.20
2.3 h
0.16 3.3 h
0.12 4.3 h
5.3 h
0.15 6.3 h
I(Q) (cm )
0 2 4 6 8 10 12
-1
time (h) 7.3 h
8.3 h
9.3 h
0.10 10.3h
11.3h
12.3h
0.05
0.00
2 3 4 5 6 7 8 9
0.1
-1
Q (Å )
(b) 0.30
0.33 h
I0(t) (cm )
1.3 h
-1
0.20
0.20 2.3 h
0.10 3.3 h
4.3 h
0.00 5.3 h
0.15 6.3 h
I(Q) (cm )
0 2 4 6 8 10 12
-1
7.3 h
time (h) 8.3 h
9.3 h
0.10 10.3h
11.3h
12.3h
0.05
0.00
2 3 4 5 6 7 8 9
0.1
-1
Q (Å )
Figure 2. Time evolutions of the SANS profile after being mixed with OLG(0) and OLG(26) for the dilute
and dense samples. (a) Time evolution of the SANS profile after being mixed with OLG(0) at 0.45 mg/mL and
OLG(26) at 0.45 mg/mL (dilute sample) at 37 °C (red to light blue lines correspond to the SANS profile at 0.33 h
and to that at 12.3 h). The inset indicates I0(t), and the red solid line corresponds to the fit with Eq. (2). (b)
Time evolution of the SANS profile after being mixed with OLG(0) at 0.45 mg/mL and OLG(26) at 28.5 mg/
mL (dense sample) at 37 °C (red to purple lines correspond to the SANS profile at 0.33 h and to that at 13.3 h).
Insets indicate I0(t), and the blue solid line corresponds to the fit with Eq. (2). This figure is prepared by the
usage of IGOR Pro 6.34A (https://www.wavemetrics.com/forum/news-and-announcements/igor-634a-now-
shipping).
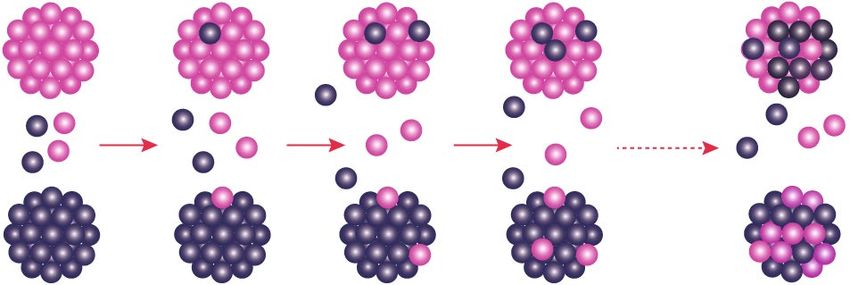
Monomer attaching/detaching model. Considering the AUC results, it is assumed that the monomer
detaches from the oligomer. However, the detached monomer should attach to the oligomer to secure its solubil-
ity because the constant exposure of the hydrophobic region of αB-crystallin to solvent is not favourable in terms
of solubility19. It is then considered that such attached/detached monomers would contribute to the subunit
exchange in the αB-crystallin oligomer (refer to Fig. 4). We then introduce the event of monomer attaching/
detaching into the second model for subunit exchange in the αB-crystallin oligomer. Based on this new model,
I0(t) was calculated using the following procedure.
1. We defined the rates of attaching and detaching monomers as ka and kd, respectively.
2. The distribution of the association number of the αB-crystallin oligomer in the model system reproduced the
AUC result (refer to Fig. S10). To simplify the calculation, only the monomer was taken into consideration
for the small molecular weight components.
3. To preserve the weight ratio of the small molecular weight components to the oligomer, the ratio of ka to kd
was determined to be 8.6.
4. The number of αB-crystallin oligomers with the association number of na, i of pd-subunits at the calculation
step of cs was defined as Nna[i](cs) (0 ≤ i ≤ na). Then, Nna[i](cs) was calculated for each cs.
5. Normalized I0 as a function of cs (I0, nor(cs)) was calculated from the distribution of Nna[i](cs).
6. To convert the I0, nor(cs) to I0(t), the time scaling factor was determined by reproducing I0(t).
Scientific Reports | (2021) 11:2555 | https://doi.org/10.1038/s41598-021-82250-z 4
Vol:.(1234567890)www.nature.com/scientificreports/
Figure 3. AUC spectra of dilute and dense samples. (a) c(s20,w) from αB-crystallin in solution at 0.45 mg/mL
measured at 60,000 rpm at 37 °C. The Mws of three peaks correspond to 19 kDa, 56 kDa and 101 kDa from the
low c(s20,w) to the high one, respectively. The inset shows c(s20,w) from αB-crystallin in the solution at 0.45 mg/
mL measured at 40,000 rpm at 37 °C. The pink and light blue arrows indicate the region corresponding to small
molecular weight components and oligomers, respectively. (b) c(s20,w) from αB-crystallin in solution at 28.5 mg/
mL measured at 60,000 rpm at 37 °C. Mws of three peaks correspond to 21 kDa, 53 kDa, and 87 kDa from the
low c(s20,w) to the high one, respectively. The inset shows c(s20,w) from αB-crystallin in the solution at 28.5 mg/
mL measured at 40,000 rpm at 37 °C. The pink and light blue arrows indicate the region corresponding to small
molecular weight components and oligomers, respectively. This figure is prepared by the usage of IGOR Pro
6.34A (https://www.wavemetrics.com/forum/news-and-announcements/igor-634a-now-shipping).
oligomer
monomer
oligomer
time progress
Figure 4. Schematic of the Monomer Attaching/Detaching model. Pink and purple spheres indicate the
h- and pd-subunits, respectively. Large clusters and small spheres correspond to αB-crystallin oligomers and
monomers, respectively. This figure is prepared by the usage of Adobe Illustrator CC 2015.2.1 (19.2.1) (https://
www.adobe.com/jp/products/illustrator.html).
The detailed procedure is summarized in the Supplementary Materials. The best-fit results are shown by
the solid lines in Fig. 5. This model successfully reproduced the results of both experiments. We cannot totally
exclude the possibility of dimer as exchanging units, hence we also calculated the I0(t)s based on the dimer
Attaching/Detaching model (Fig. S11). In the case of the dilute sample, both of I0(t)s calculated from monomer
Attaching/Detaching model and dimer Attaching/Detaching model can reproduce the experimental I0(t). It
implies that both models could occur for the dilute sample. On the other hand, I0(t) calculated curve based on
monomer Attaching/Detaching model could reproduce the experimental I0(t) of the dense sample but that based
Scientific Reports | (2021) 11:2555 | https://doi.org/10.1038/s41598-021-82250-z 5
Vol.:(0123456789)www.nature.com/scientificreports/
Figure 5. I0(t)s of the dilute and the dense samples, and the calculated curves based on the monomer attaching/
detaching model. (a) The red circle and the red solid line correspond to I0(t) of the dilute sample and the result
from the calculation based on the Monomer Attaching/Detaching model, respectively. (b) The blue circle and
the blue solid line correspond to I0(t) of the dense sample and the result from the calculation based on the
Monomer Attaching/Detaching model, respectively. This figure is prepared by the usage of IGOR Pro 6.34A
(https://www.wavemetrics.com/forum/news-and-announcements/igor-634a-now-shipping).
on dimer Attaching/Detaching model could not reproduce. This result supports that the main mechanism of
subunit exchange in αB-crystallin oligomers is the attaching/detaching of monomer and other small oligomers
to/from the αB-crystallin oligomer.
Summary
Taking advantage of inverse contrast matching small-angle neutron scattering (iCM-SANS), we succeeded in
studying the structure of the protein in a dense environment without inter-particle interference. It is expected
that this technique is applicable to the structural analysis of proteins under more concentrated systems such as
in-cell environments.
It was reported that the quaternary structure of the αB-crystallin oligomer was severely influenced by subtle
changes in the external environment. It is considered that the quaternary structure of the αB-crystallin oli-
gomer is regulated by subunit exchange between αB-crystallin oligomers. To unveil the unsettled mechanism
of its subunit exchange, we studied it at two different protein concentrations: 28.5 mg/mL (dense sample) and
0.45 mg/mL (dilute sample) through iCM-SANS. Interestingly, the exchange rate of the dense sample was the
same as that of the dilute sample. It was considered that revealing the distribution of the association number of
αB-crystallin should offer a clue for an appropriate model. Analytical ultracentrifugation (AUC) measurements
were then performed on both dense and dilute αB-crystallin solutions. Regardless of the protein concentration,
it revealed the coexistence of oligomers and small molecular weight components, which were dominated by
monomers. We then introduced the event of attaching and detaching monomers and other small oligomers to/
from oligomers into the model. This model successfully reproduced the experimental results for both samples.
It was concluded that the attaching/detaching of monomers and other small oligomers regulates the subunit
exchange in αB-crystallin oligomers. Although further experimental validation is needed, it is also expected that
this subunit exchange is related to the function of αB-crystallin chaperone activity.
Materials and methods
Preparation of human recombinant hydrogenated and partially deuterated αB‑crystallin oli-
gomers. The detailed procedure preparation of hydrogenated (h-) αB-crystallin has already been described
in our previous w ork13. For the preparation of partially deuterated (pd-) αB-crystallin, E. coli transformants were
firstly pre-cultured in a 5.0 mL Luria–Bertani (LB) culture solution dissolved in approximately 30% D2O con-
taining 50.0 μg/mL ampicillin (Amp) for overnight at 37 °C. As a next step, 50.0 μL of such pre-cultured solution
was subsequently added to 5.0 mL LB medium dissolved in approximately 60% D 2O containing 50.0 μg/mL Amp
and further pre-cultured for overnight at 37 °C. Then, the cells were collected by centrifugation and resuspended
Scientific Reports | (2021) 11:2555 | https://doi.org/10.1038/s41598-021-82250-z 6
Vol:.(1234567890)www.nature.com/scientificreports/
in M9 minimal media containing deuterated glucose (1.5 g/L), hydrogenated glucose (0.5 g/L), autoclaved mil-
liQ (250.0 mL), and 99.8% D 2O (750.0 mL). The cells were cultured for approximately 12 h ( OD600 = 0.6) at 37 °C,
after which the expression of αB-crystallin was induced by isopropyl-1-thio β-d-galactopyranoside at the final
concentration of 0.3 mM, and the cells were grown for an additional 10–12 h at 37 °C. The detailed procedures
ork13 as well. Prior to SANS
for the purification of αB-crystallin have already been reported in our previous w
measurements, both pd- and h-αB-crystallin solutions were dialyzed against full D 2O buffer (99.6% D 2O ratio)
to exchange the exchangeable H atoms in αB-crystallin to D atoms.
MALDI‑TOF mass spectrometry. Saturated solutions of sinapinic acid in TA30 (30% acetonitrile in 70%
of 0.1% TFA in water) solvent and h-αB-crystallin (or pd-αB-crystallin) were mixed with the volume ratio of
9 to1. Such prepared solutions were dropped on the MALDI plate and let the crystallization after drying it.
The measurement was performed with MALDI-TOF Mass S pectrometry20 (microflexLT: Bruker Daltonics)
under the positive ion mode. Mass spectra data were recorded with flexControl and analyzed with FlexAnalysis
(Bruker Daltonics).
Determination of degree of deuteration of pd‑αB‑crystallin. To determine the degree of deutera-
tion of pd-αB-crystallin, we performed MALDI-TOF mass spectrometry measurements on both pd- and h-
αB-crystallin in H2O buffer (Fig. S12). Referring to the sequence of amino acid residue of αB-crystallin, the
number of non-exchangeable H a toms21 in αB-crystallin was calculated to 1098. Then, the degree of deuteration
of pd-αB-crystallin was calculated to 70.4% from the difference of m/z value (= 773.2) between two samples.
Fourier transform infrared (FT‑IR) spectroscopy. FT-IR spectroscopy22 was performed with FT/
IR-4600 spectrophotometer (JASCO, Tokyo, Japan) equipped with a triglycine sulfate detector and Ge/KBr beam
splitter and ATR PRO ONE. Spectra were recorded in the wavenumber covering from 500 to 2000 cm−1 with the
resolution of 4 cm−1.
Determination of D2O ratio. Utilizing the difference of frequency of bending vibration of H–O–D bond-
ing and that of D–O–D b onding23, Fourier transform infrared (FT-IR) spectroscopy was performed in order
to determine the D 2O ratio of buffer. The peak at around 1200 cm−1 corresponds to the frequency of bending
vibration of D–O–D bonding (Fig. S13), then the integrated intensity from 1150 to 1250 cm−1 was calculated by
changing the volume fraction of D2O. From the integrated intensity as a function of volume fraction of D2O, the
D2O ratio of our prepared D2O buffer was calculated to 99.6%.
We further confirmed the D 2O ratio in the buffer by checking the I0 value OLG(0) at the concentration of
0.45 mg/mL in this full D2O buffer (99.6% D2O ratio) and I0 was calculated to 0.24 ± 0.01 cm−1 from the Guinier
analysis (Fig. S14). Considering the exchange of H atoms to D atoms in OLG(0) in this buffer (99.6% D2O ratio),
the expected I0 value was computed to 0.24 cm−1, which is quite consistent with the experimental one.
Namely, the D2O ratio in the buffer was confirmed to 99.6% from both calculation and FT-IR measurement.
Small‑angle neutron scattering (SANS). SANS measurements were performed using QUOKKA
installed at the Australian Nuclear Science and Technology Organization (ANSTO, Lucas Heights, NSW, Aus-
tralia). The wavelength, wavelength distribution, the source to sample distance, the sample to detector distance,
guides, source aperture diameter and guard aperture diameter were set to 6 Å, 10%, 6 m, 6 m, guide 6 (g6),
50 mm and 12.5 mm, respectively. With this configuration, the Q range covered from 0.012 to 0.1 Å−1. Further
detailed instrumental information should be referred to instrumental paper of Q UOKKA24. The cylindrical cell
with the thickness of 1 mm was utilized for the measurement of dilute, dense samples and 100% D2O buffer.
The transmission measurements were performed before and after the time-resolved SANS measurements at the
exposure time of 120 s. The exposure time for one snapshot in the time course measurement was set to 600 s with
a time interval of 1200 s. The measurement procedure for both dense and dilute samples is shown in Fig. S15.
The average total counts at detector reached 1.1 × 10⁶ for both samples under this exposure time, meaning that
error is less than 0.1%. After the correction for detector efficiency and masking of bad pixels, the obtained
two-dimensional scattering patterns were converted to one-dimensional scattering profiles. Subsequently, such
obtained one-dimensional scattering profiles were converted to absolute intensity using direct beam method.
The scattering profiles from empty cell (I(Q)cell), cadmium (I(Q)dark), solvent (I(Q)solv), sample (I(Q)samp) were
used for the data reduction. Utilizing following equations, I(Q) from solute (I(Q)solute) was calculated.
I(Q)cellc = I(Q)cell /Tcell − I(Q)dark
I(Q)solvc = I(Q)solv /Tsolv − I(Q)dark − I(Q)cellc
I(Q)solute = I(Q)samp /Tsamp − I(Q)cellc − I(Q)dark − (1 − cv)I(Q)solvc ,
where I(Q)cellc, I(Q)solvc, Tcell, Tsolv, Tsamp, c and v correspond to the corrected I(Q) from cell, the corrected I(Q)
from solvent, the transmission of empty cell, the transmission of solvent, the transmission of sample, concentra-
tion and the specific volume calculated from the sequence of amino acid residue, respectively. I(Q)solutes from
the dilute and dense samples were utilized for further data analysis. The data reductions up to obtaining I(Q)solute
were performed with the macro of IGOR Pro from N IST25, which is adapted with instrumental parameters of
QUOKKA.
Scientific Reports | (2021) 11:2555 | https://doi.org/10.1038/s41598-021-82250-z 7
Vol.:(0123456789)www.nature.com/scientificreports/
Analytical ultracentrifugation (AUC). The AUC experiments were performed with XL-I (Beckmann
Colter). For the observation of both oligomers and small molecular weight components, the measurements
were performed with Rayleigh interference optics at 40,000 rpm at 37 °C. To focus on the observation of small
molecular weight components in more detail, the measurements were also performed with Rayleigh interference
optics at 60,000 rpm at 37 °C. The distribution of the sedimentation coefficient (c(s20,w)) was obtained from the
analysis with SEDFIT26.
Dynamic light scattering (DLS). DLS measurements were performed with a system equipped with a
22-mW He–Ne laser, an avalanche photodiode (APD, ALV, Germany) mounted on a static/dynamic compact
goniometer, ALV/LSE-5003 electronics, and an ALV-5000 Correlator (ALV-Laser Vertriebsgesellschaft GmbH,
Langen, Germany). The measurements were performed at 37 °C. CONTIN analysis27 was applied to obtain the
distribution of the decay rate.
Data availability
The datasets generated and analyzed during the current study are available from the corresponding authors
upon reasonable request.
Received: 2 June 2020; Accepted: 18 January 2021
References
1. Horwitz, J. Alpha-crystallin can function as a molecular chaperone. Proc. Natl. Acad. Sci. U.S.A. 89, 10449–10453 (1992).
2. Horwitz, J., Bova, P. M., Ding, L.-L., Haley, D. A. & Stewart, P. L. Lens α-crystallin: function and structure. Eye 13, 403–408 (1999).
3. Haley, D., Horwitz, J. & Stewart, P. L. The small heat-shock protein, alpha B-crystallin, has a variable quaternary structure. J. Mol.
Biol. 277, 27–35 (1998).
4. Peschek, J. et al. The eye lens chaperone α-crystallin forms defined globular assemblies. Proc. Natl. Acad. Sci. U.S.A. 106, 13272–
13277 (2009).
5. Aquillina, J. A., Benesch, J. L. P., Bateman, O. A., Slingsby, C. & Robinson, C. V. Polydispersity of a mammalian chaperone: mass
spectrometry reveals the population of oligomers in αB-crystallin. Proc. Natl. Acad. Sci. U.S.A. 100, 10611–10616 (2003).
6. Benesch, J. L. P., Ayoub, M., Robinson, C. V. & Aquillina, J. A. Small heat shock protein activity is regulated by variable oligomeric
substructure. J. Biol. Chem. 283, 28513–28517 (2008).
7. Jeghle, S. et al. N-terminal domain of αB-crystallin provides a conformational switch for multimerization and structural hetero-
geneity. Proc. Natl. Acad. Sci. U.S.A. 108, 6409–6414 (2011).
8. Vandenoetelaar, P. J. M., Vansomerren, P. F. H. M., Thomson, J. A., Siezen, R. J. & Hoenders, H. J. A dynamics quaternary structure
of bovine α-crystallin as indicated from intermolecular exchange of subunits. Biochemistry 29, 3488–3493 (1990).
9. Bova, M. P., Ding, L.-L., Horwitz, J. & Fung, B.K.-K. Subunit exchange of αA-crystallin. J. Biol. Chem. 272, 29511–29517 (1997).
10. Ghahghaeia, A., Rekasa, A., Pricea, W. E. & Carver, J. A. The effect of dextran on subunit exchange of the molecular chaperone
αA-crystallin. Biochem. Biophys. Acta 1774, 102–111 (2007).
11. Baldwin, J. A. et al. Quaternary dynamics of αB-Crystallin as a direct consequence of localized tertiary fluctuations in the C-ter-
minus. J. Mol. Biol. 413, 297–309 (2011).
12. Sugiyama, M. et al. Kinetic asymmetry of subunit exchange of homo-oligomeric protein as revealed by deuteration-assisted small-
angle neutron scattering. Biophys. J. 110, 2037–2042 (2011).
13. Inoue, R. et al. New insight into the dynamical system of αB-crystallin oligomers. Sci. Rep. 6, 29208 (2016).
14. Sugiyama, M. et al. Conformational characterization of a protein complex involving intrinsically disordered protein by small-angle
neutron scattering using the inverse contrast matching method: a case study of interaction between α-synuclein and PbaB tetramer
as a model chaperone. J. Appl. Cryst. 47, 430–435 (2014).
15. Sugiyama, M. et al. Structural characterization of the circadian clock protein complex composed of KaiB and KaiC by inverse
contrast-matching small-angle neutron scattering. Sci. Rep. 6, 35567 (2016).
16. Srinivas, P. N. B. S., Yadagiri, P. & Bhanuprakash Reddy, G. Significance of α-crystallin heteropolymer with a 3:1 αA/αB ratio:
chaperone-like activity, structure and hydrophobicity. Biochem. J. 414, 453–460 (2008).
17. van Montfort, R. L., Basha, E., Friedrich, K. L., Slingsby, C. & Vierling, E. Crystal structure and assembly of a eukaryotic small
heat shock protein. Nat. Struct. Biol. 8, 1025–1030 (2001).
18. Chaturvedi, S. K., Ma, J. A., Patrick, H. B., Zhao, H. & Schuck, P. Measuring macromolecular size distributions and interactions
at high concentrations by sedimentation velocity. Nat. Commun. 9, 4415-1–9 (2018).
19. Doss, E. W., Ward, K. A. & Koretz, J. F. Preliminary studies on the association process of alpha-crystallin. Exp. Eye Res. 65, 255–266
(1997).
20. Porte, L. et al. Head-to-head comparison of Microflex LT and Vitek MS systems for routine identification of microorganisms by
MALDI-TOF mass spectrometry in Chile. PLoS ONE 12, e0177929-1–23 (2017).
21. Jacrot, B. The study of biological structures by neutron scattering from solution. Rep. Prog. Phys. 39, 911–953 (1976).
22. Griffiths, P. R. & de Haseth, J. A. Fourier Transform Infrared Spectrometry 2nd edn. (Wiley, New York, 2007).
23. Venyaminov, S. Y. & Prendergast, F. G. Water (H2O and D2O) molar absorptivity in the 1000–4000 cm−1 range and quantitative
infrared spectroscopy of aqueous solutions. Anal. Biochem. 248, 234–245 (1997).
24. Wood, K. et al. QUOKKA, the pinhole small-angle neutron scattering instrument at the OPAL Research Reactor, Australia: design,
performance, operation and scientific highlights. J. Appl. Cryst. 51, 294–314 (2018).
25. Kline, S. R. Reduction and analysis of SANS and USANS data using IGOR Pro. J. Appl. Cryst. 39, 895–900 (2006).
26. Schuck, P. et al. Size-distribution analysis of macromolecules by sedimentation velocity ultracentrifugation and Lamm equation
modeling. Biophys. J. 78, 1606–1619 (2000).
27. Provencher, S. W. CONTIN: a general purpose constrained regularization program for inverting noisy linear algebraic and integral
equations. Comput. Phys. Commun. 27, 229–242 (1982).
Acknowledgements
The SANS experiments using Quokka at ANSTO were performed under Proposal No. 5744, 6161, and 7005,
respectively. This work was supported by MEXT/JSPS KAKENHI Grant Numbers JP17K07361, JP19KK0071,
JP20K06579 to R. I., JP19K16088 to K. M., JP17K07816 to N. S., JP20K22629 to M. Shimizu, JP18H05229,
JP18H05534, and JP18H03681 to M. Sugiyama). This was also partially supported by the Sasakawa Scientific
Scientific Reports | (2021) 11:2555 | https://doi.org/10.1038/s41598-021-82250-z 8
Vol:.(1234567890)www.nature.com/scientificreports/
Research Grant from The Japan Science Society to A. O. Travel expenses for the SANS experiment with Quokka
at ANSTO, Australia, were supported by the General User Program for Neutron Scattering Experiments, Institute
for Solid State Physics, The University of Tokyo (Proposal No. 17537), at JRR-3, Japan Atomic Energy Agency,
Tokai, Japan. This study was partially supported by the Radiation Application Development Association (RADA)
under the MEXT Support Program for Overseas Facility Users. This work was also partially supported by the
KumatorI Deuteration Station Project (KIDS Project) and project for Construction of the basis for advanced
materials science and analytical study by the innovative use of quantum beams and nuclear sciences at the
Institute for Integrated Radiation and Nuclear Science, Kyoto University. This work is partly supported by the
deuteration laboratory at the Materials and Life Science Experimental Facility at J-PARC.
Author contributions
R.I., Y.S., T.T., and N.F. prepared the hydrogenated and partially deuterated αB-crystallin. R.I., Y.S., K.M., K.W.,
N.S., A.O., M.S., R.U., and M.S. performed SANS experiments, and R.I., Y.S. and M.S. analyzed the SANS data.
K.M. performed FT-IR measurements on buffer and determined the D2O ratio of buffer. A.O. performed MALDI-
TOF MS measurements and determined the degree of deuteration of partially deuterated αB-crystallin. Y.S. and
K.M. performed the AUC measurements and analyzed the AUC data. R.I. and Y.S. performed DLS measurements
and analyzed the DLS data. R.I., Y.S., and M.S. performed calculations for the modeling of subunit exchange.
R.I. and M.S. designed the research, and all authors wrote the paper.
Competing interests
The authors declare no competing interests.
Additional information
Supplementary Information The online version contains supplementary material available at https://doi.
org/10.1038/s41598-021-82250-z.
Correspondence and requests for materials should be addressed to R.I. or M.S.
Reprints and permissions information is available at www.nature.com/reprints.
Publisher’s note Springer Nature remains neutral with regard to jurisdictional claims in published maps and
institutional affiliations.
Open Access This article is licensed under a Creative Commons Attribution 4.0 International
License, which permits use, sharing, adaptation, distribution and reproduction in any medium or
format, as long as you give appropriate credit to the original author(s) and the source, provide a link to the
Creative Commons licence, and indicate if changes were made. The images or other third party material in this
article are included in the article’s Creative Commons licence, unless indicated otherwise in a credit line to the
material. If material is not included in the article’s Creative Commons licence and your intended use is not
permitted by statutory regulation or exceeds the permitted use, you will need to obtain permission directly from
the copyright holder. To view a copy of this licence, visit http://creativecommons.org/licenses/by/4.0/.
© The Author(s) 2021
Scientific Reports | (2021) 11:2555 | https://doi.org/10.1038/s41598-021-82250-z 9
Vol.:(0123456789)You can also read