Determination of Microbeads from Paste in Some Pharmaceuticals and Personal Care Products
←
→
Page content transcription
If your browser does not render page correctly, please read the page content below
Pharmaceutical Science and Technology
2021; 5(2): 53-61
http://www.sciencepublishinggroup.com/j/pst
doi: 10.11648/j.pst.20210502.15
ISSN: 2640-4532 (Print); ISSN: 2640-4540 (Online)

Determination of Microbeads from Paste in Some
Pharmaceuticals and Personal Care Products
Mohammed Yaqob Shareef1,*, Forkan Mohammed Yaqob Shareef2
1
    Department of Pharmacy, Mazaya University College, Al Nasiriyah, Iraq
2
    Department of Pharmacy, School of Life Sciences and Pharmacy and Chemistry, Kingston University London, London, United Kingdom

Email address:
*
    Corresponding author

To cite this article:
Mohammed Yaqob Shareef, Forkan Mohammed Yaqob Shareef. Determination of Microbeads from Paste in Some Pharmaceuticals and
Personal Care Products. Pharmaceutical Science and Technology. Vol. 5, No. 2, 2021, pp. 53-61. doi: 10.11648/j.pst.20210502.15

Received: April 14, 2021; Accepted: August 20, 2021; Published: October 12, 2021

Abstract: Since the study of microplastics has only emerged in the last few years, there is a gap in research in terms of
the analysis and quantification of microplastics in cosmetic pastes. Consequently, the main aim of this project was to
develop an optimal analytical method for the separation and quantification of microbeads from cosmetic pastes in order to
address this emerging global issue. Liquid solid extraction of microplastics from cosmetic paste through filtration under
vacuum was implemented. And quantification with standard addition and characterization via infrared spectroscopy and
light microscopy were used. Optimal extraction conditions were established which consists of boiled distilled water and
vacuum filtration using Büchner funnel of 125 mm diameter. Recovery from different pastes had 94.64%, 85.09% and
92.30% microbead recovery which indicated that the extraction method proved to be efficient. Repeatability was found to
be supportive of findings. The microbeads were analyzed under light microscopy where it was established that the
microplastics extracted from the cosmetic pastes were smaller than 1 mm in size. An ideal method was developed for the
extraction and quantification of microbeads from pastes. From this research project it was also deduced that paste matrix
affects the recovery of microbeads from the product. Thus, standard addition approach must be carried out for each paste
for quantification with high trueness.

Keywords: Microbeads, Microplastics, Pollution, Cosmetics, Pharmaceuticals and Personal Care Products, Infrared,
                   Light Microscopy

                                                                           The industry uses the term ‘microbeads’ to describe
1. Introduction                                                         microplastic particles present in pharmaceuticals and
1.1. Global Plastic Pollution and Its Prevalence                        personal care products (PPCP); additionally, they may also
                                                                        be called microspheres, nanospheres or plastic particulates
   Despite the current surge of legislative proposals directed          [3]. Currently, there is no unanimously approved definition in
at decreasing plastic use and inadequate disposal, global               terms of the size range for microbeads. Various definitions of
plastic manufacturing has risen over 600% since 1975 [1, 2].            microbeads are used in literature, for example they were
Worldwide plastic production has consistently increased at an           described as barely visible particles that pass through 500 µm
alarming rate from 1.5 to 311 million tons [2, 3]. It has been          sieve by Andrady [6] whereas particles smaller than 1 mm
evaluated that every year 4.8–12.7 million tons of plastic              were classified as microbeads by Imhof et al. [7] An
debris enter the ecosystem [1]. Due to the increase in                  extensive literature review conducted by Hidalgo-Ruz et al.
production of synthetic polymers and its low biodegradability,          [8], identified the term ‘microbeads’ was first used in 2004 to
it rapidly accumulates in the ecosystem, making it the most             describe plastics of 50 micrometers in size [8, 9]. Although
common type of global marine pollution [4, 5].                          internationally the definition differs in terms of the size range
                                                                        for microbeads, they are widely accepted as plastic fragments
1.2. Defining Microbeads                                                smaller than 5 mm [10, 11].
Pharmaceutical Science and Technology 2021; 5(2): 53-61                                        54

  Microbeads found in the ecosystem are varied; they differ                     polyolefin (Figure 1) include polyethylene (PE),
in shape, size and chemical composition. They are                               polypropylene (PP), and polystyrene (PS) [13]. When
synthesised from polyolefin particles and are usually                           analysing PCPs, microbeads synthesised from PE and PS
amorphous in shape without sharp edges which makes it                           were identified as spherical, threads or irregularly shaped
appropriate for use in PPCPs [12]. The most commonly used                       particles, and mostly having a blue or white colour [20, 21].

                Figure 1. Chemical structures of the most commonly used polymers in the synthesis of microbeads, drawn using Accelery [13].

                                                                                and Switzerland. Microbeads have also been found useful in
1.3. Uses, Sources and Fate of Microbeads                                       medical applications, as carriers to deliver active
   Microbeads are used as exfoliants in certain PCPs, such as                   pharmaceutical agents and in dental tooth polish [12].
hand and facial cleansers, cosmetics, and toothpastes [13].                        After use of PCPs and medical applications, microbeads
The PCPs usually comprise of 0.05 to 12% microbeads, with                       reach the marine ecosystem via wastewater. Microplastics
their size ranging from 450 to 800 µm [12, 13]. Microbead                       enter the environment as either primary or secondary
particle size in facial cleansers are usually kept to a standard                pollution. Whilst primary microplastics are originally
size, since an exfoliant large in size may be too harsh on the                  manufactured in micro-scale, for example in cosmetics [14]
skin, whilst small microbeads could be ineffective as an                        and medicine [15], secondary microplastics are the result of
abrasive. Likewise, similar size and characteristics of                         physical and photochemical degradation of bigger plastic
microbeads are used in toothpastes to avoid cracking and                        fragments [16-18]. The following (Table 1) provides an
subsurface chipping of tooth enamel. A survey conducted by                      outline of sources of primary and secondary microplastics in
Cosmetics Europe identified that PE accounted for 93% of                        the environment [12].
the microbeads used in PCPs in the European Union, Norway

                                Table 1. Summary of sources for primary and secondary microplastics in the environment [12].

 Primary microplastics                                              Secondary microplastics
 PCPs containing exfoliants                                         General littering of plastic waste
 Medical applications                                               Plastic mulching
 Industrial abrasives                                               Loss of plastic waste during waste collection
 Drilling fluids for oil and gas exploration                        Loss of plastic materials during natural disasters

   The size and form of microplastics in sewage sludge can                      primary microplastics, where no literature has identified the
be affected during sewage treatment works (STW), due to                         efficiency of extraction method or whether sample matrix has
increased temperature, increased pH and mechanical mixing                       any effect on the efficiency of the separation methods and
[19, 22]. The by-product of STW contains microplastics                          hence affect the accuracy of the quantification and
which is used to fertilize agricultural land, thus represents a                 knowledge available.
source of microplastics to the environment [22].
Microplastics either remain in the soil, transported, and                       2. Materials and Methods
dispersed by wind, or transferred with surface run-off to the
aquatic environment [23, 24]. When sewage sludge is                             2.1. Materials and Method Development
discarded into oceans, microplastics directly reach the marine
ecosystem. Studies have demonstrated that entry of                              2.1.1. Equipment and Materials Used
microplastics to the environment may also be caused by                             The materials used in this study include NaOH pellets and
heavy rainfall events where untreated wastewater overflow                       PE 180 µm microbeads both of which are from Sigma
occurs and reaches oceans [25]. Moreover, in many areas of                      Aldrich. The cosmetic pastes utilised in the research project
the world, untreated sewage containing microplastics is                         include Clean and Clear cream wash, Neutrogena Spot Stress
directly disposed of into the receiving waters [26].                            Control face scrub, Real Shaving Co. face scrub and Senspa
   Since the study of microplastics has only emerged in the                     body scrub which were all purchased from the supermarket.
last few years, there seems to be a gap in research in terms of                 Laboratory equipment used include vacuum filtration
55               Mohammed Yaqob Shareef and Forkan Mohammed Yaqob Shareef: Determination of Microbeads from
                                  Paste in Some Pharmaceuticals and Personal Care Products

apparatus, Whatman filter paper of Grade 1, glass vials, glass   2.1.4. Producing Cosmetic Paste Samples
beakers, glass stirring rod, and a heating mantle. Analysis         Following the development of a protocol for the extraction
equipment were also used which are infra-red spectroscopy        of microbeads from pastes, paste samples were prepared in
(TherfoFinnigan) and light microscopy (Nikon SMZ1500)            the laboratory with manually added in PE 180 µm
equipped with a Nikon camera.                                    microbeads in pastes that does not contain any microbeads.
                                                                 This was carried out in order to test the protocol and carry
2.1.2. Measuring Microbead Size                                  out statistical analysis.
   The size of the beads has been estimated from the light          Three paste samples were prepared from Clean and Clear
microscopy images by measuring the width of microbeads in        cream wash that did not contain any plastic microbeads. To
the images with a ruler. A high number of microbeads were        prepare the samples, 1 g of cream was weighed in a clean
measured (n=30) and the average was calculated. Repeat           glass vial using a digital weighing scale. Separately, 0.2 g of
photos were also taken (n=2) from the cosmetic pastes to         PE microbeads were weighed in a measuring boat.
increase the representativeness of the data obtained.            Microbeads were added into the vial that contained the cream
2.1.3. Preliminary Tests for the Extraction of Microbeads        and this was mixed thoroughly using a laboratory vortex
       from Paste                                                mixer to ensure PE microbeads have integrated well into the
   Preliminary tests were carried out in order to develop        cream to resemble a daily use face wash (Figure 2 provides a
methodology for the extraction of microbeads from pastes:        visual representation of the procedure). This was repeated
efficiency and low cost were main goals. Initially, a method     three times to produce three samples of paste with known
for the disintegration of paste had to be developed where the    quantities of PE microbeads to increase representativeness of
disintegration process must be efficient enough to fully         results generated.
dissolve the cosmetic paste, yet microbeads must not dissolve
and should remain in solid form.
   Disintegration of the paste using NaOH under reflux was
carried out using 1 g of Neutrogena Daily Scrub for over two
hours. NaOH pellets were weighed at 4.01 g in order to
produce 100 mL of NaOH 1 Molar solution. Using a round
bottom flask stabilised on a cork ring, 1 g of paste from
Neutrogena Daily Scrub was weighed and 100 mL NaOH
solution added to the paste and swirled for two minutes. Then,
                                                                 Figure 2. Visual representation of the steps to produce sample cosmetic face
a reflux apparatus was set up in the fume cupboard where the     scrub in laboratory.
NaOH and paste mixture was left to reflux under heat for 2 h.
However, this preliminary test did not prove to be successful      The cosmetic paste samples produced were used to test the
in disintegrating the paste.                                     developed protocol as presented in Table 2. Following
   Therefore, another preliminary test was carried out. A        extraction of microbeads from produced sample cosmetic
sample of paste from Neutrogena Daily Scrub was                  pastes, the dry microbeads were weighed using a digital
weighed at approximately 2 g using a clean glass beaker.         weighing scale in the laboratory and therefore statistical
Next, 100 mL of distilled water was measured and heated          analysis was carried out.
using a heating mantle in the fume cupboard up to its              By using the following equation
boiling point which was then added to the paste. This
mixture was stirred using a clean glass stirring rod for 2                                               /
min which resulted in the disintegration of the cosmetic                                  100%                                       %
paste.
   Following the disintegration of paste, the separation of      and data generated in Table 3, percentage microbead
microbeads from the paste and distilled water mixture was        recovery is calculated for each cosmetic scrub to identify the
carried out via vacuum filtration using a Büchner funnel         efficiency of the methodology developed (Table 2).
with a 125 mm diameter. Vacuum filtration was carried
out in the fume cupboard using Whatman filter paper              2.2. Standard Addition Method
Grade 1. Once filtration was complete, a tweezer was used
                                                                    Standard addition approach was applied to three cosmetic
to pick up the filter paper and place onto a watch glass.
                                                                 pastes: Neutrogena daily scrub, Real Shaving Co. face scrub
Any microbeads on the sides of the Büchner funnel were
                                                                 and Senspa Detox body scrub. The method was carried out in
scraped off using a clean spatula and placed onto the filter
                                                                 order to examine whether cosmetic paste matrix affects
paper. The watch glass was placed into the oven at
                                                                 microbead recovery and its quantification. The stepwise
approximately 60 °C for 15 min to dry and evaporate any
                                                                 methodology of this approach involved carrying out the
leftover distilled water on the microbeads used during the
                                                                 developed protocol (Table 2) on approximately 1.2 g sample
extraction process. The above methodology constituted the
                                                                 of cosmetic paste. This generated a microbead recovery value
developed protocol for the separation of plastic
                                                                 which was “spiked” into a second paste sample of
microbeads from cosmetic pastes.
Pharmaceutical Science and Technology 2021; 5(2): 53-61 56
approximately 1.2 g. For the first cosmetic paste of 2). Standard addition method was carried out on all three
approximately 1.2 g Neutrogena Daily Scrub, the number of cosmetic pastes mentioned previously.
microbeads recovered was weighed at 0.0902 g. The value of
0.0902 g of microbeads was spiked into a second sample of 2.3. Final Optimal Protocol for the Extraction of
1.2 g of Neutrogena Daily Scrub and extraction protocol was Microbeads from Cosmetic Paste
carried out. Standard addition procedure was carried out six Table 2 presented the developed procedures used to
times to produce representative data. Generated microbead separate of microbeads from pastes (step-by-step) to allow
recoveries were used to calculate the regression line and ease of repetition by researchers in laboratories.
deduce percentage recovery of the developed protocol (Table
Table 2. Developed procedure for the separation of microbeads from pastes presented in a step-by-step format to allow ease of repetition by researchers in
laboratories.
Final optimal protocol for the extraction of microbeads from paste
Step 1 Heat 100 mL distilled water in a clean glass beaker on a heating mantle in the fume hood to boiling temperature of 100 °C.
Step 2 Using weighing scales, squeeze out 1 g of paste into a clean glass beaker.
Once distilled water reaches boiling point, which can be confirmed using a thermometer, pour approximately 40 mL of the boiled distilled water
Step 3
into the glass beaker that contains 1 g paste.
Using a clean glass stirring rod, stir the paste and distilled water mixture for approximately 3 min until paste completely dissolves and
Step 4
microbeads can be visibly seen floating on the surface.
Step 5 Set up vacuum filtration apparatus in the fume hood using a large Büchner funnel of 125 mm diameter and Whatman filter paper, Grade 1.
Pour the paste-distilled water mixture into the Büchner funnel and carry out vacuum filtration. Rinse the beaker and pour into the funnel to
Step 6
ensure all microbeads are collected and separated.
Step 7 Once vacuum filtration is complete, pick up the filter paper using a tweezer and place on a glass plate.
Place the glass plate into the oven at approximately 60°C for 15 min in order to dry the microbeads and get rid of any leftover distilled water
Step 8
used during the extraction process.
infrared spectroscopy of the microbeads extracted from each
3. Results of the three cosmetic scrubs using the methodology
developed (Table 2). Furthermore, microbeads were then
Protocol method and standard addition of three types of analyzed under light microscopy to generate both qualitative
face and body scrubs are shown in Tables 3-5 and graphs and quantitative data that can help understand the nature of
with each its respective regression line and trend line microbeads added to PCPs.
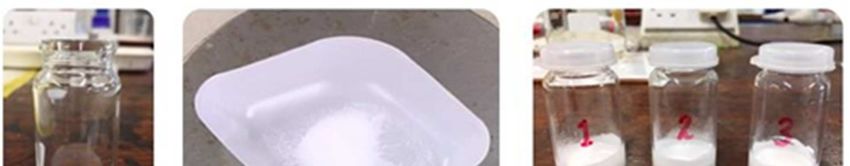
equation are presented in Figures 3-5. In addition, infrared Raw data presented in Table 3 for the standard addition
spectroscopy was taken for the Clean and Clear cream wash method carried out on cosmetic paste, Neutrogena face scrub.
sample that does not contain microbeads, as well as the The raw data in Table 3 corresponds to Figure 3.
Figure 3. Determination of microbeads in Neutrogena face scrub by the method of standard addition.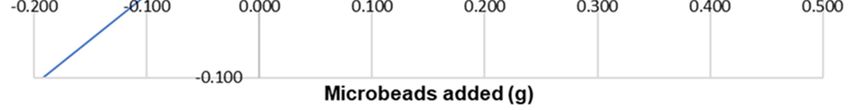
57                   Mohammed Yaqob Shareef and Forkan Mohammed Yaqob Shareef: Determination of Microbeads from
                                      Paste in Some Pharmaceuticals and Personal Care Products

                            Table 3. Tabulated data for the standard addition approach on Neutrogena spot stress face scrub paste.

 Sample                        Microbeads added (g)           Paste (g)                     Filter paper (g)              Microbeads recovered (g)
 1                                                            1.2395                        1.0248                        1.1150 – 1.0248=0.0902
 2                             0.0902                         1.2542                        1.0452                        1.1930 – 1.0452=0.1478
 3                             0.1478                         1.2869                        1.0546                        1.2900 – 1.0546=0.2354
 4                             0.2354                         1.2715                        1.0360                        1.3330 – 1.0360=0.2970
 5                             0.2970                         1.2150                        1.0350                        1.4000 – 1.0350=0.3650
 6                             0.3650                         1.2490                        1.0100                        1.4390 – 1.0100=0.4290

Microbeads recovered (g)=(weight of oven dried filter paper after carrying out extraction (g) + microbeads (g)) – filter paper (g)

   Raw data presented in Table 4 for the standard addition method carried out on cosmetic paste, Real Shaving Co. daily face
scrub. The raw data in Table 4 corresponds to Figure 4.

                               Figure 4. Determination of microbeads in RS Co. face scrub by the method of standard addition.

                              Table 4. Tabulated data for the standard addition approach on Real Shaving Co. Daily Face Scrub.

 Sample                        Microbeads added (g)           Paste (g)                     Filter paper (g)              Microbeads recovered (g)
 1                                                            1.1305                        2.1591                        2.1858 – 2.1591=0.0267
 2                             0.0267                         1.2184                        2.1660                        2.2040 – 2.1660=0.0380
 3                             0.0380                         1.2425                        2.1761                        2.2217 – 2.1761=0.0456
 4                             0.0456                         1.2651                        2.1590                        2.2147 – 2.1590=0.0557
 5                             0.0557                         1.2517                        2.1751                        2.2468 – 2.1751=0.0717
 6                             0.0717                         1.2720                        2.1600                        2.2455 – 2.1600=0.0855

Microbeads recovered (g)=(weight of oven dried filter paper after carrying out extraction (g) + microbeads (g)) – filter paper (g)

  Raw data presented in Table 5 for the standard addition method carried out on cosmetic paste, Senspa Detox body scrub. The
raw data in Table 5 corresponds to Figure 5.

                                   Table 5. Tabulated data for the standard addition approach on Senspa Detox Body Scrub.

 Sample                        Microbeads added (g)           Paste (g)                     Filter paper (g)              Microbeads recovered (g)
 1                                                            1.2632                        2.1516                        2.2628 – 2.1516=0.1112
 2                             0.1112                         1.2506                        2.1670                        2.3390 – 2.1670=0.1720
 3                             0.1720                         1.2520                        2.1471                        2.4278 – 2.1471=0.2807
 4                             0.2807                         1.2717                        2.1611                        2.5221 – 2.1611=0.3610
 5                             0.3610                         1.2450                        2.1590                        2.5870 – 2.1590=0.4280
 6                             0.4280                         1.2610                        2.1660                        2.6650 – 2.1660=0.4990

Microbeads recovered (g)=(weight of oven dried filter paper after carrying out extraction (g) + microbeads (g)) – filter paper (g)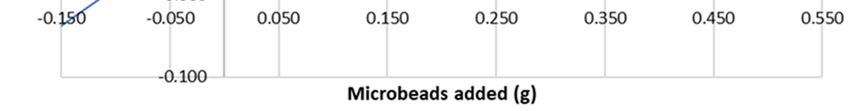
Pharmaceutical Science and Technology 2021; 5(2): 53-61                                                 58

                            Figure 5. Determination of microbeads in Senspa body scrub by the method of standard additions.

   Microbead Recovery                                                        cream wash.
   Below are the results for the protocol test carried out                      Table 6 presents the recovery of microbeads from pastes
(Table 2) and standard addition approach on three cosmetic                   using the protocol developed. The developed methodology
products that contain microbeads: Neutrogena Daily face                      was carried out on pastes produced in the laboratory to
scrub, Real Shaving Co. face scrub and Senspa Detox body                     resemble an everyday use cosmetic face scrub. Three samples
scrub. The protocol test involved the production of a scrub                  were produced to increase representativeness of results,
sample resembling a cosmetic wash which was produced in                      where microbead recovery obtained was 84%, 85% and 74%
the laboratory using PE microbeads and Clean and Clear                       with the mean percentage recovery of microbeads of 81%.

Table 6. Tabulated results for the separation of microbeads from a paste produced in the laboratory using 180 µm polyethylene microbeads and Clean and
Clear cream wash.

 Parameter                         Sample 1                Sample2                Sample 3                Mean                  SD
 Paste (g)                         1.0618                  1.0286                 1.0362                  1.0422                0.0174
 Microbeads added (g)              0.1110                  0.1060                 0.1055                  0.1075                0.0029
 Microbeads recovered (g)          0.0934                  0.0896                 0.0784                  0.0871                0.0079
 Recovery (%)                      84.14%                  84.52%                 74.31%                  80.99%                0.0608

  Microbead percentage recovery generated in the                                                  0.0784
                                                                                                              100%        74.31%
experimental procedure was carried out without the standard                                       0.1055
addition approach. Microbead percentage recovery from
                                                                                Standard addition for Neutrogena face scrub paste is
paste was calculated by dividing the number of microbeads
                                                                             presented in Figure 3. The slope is 0.9464, which indicates
recovered by the known numbers of microbeads added to the
                                                                             percentage microbead recovery for Neutrogena face scrub is
cream after carrying out the developed procedure.
                                                                             94.64%. The y- intercept is at 0.0816, which corresponds to
   By using microbead recovery equation and the data
                                                                             the initial quantity of microbeads in the 1.2 g sample of
generated in Table 3, the following is deduced:
                                                                             Neutrogena face scrub of 0.816 g.
  Sample 1:
                                                                                A second test to measure recovery was carried out with the
                   0.0934                                                    cosmetic paste Real Shaving Co. face scrub. The results of
                               100%        84.14%                            the standard addition are presented in Figure 4. The slope is
                   0.1110
                                                                             0.8509, which indicates precentage microbead recovery for
  Sample 2:                                                                  Real Shaving Co. face scrub is 85.09%. The y-intercept is at
                   0.0896                                                    0.0203, which corresponds to the initial quantity of
                   0.1060
                               100%        84.52%                            microbeads in the 1.2 g sample of Real Shaving Co. face
                                                                             scrub of 0.0203 g.
  Sample 3:                                                                     Standard addition of a third cosmetic paste, Senspa body
                                                                             scrub was carried out and data is presented in Figure 5. The
59 Mohammed Yaqob Shareef and Forkan Mohammed Yaqob Shareef: Determination of Microbeads from
Paste in Some Pharmaceuticals and Personal Care Products
slope is 0.9230, which indicates precentage microbead developed methodology for the extraction of microbeads
recovery for Senspa body scrub 92.30%. They-intercept is at form pastes, microbead recovery for each cosmetic paste
0.1005, which corresponds to the initial quantity of microbeads used can be identified and therefore the percentage of
in the 1.2 g sample of Senspa body scrub of 0.1005 g. microbeads in each product.
From the experimental procedures carried out using the
Table 7. Calculations of microbeads present in each of the PCPs used in the standard additions approach.
Product Recovery in 1.2 g Recovery in 1 g Microbeads in product (%) of microbeads per product
Neutrogena Daily face scrub 150 mL 0.0816/0.9464=0.0862 0.0718 150 mL x 0.0718=10.77 g 7.18%
RS Co. face scrub 100 mL 0.0203/0.8509=0.0238 0.0198 100 mL x 0.0198=1.98 g 1.98%
Senspa Detox body scrub 200 mL 0.1005/0.9230=0.1088 0.0906 200 mL x 0.0906=18.12 g 9.06%
Since 1.2 g of paste was used to enumerate the recovery of were still stuck into the paste.
microbeads, this value can be used to find recovery in 1 g of Due to the observation of microbeads floating on the
paste and consequently calculate microbeads present in the surface by using NaOH solution, hot distilled water was
total weight in grams of each PCP used in this study. From trialled to see if it would produce similar results. The choice
the experimental procedure carried out, Table 7 presents the of hot distilled water was due to its properties of being easily
calculations to find the number of microbeads and the heated up and not producing any chemical reactions.
percentage of microbeads in each product. The percentage of Therefore, distilled water would not cause any interactions
microbeads per product ranged from 1.98% to 9.06%. with the paste or plastic microbeads.
A sample of paste from Neutrogena Daily Scrub was
4. Discussion weighed and boiled distilled water was added and stirred.
The choice of hot distilled water proved to be successful in
Current research mainly focuses on macroplastics disintegrating the cosmetic paste. By adding hot distilled
fragmentation rather than plastic microbeads added into water to Neutrogena paste sample, the microbeads could be
PPCPs. There is lack of knowledge on quantitative analytical visibly seen floating on the surface. In fact, the boiled
methods from cosmetic products, which comprise a very distilled water successfully disintegrated the paste completely
broad ranges of matrices. Different matrices could lead to and therefore boiled water proved to be the most effective
different recovery rates of microbeads. This could affect the choice. This paste disintegration method only requires
accuracy of the quantifications of the beads in the cosmetic distilled water, which is cheap, safe, and readily available
products, which may have legal and toxicological therefore additional testing for the disintegration of paste was
implications. The distortion of microbead recovery could no longer further investigated.
possibly be caused by the components of the cosmetic paste However, the use of the Büchner funnel during vacuum
itself which therefore would give false microbead recovery filtration proved to be inconvenient as filtration took over an
reading. This distortion can be called matrix interference or hour to complete, due to the microbeads clogging up the
matrix effect, and it is the key focus in this research project. filter paper and therefore not allowing the solution to pass
Method development through. Consequently, an alternative approach to the method
Numerous preliminary tests were carried out initially with was required. Instead of using Büchner funnel of the
vital observations being made throughout, in order to have conventional 55 mm diameter size and 70 mL capacity, a
developed the final optimal protocol presented in Table 2. A larger Büchner funnel was trailed with 125 mm diameter.
reflux apparatus was set up in the fume cupboard where the Due to the larger surface area and capacity, the microbeads
NaOH and paste mixture was left to reflux under heat for 2 h. were allowed to disperse more freely and therefore the
Following reflux; it was observed that the paste was mixture of 1.20 g paste containing microbeads was easily
completely disintegrated, however, the microbeads were filtered as the number of pores were of a much greater
dissolved too and had completely melted as there were no quantity than the small Büchner funnel. Therefore, using a
visible microbeads that could be seen. From this larger Büchner funnel in diameter and capacity proved to be
experimental procedure it can be established that the the key to success for operating this methodology as the
microbeads may have dissolved due to the very high filtration process only required a couple of minutes to be
temperatures that they were exposed too for a long period of completed.
time in a basic environment. Nevertheless, a significant Assessing the final optimal protocol
observation was made during this preliminary test. When A protocol was established (Table 2) and it had to be
NaOH solution was poured over the paste and swirled, the assessed in terms of the separation of microbeads from a
paste disintegrated slowly without the need for reflux and the paste. In order to assess and evaluate the microbead recovery
microbeads floated on the surface. However, since the paste and carry out statistical analysis, model paste samples with
was not fully dissolved, separation of the microbeads from microbeads had to be produced in the laboratory. The paste
the paste would not be efficient and would produce a very samples were produced with known amounts of microbeads
small percentage recovery as a proportion of the microbeads added. This allowed percentage recovery of microbeads fromPharmaceutical Science and Technology 2021; 5(2): 53-61 60
paste to be calculated. Three paste samples were prepared. confidence and 2 degrees of freedom, therefore, the
The next steps replicated the developed protocol in order to microbeads recovery ranges from 79.04% to 82.96%.
assess it and enable quantitative data to be produced. The dry Comparison of the recovery range calculated of 79.04% to
microbeads were then weighed using a digital weighing scale 82.96% to the percentage recovery determined in the
in the laboratory and therefore statistical analysis was carried standard additions approach is fundamental to deduce
out due to the fact that a known amount of microbeads was whether the percentage recovery in the standard additions
initially added which allowed for the determination of approach lie within the recovery range. If the percentage
percentage recovery of microbeads from a paste. It was recovery calculated in standard additions approach does fall
established that microbead percentage recovery from paste within that range, we could assume that the recovery range of
samples were calculated as approximately 84%, 85% and 79.04% to 82.96% may be used to correct recoveries for all
74%. Therefore, the average percentage recovery of pastes in PCPs and that there is no matrix effect that will
microbeads from paste is 81% according to the approved distort microbeads recovery from pastes. Conversely, if
procedure as mentioned earlier. matrix effect does exist based on the results shown in Figures
Method validation via standard addition approach 3-5, this would give a different recovery in comparison to a
Advanced tests were required to be carried out as the value sample containing purely microbeads. Consequently, a
for microbead recovery could possibly be distorted by the calibration curve based on samples containing only
components of the commercial paste itself which therefore microbeads cannot be used to accurately determine
would give false microbeads recovery reading. This microbeads recovery from pastes.
distortion is called a matrix interference or matrix effect. Standard addition approach involves adding or “spiking”
Therefore, the method of standard additions is an effective known quantities of the standard, which in this case are the
technique to overcome matrix interferences. This involves microbeads, to the cosmetic paste and carrying out the protocol
the addition or “spiking” of known quantities of microbeads developed for the extraction of microbeads from pastes and
to paste samples. weighing the microbeads in response to each addition. A
The standard addition approach was carried out on three calibration curve can be obtained based on simple linear
commercial face and body scrubs: Neutrogena Daily face regression and data used to extrapolate the microbeads
scrub, Real Shaving Co. face scrub and Senspa Detox body recovery from pastes. As shown in Figures 3-5, the trendline
scrub. This was done by carrying out the developed protocol equations confirm the microbeads percentage recovery from
on each of the aforementioned face and body scrubs. each cosmetic paste used in this study. For the Neutrogena
The dry microbeads were then weighed, and this Daily face scrub the microbeads percentage recovery is
corresponded to the number of recovered microbeads from 1 94.64%. Therefore, the microbead percentage recovery of
g of commercial paste. The amount recovered was then 94.64% does not lie within the range of 79.04% to 82.96%
added or “spiked” to another 1 g paste sample and the calculated earlier. Hence, matrix interference is present
developed extraction method was then carried out 5 times, highlighting that paste matrix does have a considerable effect
each time spiking a 1 g sample with the previous amount of on the way microbeads recovery is conducted and the quality
microbeads recovered. This was carried out on each of the of the results obtained. Thus, the standard addition approach
cosmetic face and body scrubs in this study. Thus, must take place for each paste in order to calculate reliable and
quantitative results were generated. Consequently, this accurate microbeads percentage recovery for each commercial
allowed a standard addition graph to be drawn from the paste. The microbeads percentage recovery for Real Shaving
results and therefore allows for the determination of the Co. face scrub and Senspa Detox body scrub are 85.09% and
number of microbeads in the paste without matrix 92.30% respectively (presented in Figures 3-5).
interference.
Evaluation of microbead recovery 5. Conclusion
The microbead percentage recovery generated in the
experimental procedure was carried out without the standard The occurrence of plastic microbeads in PPCPs, such as
addition approach. The procedure generated three values for face and body cleansers, and their usage by millions of
percentage recovery as the process was repeated three times consumers globally, should be of increasing concern to
for reliability. From Table 3, microbead percentage recovery environmental scientists. This research project has developed
from paste samples were calculated as approximately 84%, a cost effective method for the extraction of microbeads from
85% and 74%. Therefore, the average percentage recovery of cosmetic pastes, which consists of the addition of hot
microbeads from paste is 81% according to the procedure distilled water to cosmetic paste (proportion 1:20) and
carried out. The standard deviation of this percentage must passing the mixture through vacuum filtration with a Büchner
then be calculated to generate a range for microbeads funnel of 125 mm diameter in size. It is important to note that
recovery from paste. the proportion of water: paste and the size diameter of the
Büchner funnel must be optimal for the successful
Relative Standard Deviation=Sample / Mean (100%) implementation of the protocol. This extraction has been
Recovery: 81% +/- (4.30 x 0.79%) √3=(81 +/- 1.96%), integrated in a quantitative method based on standard
there 4.30 corresponds to Student’s t-distribution for 95% addition that involves the successive addition of61 Mohammed Yaqob Shareef and Forkan Mohammed Yaqob Shareef: Determination of Microbeads from
Paste in Some Pharmaceuticals and Personal Care Products
commercially available beads. The developed methodology environment: sources (with a specific focus on personal care
may prove to be beneficial for not only environmental products), fate and effects. Environmental Sciences Europe.
2016; 28 (1).
scientists, but also cosmetic companies themselves. Analysis
of plastic microbeads can be carried out to identify the nature [13] Gouin, T., Avalos, J., Brunning, I., Brzuska, K., de Graaf, J.,
of the plastic and the potential harm caused to the marine Kaumanns, J et al. Use of micro-plastics beads in cosmetics
environment. By developing this methodology for the products in Europe and their estimated emissions to the North
Sea environment. SOFW J. 2015; 141, 40-46.
extraction of microbeads from cosmetic pastes, microbeads
were then analysed via infrared and light microscopy to [14] Zitko V, Hanlon M. Another source of pollution by plastics:
obtain both quantitative and qualitative data regarding Skin cleaners with plastic scrubbers. Marine Pollution Bulletin.
microplastics added into cosmetic pastes by manufacturers. 1991; 22 (1): 41-42.
[15] Patel MM, Goyal BR, Bhadada V, Bhatt JS, Amin AF. Getting
into the brain: approaches to enhance brain drug delivery.
References CNS Drugs. 2009; 23 (1): 35–58.
[1] Jambeck J, Geyer R, Wilcox C, Siegler T, Perryman M, [16] Zbyszewski M, Corcoran PL, Hockin A. Comparison of the
Andrady A et al. Plastic waste inputs from land into the ocean. distribution and degradation of plastic debris along shorelines
Science. 2015; 347 (6223): 768-771. of the Great Lakes, North America. J Great Lakes Res. 2014;
40 (2): 288–299.
[2] Wilkinson J, Hooda P, Barker J, Barton S, Swinden J.
Occurrence, fate and transformation of emerging contaminants [17] Galgani F, Hanke G, Maes T. Global distribution, composition
in water: An overarching review of the field. Environmental and abundance of marine litter. In: Bergmann M, Gutov L,
Pollution. 2017; 231: 954-970. Klages M, editors. Marine anthropogenic litter. Berlin:
Springer; 2015. pp. 29–57.
[3] UNEP. Marine plastic debris and microplastics – Global
lessons and research to inspire action and guide policy change. [18] Koelmans AA, Besseling E, Shim WJ. Nanoplastics in the
United Nations Environment Programme, Nairobi. 2016. aquatic environment. Critical review. In: Bergmann M, Gutov
L, Klages M, editors. Marine anthropogenic litter. Berlin:
[4] Bhattacharya P, Lin S, Turner J, Ke P. Physical Adsorption of Springer; 2015. pp. 325–343.
Charged Plastic Nanoparticles Affects Algal Photosynthesis.
The Journal of Physical Chemistry C. 2010; 114 (39): 16556- [19] Habib D, Locke DC, Cannone LJ. Synthetic fibers as
16561. indicators of municipal sewage sludge, sludge products, and
sewage treatment plant effluents. Water Air Soil Pollut. 1998;
[5] Gambardella C, Morgana S, Ferrando S, Bramini M, Piazza V, 103: 1–8.
Costa E et al. Effects of polystyrene microbeads in marine
planktonic crustaceans. Ecotoxicology and Environmental [20] Napper I, Bakir A, Rowland S, Thompson R. Characterisation,
Safety. 2017; 145: 250-257. quantity and sorptive properties of microplastics extracted
from cosmetics. Marine Pollution Bulletin. 2015; 99 (1-2):
[6] Andrady A. Microplastics in the marine environment. Marine 178-185.
Pollution Bulletin. 2011; 62 (8): 1596-1605.
[21] Hintersteiner I, Himmelsbach M, Buchberger WW.
[7] Imhof H, Ivleva N, Schmid J, Niessner R, Laforsch C. Characterization and quantitation of polyolefin microplastics
Contamination of beach sediments of a subalpine lake with in personal-care products using high-temperature gel-
microplastic particles. Current Biology. 2013; 23 (19): R867- permeation chromatography. Anal Bioanal Chem. 2015; 407:
R868. 1253–1259.
[8] Hidalgo-Ruz V, Gutow L, Thompson R, Thiel M. [22] Zubris KA, Richards BK. Synthetic fibers as an indicator of
Microplastics in the Marine Environment: A Review of the land application of sludge. Environ Pollut. 2005; 138: 201–
Methods Used for Identification and Quantification. 211.
Environmental Science & Technology. 2012; 46 (6): 3060-
3075. [23] Dris R, Imhof H, Sanchez W, Gasperi J, Galgani F, Tassin B et
al. Beyond the ocean: contamination of freshwater ecosystems
[9] Thompson RC, Olsen Y, Mitchell RP, Davis A, Rowland SJ, with (micro-)plastic particles. Environmental Chemistry. 2015;
John AW, McGonigle D, Russell AE. Lost at sea: where is all 12 (5): 539.
the plastic? Science. 2004 May 7; 304 (5672): 838.
[24] Wagner M, Scherer C, Alvarez-Muñoz D, Brennholt N,
[10] Arthur, C., Baker, J., Bamford, H., 2009. In: Proceedings of Bourrain X, Buchinger S, et al. Microplastics in freshwater
the International Research Workshop on the Occurrence, ecosystems: what we know and what we need to know.
Effects, and Fate of Microplastic Marine Debris. September 9- Environ Sci Europe. 2014; 26: 12.
11, 2008. University of Washington Tacoma, Tacoma, WA.
Group. 530. [25] Lambert S, Sinclair CJ, Boxall AB. Occurrence, degradation
and effect of polymer- based materials in the environment.
[11] Moore C. Synthetic polymers in the marine environment: A Rev Environ Contamin Toxicol. 2014; 227: 1–53
rapidly increasing, long-term threat. Environmental Research.
2008; 108 (2): 131-139. [26] Hammer J, Kraak MH, Parsons JR. Plastics in the marine
environment: the dark side of a modern gift. Rev Environ
[12] Duis K, Coors A. Microplastics in the aquatic and terrestrial Contam Toxicol. 2012; 220: 1–44.You can also read