Empirical Tests of Stress in Gyroplane Rotor During Flight
←
→
Page content transcription
If your browser does not render page correctly, please read the page content below
Advances in Science and Technology                                                     Received: 2020.04.20
                                                                                                     Revised: 2020.06.15
             Research Journal                                                                      Accepted: 2020.07.10
                                                                                             Available online: 2020.08.01
Volume 14, Issue 3, September 2020, pages 107–117
https://doi.org/10.12913/22998624/120928

Empirical Tests of Stress in Gyroplane Rotor During Flight

Jacek Czarnigowski1
1
    Katedra Termodynamiki, Mechaniki Płynów i Napędów Lotniczych, Wydział Mechaniczny, Politechnika
    Lubelska, ul. Nadbystrzycka 36, 20-618 Lublin, Poland, e-mail: j.czarnigowski@pollub.pl

ABSTRACT
The paper presents the results of experimental investigations of total tensile stresses in a gyroplane’s rotor during
flight. The research aimed to determine which flight maneuvers induce the greatest stress in the rotor blade and the
hub bar. The object of research was an ultralight gyroplane Tercel by Aviation Artur Trendak equipped with a rotor
by the same manufacturer. Measurements were taken a) at the root of the rotor blade in the longitudinal direction,
at the rotor blade’s lower surface in the point where the blade is attached to the hub bar, and b) in the hub bar, on its
lower surface also in the longitudinal direction. To measure the stress, the author constructed an original measur-
ing system based on the strain gauge bridge circuit mounted on the rotor head. The tests were carried out in a wide
range of maneuvers within the gyroplane’s flight envelope. The highest value of tensile stress was found to occur
while rapidly reducing the horizontal velocity in steep descent.

Keywords: gyroplane, rotor blade, hub bar, stress.

INTRODUCTION                                                        It is the role of the design organization to de-
                                                               termine the maximum loads acting on the rotor
     Rotorcrafts are aircraft that generate lift by            and the conditions when they occur. In the case
means of rotors instead of fixed wings [1]. Ro-                of helicopters, there exists some body of litera-
tors are typically composed of two to six blades               ture that identifies the rotor loads (among others
[2, 3] and are the elements that both keep the                 [4, 5, 17, 18]). Experimental and numerical stud-
machine in the air and control the direction of                ies demonstrated that helicopter rotor blades are
its flight [2]. In the case of helicopters, they also          most heavily loaded in hover and during flight
generate thrust [1, 4]. This means that the ro-                with maximum forward speed. Accordingly, the
tor blades are the key elements of the rotorcraft:             blades of the main rotor are tested for strength
their shape determines the flight performance                  mainly in these conditions [7, 19].
as well as safety [4÷10]. Therefore, they are                       However, the gyroplane rotor operates in a dif-
designed for aerodynamics [4, 6÷8] as well as                  ferent way. In flight, it is unpowered and generates
strength [6, 11].                                              lift in autorotation. The rotor blades are thus sub-
     Aircraft certification procedures [12, 13]                ject to centrifugal forces (caused by the rotary mo-
set requirements for rotors demanding, among                   tion of the blades) and aerodynamic forces of the
others, that “Main rotor structure must be de-                 air inflow to the rotor (caused by the movement of
signed to withstand the … critical flight loads”               the aircraft) [1, 20, 21]. The rotor does not transfer
[13], and “Strength requirements are specified                 the propulsive torque producing the thrust as it is in
in terms of limit loads (the maximum loads to                  the case of helicopters [1], and thus the gyroplane
be expected in service) and ultimate load (limit               cannot hover. A question arises, what flight condi-
loads multiplied by prescribed factor of safe-                 tions (which maneuvers) generate the highest loads
ty)” [13]. Therefore, the values of loads on the               on the gyroplane rotors. As no literature was found
rotor’s structure must be defined. This is par-                to provide the answer, the purpose of the research
ticularly important in developing new aircraft                 presented in this paper was to determine these con-
models [14÷16].                                                ditions on the basis of experiments in flight. The

                                                                                                                    107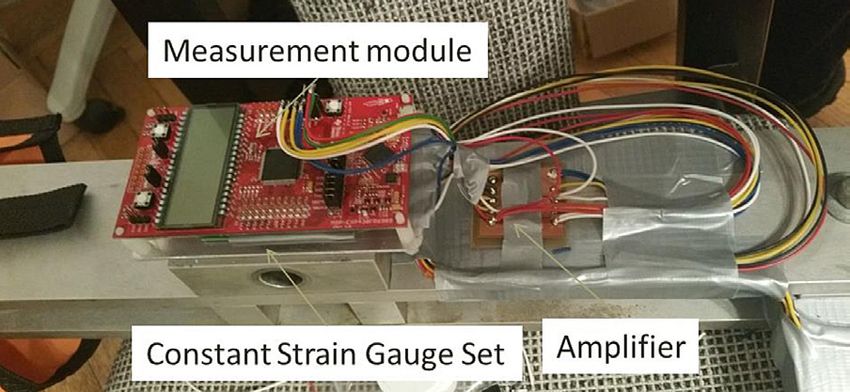
Advances in Science and Technology Research Journal Vol. 14(3), 2020

                                                         Table 1. General characteristics of and
                                                         performance of Tercel gyroplane
                                                          Dimensions, weights and general data
                                                          Cockpit width                           1.36 m
                                                          Fuselage width                          2.35 m
                                                          Overall length (without rotor)          5.04 m
                                                          Overall height                          2.87 m
                                                          Wheel diameter                         350 mm
                                                          Empty weight                            295 kg
                                                          Load capacity                           265 kg
                                                          Maximum take-off weight                 560 kg
                                                          Propeller                         KASPAR Aero 2/3 T
                                                          Propeller diameter                      1.72 m
                                                                                            Aviation Artur Tren-
                                                          Rotor
                                                                                             dak (aluminum)
                                                          Rotor diameter                           8.6 m
           Fig. 1. Tercel gyroplane (cour-                Disk area                              58.06 m2
           tesy of Aviation Artur Trendak)
                                                          Engine                               CA 912 ULT
                                                          Power                             122 HP at 5800 rpm
                                                          Fuel consumption                         20 l/h
tests followed the methodology presented in [5]
                                                          Performance
and were modernized by applying digital measure-
ment and data recording techniques.                       Never exceed speed                     200 km/h
                                                          Maximum structural
                                                                                                 130 km/h
                                                          cross-country speed
                                                          Maneuvering speed                      90 km/h
THE OBJECT AND SCOPE OF RESEARCH
                                                          Minimum speed                          60 km/h
                                                          Climbing speed                          6,1 m/s
The object of research                                    Ceiling                                 4500 m

     The tests were conducted on a particular model
of an ultralight gyroplane, Tercel by Aviation Artur
Trendak, a two-seat machine in a side-by-side con-       Table 2. Characteristics of the rotor blade
figuration (Figure 1). Its main structural compo-         Airfoil type                         NACA 8H12
nent is a composite fuselage made of carbon fibre         Chord                                  200 mm
type Havel 160g/mm2 and carbon Kevlar Havel               Rotor diameter                         8600 mm
165 g/mm2 with a 2 mm Lantor Soric core with              Angle of incidence                        5°
e-nova ma6325 vinylester resin. The hull is made                                              Aluminum EN
                                                          Material
by infusion.The keel is composed of a pair of slen-                                           AW-6005A T6
der aluminum beams. The vertical twin fins of the         Tensile strength Rm                    276 MPa
tail are the aircraft’s vertical stabilizers and sup-     Proportional elastic limit with
                                                                                                 265 MPa
port the rudder. The horizontal stabilizer of a sym-      an elongation of 0.2% Rp0.2
metrical section with winglets is mounted on top of       Elongation A                             8,8%
the vertical fins. All these elements are composite
structures. Tercel is powered by a CA 912 ULT en-
gine (a Rotax 912 UL engine modified by Aviation         of extruded aluminum. Their hollow profiles have
Artur Trendak with an Iveco turbocharger). The           uniform cross-section and uniform angle of inci-
aircraft is equipped with a three-blade composite        dence along the whole length.
Kaspar Aero 2/3 LT propeller of a manually adjust-
able pitch, and a rotor manufactured and balanced        Measuring system
by Aviation Artur Trendak. Selected parameters of
the aircraft are listed in Table 1.                          The tests were to determine the level of ten-
     The rotor is composed of two blades con-            sile stress at the most heavily loaded points of
nected by a straight hub bar. The blades are made        the blade and in the hub bar. For this purpose,

108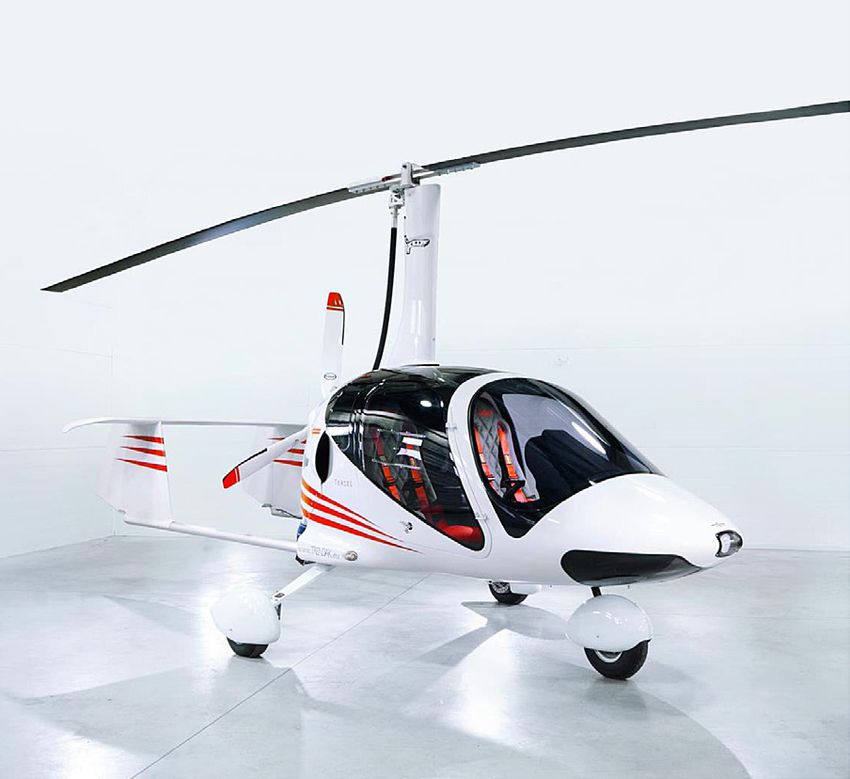
Advances in Science and Technology Research Journal Vol. 14(3), 2020

                                                             Table 3. Characteristics of TFs10/350 sensor
                                                              Resistance                     350Ω (±0,2%)
                                                              Gauge width                    4.6 mm
                                                              Gauge length                   15.0 mm
                                                              Gauge thickness                60 µm
                                                              Operating temperature range    -40 ÷ 200 °C
                                                              Gauge factor (GF)              2.1 ÷ 2.2 (±0.5%)
             Fig. 2. Location of sensors
                                                              Temperature coefficient
                                                                                             0.04x10⁻³/°C
                                                              of resistance (TCR)

Tenmex TFs10/350 strain gauges were used
(technical data in Table 2), selected on the ba-
sis of the expected stress range and the range of            dummy gauges are deemed the same). Therefore,
resistance of the measuring system. In the case              two values of UB and UM were measured.
of the rotor blade, the strain gauge was fastened                The measurement system was equipped with
to its bottom surface, at the point located 5 mm             a differential amplifier of the author’s own de-
from the edge of the hub bar in the neutral axis             sign. The results were recorded by means of
of the blade (i.e. in the line of screws that fasten         MSP-EXP430FR6989 evaluation module (Tex-
the blade to the hub bar). The other gauge was               as Instruments). The evaluation module was
attached to the bottom surface of the hub bar at             mounted on the hub bar directly above the teeter
the point located in the neutral axis of the rotor           bolt of the rotor head (so in the rotor’s axis of
blade, 20 mm from the axis of rotation, as illus-            rotation), the amplifier was placed on one arm
trated in Figure 2.                                          of the hub bar, and the measurement system’s
     The measurements were taken by means of a               power supply (a lithium-ion battery: 1000 mAh,
circuit in a quarter-bridge configuration type II as         9V) was located on the other arm. The reference
presented in Figure 3. Identical strain gauges TFs-          strain gauges R3 and R4 were placed directly
10/350 were used as all resistors in the circuit:            under the evaluation module. The signals were
•• R1 as the active strain gauge to measure strain           registered with a constant frequency of 10Hz
    along the element in question,                           during the whole test flight.
•• R2 as a passive resistor to complete the volt-                The strain readings needed to be matched
    age divider circuit (dummy resistor) mounted             with the flight parameters. As the aircraft was not
    in a close thermal contact with R1, but placed           equipped with any navigation nor flight param-
    in transverse direction to the tensile strain, and       eter recording system, an external device was used,
    not bonded to the element,                               namely the Garmin D2 Bravo pilot watch. The flight
•• R3 and R4 to complete the bridge.                         parameter records comprised: the flight altitude
     This configuration of identical sensors helps           (measured on the basis of a pressure sensor with
minimize the effect of temperature changes on                correction of base pressure with GPS), the ground
the results (the temperatures of the active and the          speed (GPS-based), and the direction of flight (GPS-
                                                             based), and were taken with the frequency of 1 Hz.
                                                             The flight parameter and the stress data streams
                                                             were synchronized on the basis of a timestamp.

            Fig. 3. Strain gauge configura-                          Fig. 4. The rotor head armed with ele-
           tion of the measurement system                               ments of the measuring system

                                                                                                                 109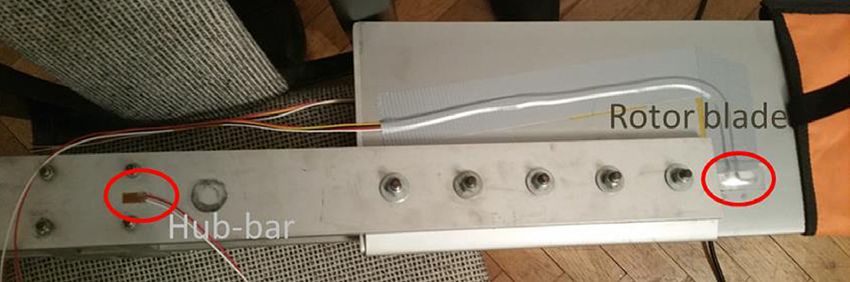
Advances in Science and Technology Research Journal Vol. 14(3), 2020
Fig. 5. Path of the test flight
Test flight low, the author assumed that the ground speed
is close enough to the airspeed to treat them as
The tests flight was a loop (Figure 5) starting equal. Therefore, further analysis rested upon the
at Baranów airfield (N52°07’19.5” E20°28’54.3”; GPS-based ground speed measurement.
Elevation: 295 ft;). It took place on March 1, 2017, The assumption was to measure the rotor
courtesy of and in cooperation with the manufac- blade and hub bar stresses during a variety of
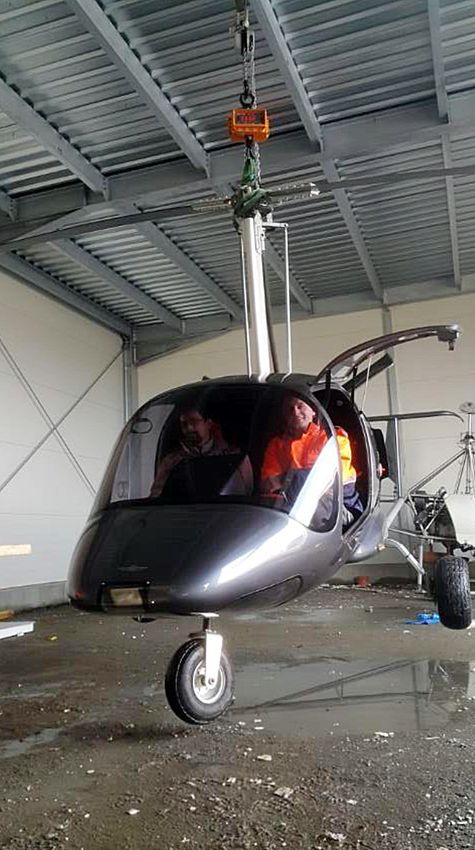
turer of the gyroplane. The gyroplane was loaded
typical maneuvers within the aircraft’s flight en-
to its maximum take-off weight of 560 kg (empty
velope. The test flight included: engine warm-up,
weight of the aircraft, two crew members, 100 kg
taxiing, prerotation, take-off, climb-out, maneu-
of fuel, topped up with sandbags), what was con-
vers at different speeds including straight-and-
firmed by weighting the loaded machine (Figure
level flight with the maximum speed, climbs, de-
6). The total flight time was 26 minutes. The max-
scents, approach to landing, and landing.
imum altitude was 300 m and the flight speed up
to 172 km/h. The air temperature was 8°C, the air
pressure 988 hPa, the maximum wind speed 0.2
m/s in direction 340. As the wind speed was very RESULTS
Figure 7 presents the synchronized readings
of the hub bar and rotor blade stresses and the
flight parameters. In general, the rotor blade was
subject to greater tensile stress than the hub bar:
once in the air, the hub bar stress ranged from 45
to 92 MPa, whereas the rotor blade stress was be-
tween 68 and 121 MPa.
To determine which phase of the flight gen-
erated the highest tensile stress in the rotor, To
determine which phase of the flight generated the
highest tensile stress in the rotor, the author ana-
lyzed the individual maneuvers in detail.
Figure 8 shows the first 500 seconds of the
test. The engine started in the 30th second. The
engine warm-up phase lasted until 260th second
(aircraft on the ground with the rotor still, hence
the stresses are negligible, and the recorded fluc-
tuations result from the vibrations of the aircraft
caused by the engine operation). After the engine
temperature reached the required level, the pilot
taxied to the runway with a speed of about 20
km/h (260th – 390th second of the test). The air-
craft movement along the bumpy surface of the
Fig. 6. Weighting the gyroplane grass airstrip generated oscillations of the rotor
110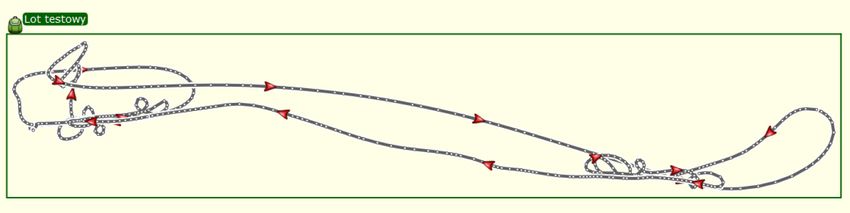
Advances in Science and Technology Research Journal Vol. 14(3), 2020

             Fig. 7. Hub bar and rotor blade tensile stress and the flight parameters during the test

      Fig. 8. Stresses against flight parameters             Fig. 9. Stresses against flight parameters at prerota-
        at engine start, warm-up, and taxiing                   tion, ground roll, liftoff, climb and first turns

and stresses of ±15 MPa in the rotor blade and             airplane did not change the position (warm-up,
±12 MPa in the hub bar. The next period (390th –           preparation for the start).
460th second of the test) corresponds to the prepa-             Figure 9 refers to the take-off phase. The pre-
ration for the start - the gyroplane stopped at the        rotation took place between the 460th and 537th
beginning of the runway; in this phase, the rotor          second of the test; the aircraft was standing at the
was subject only to small oscillations and stresses        beginning of the runway with the rotor, temporar-
caused by the operation of the engine. However,            ily powered by the main engine, accelerating to
during the entire phase prior to prerotation, there        about 210 rpm. This generated a stress of 45 MPa
was a static stress in the rotor blade of about -2         in the rotor blade and 20 MPa in the hub bar. Once
MPa resulting from its bending downwards due               the rotor speed reached the level of 210 rpm., the
to gravity. This was observable especially as the          prerotator was disengaged and the ground roll

                                                                                                                111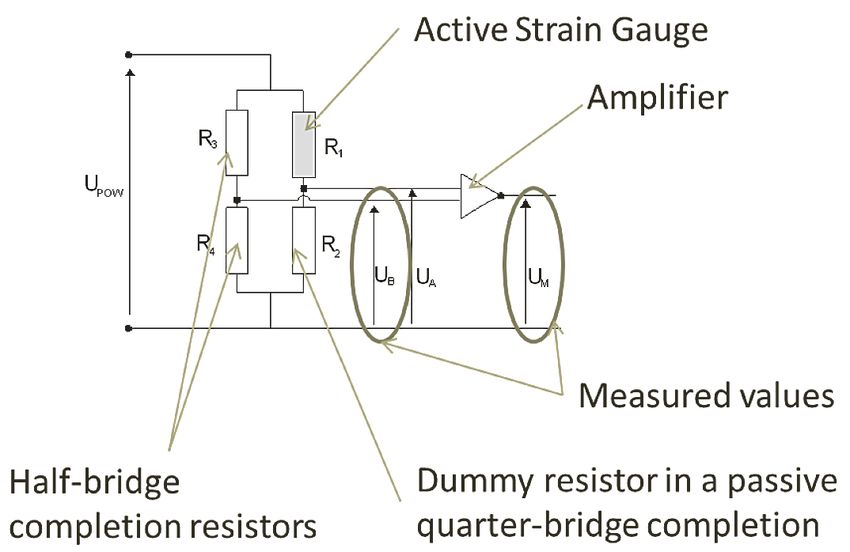
Advances in Science and Technology Research Journal Vol. 14(3), 2020

      Fig. 10. Stresses against flight parameters                  Fig. 11. Stresses against flight pa-
        at tight S-turns with changing speed                            rameters at steep descent

began (537th - 560th second of the test): the air-       the hub bar (80 MPa), with the respective mean
craft accelerated on the runway to about 85 km/h,        values of 94 and 69 MPa. As the pilot strived to
the rotor accelerated further to 320 rpm due to          keep the altitude constant, the loss of lift due to
airflow caused by the aircraft movement and, as          tilting of the rotor for turn resulted in the reduc-
the rotor speed produced enough lift, the machine        tion of forward speed. During these maneuvers,
lifted off. During the ground roll, the stress grew      the kinetic energy of the aircraft was used with-
to 90 MPa in the blade and 59 MPa in the hub bar,        out a significant change in the kinetic energy of
growing to 103 and 69 MPa, respectively, at the          the rotor’s rotation.
moment of lift-off. Next, the gyroplane climbed               The maneuvers to follow resulted in strong
(560th-600th second), took the first turn (600th-        fluctuations of the rotor stress. Between the 810th
620th second), leveled (620th-635th second), and         and 860th second of the test, the pilot reduced the
climbed whilst turning (635th-680th second). In          forward speed by tilting the rotor rearward. This
this phase of flight, the stresses were quite stable     maneuver is used to descend steeply. Increasing
(about 87 MPa in the blade and 57 MPa in the             the angle of attack in forward flight generates
hub bar) with momentary peaks not exceeding,             drag, and the effect is boosted by the airflow’s in-
respectively, 93 and 64 MPa.                             creasing the rotor speed. Thus, the kinetic energy
     Figure 10 presents the phase of rapid ma-           of the aircraft’s forward flight is turned into the
neuvers. Between second 650 and 680, the gy-             kinetic energy of the rotor disc.
roplane took a steep climb losing speed; the al-              The effect was reflected in changes of the
titude rose by 100 m whereas the forward speed           rotor blade and hub bar stresses: a rapid increase
dropped by 45 km/h. Next, the airplane leveled           of the angle of attack (800th, 823rd, 837th, 850th
off and accelerated to the minimum cruising              second of the test) resulted, with a two-second
speed of 60 km/h (680th-720th second). During            delay, in peaks of stress in the rotor blade (up to
these maneuvers, the stresses in the rotor blade         120.6 MPa) and the hub bar (89.9 MPa). These
and the hub bar were stable and close to 90 MPa          2 seconds corresponded to the time for build-
and 60 MPa, respectively. This phase was fol-            ing up the kinetic energy of the rotor disc. As
lowed by a series of tight level turns (720th-780th      the aircraft slowed down in its forward move-
second) with a considerable loss of speed. The           ment, the airflow acting on the rotor was re-
first two turns were conducted with the speed of         duced, decreasing the lift and the autorotation
22 deg/s, clockwise and counter-clockwise. Ini-          force. Thus, the kinetic energy of the rotor was
tiating the turns generated a momentary increase         consumed: the rotor speed decreased and the
of stress in the blade (up to 109 MPa) and in            stresses dropped.

112
Advances in Science and Technology Research Journal Vol. 14(3), 2020
Fig. 12. Stresses against flight parameters at Fig. 14. Stresses against flight parameters at
straight-and-level flight with maximum speed straight-and-level flight with moderate speed
The subsequent phase of the test was a gentle The further element of the test consisted in
climb followed by a straight-and-level flight to slowly reducing the speed and ten performing
reach the maximum cruising speed of 190 km/h a slow turn at increased forward speed (Fig-
(the 880th - 970th second of flight in Figure 12). ure 13). Between the 980th and 1050th second
The stresses remained relatively stable with the of the test, the flight was practically straight
mean values of 87 MPa for the rotor blade and 66 and level with the speed dropping steadily to
MPa for the hub bar. As for the maximum stress, 90 km/h. The stresses in the rotor blade and
it reached 105 MPa in the blade and 82 MPa in the hub bar stayed close to the stresses of the
the hub bar. The forward speed practically does previous phase, with the means of 89.5 MPa
not influence the stresses in the rotor. and 70 MPa, and the maximum values of 99.3
Fig. 13. Stresses against flight Fig. 15. Stresses against flight
parameters at gentle turn parameters at landing and taxiing
113Advances in Science and Technology Research Journal Vol. 14(3), 2020
MPa and 79.2 MPa, respectively. Between the
1080th-1100th second of the test, a U-turn was
performed with the rate of 15 deg/s, and with
a drop of speed and altitude to maintain the ki-
netic energy of the rotor. In the course of the
U-turn, the stresses in the rotor grew as a result
of associated centrifugal forces. The maximum
stress reached 119.3 MPa in the rotor blade and
88.2 MPa in the hub bar. The mean values were,
respectively, 97 MPa and 76 MPa.
The next element of the test was again a
straight-and-level flight, this time at a constant
Fig.17. Histograms of the rotor blade and
speed of about 100 km/h (Figure 14). As in the
the hub bar tensile stress in flight
case of previous phases of flying with a constant
heading and constant altitude, the mean stress
during this period (between the 1150th and the stresses during the preparation for flight, taxiing,
1250th second) stabilized at a moderate level of 91 preparation for take-off, and taxiing after landing,
MPa for the rotor blade and 68 MPa for the hub as these operations have a considerable share in
bar. The stresses did not exceed 101 MPa (rotor the test duration). The other peak corresponds to
blade) and 78 MPa (hub bar). high stress during most of the maneuvers in the
The final stage of the test comprised land- air. The transition phase is practically negligible
ing and taxiing (Figure 15). Between the 1260th in terms of frequency of occurrence.
and the 1280 second, the aircraft was brought The actual flight (the air phase of the test),
to a descent solely by adjusting the rotor disc shown in Figure 17, is worth an individual con-
attitude. This maneuver was conducted more sideration. The hub bar stress ranged from 52 to
gently than in the previous case of a steep de- 88 MPa, and its median was 66.1 MPa. As for the
scent (the 810th – 860th second, Figure 11); rotor blade, the range of stress values was broader
therefore, the increase in rotor stress was small- (72-119 MPa) with a median of 89.3 MPa.
er: the maximum observed values were 109.8 The next part of the analysis relates the
MPa in the rotor blade and 82.3 MPa in the hub stresses to the flight parameters. Figure 18 pres-
bar. After reaching the altitude appropriate for ents the relationship between the stress and the
the final approach (second 1280), the last turn altitude. The fact that greater rotor blade and hub
was made to align with the runway. The engine bar stresses were recorded at higher altitudes was
power was reduced and the aircraft descended not the results of the altitude actually affecting
to touchdown (between 1285th and 1300th sec- the rotor load, but from the fact that most maneu-
ond). During this period, the rotor stresses were vers were performed higher above the ground for
stable and their values corresponded to those at safety reasons. In the case of this particular test,
the straight-and-level flight. After touchdown
on second 1300, the rotor speed was reduced
(the stresses drop). On second 1320, the rotor
stopped completely, and the stresses were due
to the rotor blade swinging as the aircraft taxied
along the uneven airstrip.
RESULT ANALYSIS
The first step was to analyze the distribution
of the rotor stress recorded during the whole ex-
periment. Figure 16 presents the tensile stress his-
tograms for the rotor blade and the hub bar. Clear-
ly, the distributions are bimodal. The first con- Fig. 16. Histograms of the rotor blade and the
centration of results occurs around 0 MPa (low hub bar tensile stress over the entire test
114Advances in Science and Technology Research Journal Vol. 14(3), 2020
Fig. 18. Rotor blade and hub bar Fig. 20. Rotor blade and hub bar
tensile stress vs. altitude tensile stress vs. vertical speed
conducted in the range of 90-400 m above the sea The aircraft’s horizontal acceleration seemed
level, the effect of altitude was insignificant. to have little effect on tensile stresses in the hub
As illustrated by Figure 19, the greater the bar and the rotor blade (Figure 21). The calcula-
ground speed, the higher the mean stress in the tion of horizontal acceleration based on changes
rotor. In the case of the rotor blade, the differ- in the ground speed. The pattern of distribution
ence in the mean stress at the ground speed of of stresses against horizontal acceleration was,
50 km/h and 170 km/h was 7 MPa. For the hub in general, similar to the pattern of stress vs. ver-
bar, the same speed difference corresponded tical speed: symmetrical about the vertical axis.
to the mean stress raising by 10 MPa. This is However, attention should be paid to the upper
most likely due to an increase in airflow velocity left corner of the graph: the maximum stresses
around the blades. in both the rotor blade and the hub bar are re-
Figure 20 shows the relationship between lated with strong deceleration in the forward
the stresses and the aircraft’s vertical speed. The motion of the aircraft. These cases correspond
vertical speed was calculated on the basis of to the maneuver of decelerating by using rotor
changes in the altitude. The vertical speed prac- drag (the test phase illustrated by Figure 11).
tically does not influence the rotor stresses: the Therefore, the greater tensile stress in the rotor
stress distribution is practically symmetric about is associated with slowing down by adjusting the
the vertical axis. rotor disc attitude.
Fig. 19. Rotor blade and hub bar Fig. 21. Rotor blade and hub bar
tensile stress vs. ground speed tensile stress vs. horizontal acceleration
115Advances in Science and Technology Research Journal Vol. 14(3), 2020
CONCLUSIONS Acknowledgements
The in-flight test of tensile stresses in a gyro- The research was financed in the framework
plane rotor provided insight into the effect of par- of the project Lublin University of Technology
ticular maneuvers on rotor loads. The test covered - Regional Excellence Initiative, funded by the
a full range of speed within the flight envelope Polish Ministry of Science and Higher Education
of a particular model of a gyroplane loaded to its (contract no. 030/RID/2018/19)
maximum take-off weight. The results justify the
following conclusions:
1) Greater tensile stress was observed in the rotor REFERENCES
blade than in the hub bar. The median stress
values (during the aircraft in the air) were: 89.3 1. US. Departmente of Transportation Federal Aviation
MPa in the rotor blade and 66.1 MPa in the Administration, Rotorcraft Flying Handbook. 2000.
hub bar. These medians equaled the stresses 2. U.S. Department of Transportation Federal Avia-
observable during the straight-and-level flight tion Administration, Helicopter Flying Handbook,
at cruising speed. vol. 1. 2012.
2) The mean stress during the straight-and-level 3. U.S. Department of Transportation Federal Avia-
flight was stable and only slightly affected by tion Administration, Aviation Maintenance Techni-
the speed. An increase in flight speed resulted cian Handbook - Powerplant vol. 2, vol. 2. 2012.
in growing stress, but an increase in speed from 4. Mil’ M.L. et al., Helicopters - calculation and de-
50 to 170 km/h changed the stress by only sign Vol. 11. Vibrations and Dynamic Stability
7MPa in the rotor blade, and by 10 MPa in the (NASA TT F-519), 1997.
hub bar. 5. S.A. Division, U.A. Corporation, and N. Aeronau-
3) The maneuver associated with the greater rotor tics, Contractor report NASA CR-2225 analysis of
stress was found to be the deceleration by in- helicopter maneuver-loads and rotor-loads flight-
creasing the rotor disc’s angle of attack, applied test data, by Edward A. Beno Sikorsky Aircraft Di-
in steep descents and landings. The maximum vision United Aircraft Corporation, 1973.
stresses recorded in the case of this maneuver 6. Yeo H., Design and aeromechanics investigation of
in the rotor blade and the hub bar were 120.6 compound helicopters, Aerosp. Sci. Technol., vol.
MPa and 89.9 MPa, respectively. 88, pp. 158–173, 2019.
4) It is therefore clear that the maximum stresses 7. Gao H., A. He, Z. Gao, Y. Na, And Y. Deng, Flight
in the dynamic states are about 35% higher dynamics characteristics of canard rotor/wing air-
than in the steady states. Therefore, an over- craft in helicopter flight mode, Chinese J. Aero-
load factor of 1.4 can be assumed for the de- naut., vol. 32, 2019, 1577–1587
sign of new structures. 8. University of Twente, Smart helicopter thanks to
5) It should also be noted that, for the structure active rotor blades, 2013.
under test, the maximum stress value has ap- 9. Islam M.T., M. S. Rabbi, and M. S. Uddin, Noise re-
proached the limit values significantly. This duction of helicopter rotor blades by using spoiler.
means that the structure has been designed cor- In: AIP Conference Proceedings, 2019, vol. 2121.
rectly but has practically no margin of error for 10. Shi Y., T. Li, X. He, L. Dong, and G. Xu, Helicopter
dispersion of material properties or manufac- rotor thickness noise control using unsteady force
turing defects. Therefore, a control of the mate- excitation, Appl. Sci., vol. 9, no. 7, 2019.
rial supply during production is critical and the 11. Serafini J., G. Bernardini, R. Porcelli, and P. Ma-
introduction of a maintenance inspection of the sarati, In-flight health monitoring of helicopter
blade condition at the tested point is required. blades via differential analysis, Aerosp. Sci. Tech-
The results are the basis for planning further nol., vol. 88, 2019, 436–443.
experiments. The first scope of work to be carried 12. European Aviation Safety Agency, and Acceptable
out is to relate the stresses in the blade to the rota- Means of Compliance for Light Sport Aeroplanes
tional speed of the main rotor and its angular ac- CS-VLR, ED Decision 2018/015/R, no. December,
celerations. For this purpose, the whole envelope p. 76, 2018.
of the flight conditions should be re-examined by 13. European Aviation Safety Agency, Certification
measuring both stresses and rotor speed. This will specifications and acceptable means of compli-
determine the effect of the centrifugal force on ance for Small Rotorcraft CS-27, ED Decision
the stress value. 2019/013/R, no. July, p. 225, 2019.
116Advances in Science and Technology Research Journal Vol. 14(3), 2020
14. Degu Y.M. and D. Alebel, Design of Composite 18. Warwick G., Leonardo to Flight Test Active Rotor
Gyrocopter Main Rotor Blade Involving Rib and Blade, The Weekly of Business Aviation, 2016.
Spar Elements, vol. 9, no. 2, 2019, 97–106. 19. Han D., V. Pastrikakis, and G. N. Barakos, Helicop-
15. Reddy M., Aerodynamic Load Estimation of He- ter flight performance improvement by dynamic
licopter Rotor in Hovering Flight, J. Aeronaut. blade twist, Aerosp. Sci. Technol., vol. 58, 2016,
Aerosp. Eng., vol. 05, no. 01, 2015, 1–5. 445–452.
16. Stalewski W. and W. Zalewski, Performance im- 20. McCormick B.W., A numerical analysis of auto-
provement of helicopter rotors through blade rede- gyro performance, in 2002 Biennial International
signing, Aircr. Eng. Aerosp. Technol., vol. 91, no. Powered Lift Conference and Exhibit, 2002.
5, 2019, 747–755. 21. Gausz Z. and T. Gausz, Aeromechaincal model for
17. Pastrikakis V.A., R. Steijl, and G. N. Barakos, Ef- gyroplane rotors, in Proceedings of the Mini Con-
fect of Active Gurney Flaps on Overall Helicopter ference on Vehicle System Dynamics, Identification
Flight Envelope, Aeronaut. J., 2016. and Anomalies, 2012, Novem, 29–38.
117You can also read