A Fatigue Evaluation Method for Radial Tire Based on Strain Energy Density Gradient
←
→
Page content transcription
If your browser does not render page correctly, please read the page content below
Hindawi
Advances in Materials Science and Engineering
Volume 2021, Article ID 8534954, 12 pages
https://doi.org/10.1155/2021/8534954

Research Article
A Fatigue Evaluation Method for Radial Tire Based on Strain
Energy Density Gradient

 Chen Liang ,1 Zhi Gao ,1 Shengkang Hong,1 Guolin Wang,1
 Bentil Mawunya Kwaku Asafo-Duho,1 and Jieyu Ren2
 1
 School of Automotive and Traffic Engineering, Jiangsu University, Zhenjiang 212013, China
 2
 Zhejiang Wanxiang Marelli Shock Absorbers Co.,Ltd., Zhenjiang 212013, China

 Correspondence should be addressed to Chen Liang; liangchen@ujs.edu.cn

 Received 28 June 2020; Revised 8 February 2021; Accepted 25 February 2021; Published 5 March 2021

 Academic Editor: Davide Palumbo

 Copyright © 2021 Chen Liang et al. This is an open access article distributed under the Creative Commons Attribution License,
 which permits unrestricted use, distribution, and reproduction in any medium, provided the original work is properly cited.
 Vehicle tires are major components that are subjected to fatigue loading and their durability is of economic interest as it is directly
 related to the safety of property and the life of producers and consumers. Tire durability is also a major issue of energy
 conservation and environmental protection. This research aims to establish a reasonable fatigue evaluation and optimization
 method that effectively improves tire fatigue life. In the study, 11.00R20 and 12.00R20 all-steel radial truck tires were the research
 objects, and the guiding hypothesis for the research was that “the maximum area of the strain energy density gradient modulus
 corresponds to the initial failure area, its direction corresponds to the crack propagation direction, and also the maximum strain
 energy value is inversely proportional to the tire fatigue life.” Through finite element analysis and durability test, the strain energy
 density gradient was determined as tire fatigue evaluation index, and the hypothesis of tire fatigue life prediction was validated. At
 the same time, the sensitivities of strain energy gradient to the tire structure parameters were calculated. Besides, the relationship
 between the structure parameters and the fatigue life was as well established in this paper. This study has formulated a tire fatigue
 evaluation method and proposed an effective optimization method for enhancing tire fatigue life. The results obtained are of high
 application value in offering guidance for tire structural design and useful for refining the fatigue failure theory of truck radial tires
 and improving durability.

1. Introduction [3]. J. Su invented an automobile tire life detection system,
 made up for the shortage of automobile tire life detection
The durability of TBR (Truck Bus Radial) tire is directly equipment [4]. GR. Li invented a tire pattern to improve the
related to the economic benefits of tire producers, consumer tire life, which can not only ensure the mileage of the tire but
satisfaction, and safety. At the same time, it is a major factor also effectively improve the heat dissipation performance,
for energy saving and environmental protection [1]. Tire thereby improving the tire tread life [5]. Chen invented a
engineers, in line with the empirical standard tire fatigue method for evaluating the adhesion life of steel cord in radial
failure test, usually use the drum test bench to understand tire and found the relationship between the content of el-
and evaluate the durability of tire [2] but rely on a single test emental metals and the life of adhesion by chemical analysis
which is not a comprehensive evaluation of the durability of so that the life of bonding force can be judged and provided
the tire. Aside, this approach does not provide enough the judgment basis for tire fault analysis [6]. Goku Shunsuke
flexibility in the tire structure design process, and the longer invented a tire carcass life prediction system for predicting
test time as well as high economic cost makes it unattractive. the remaining tire carcass life against the carcass in the tire
 Jin invented equipment and used it to estimate tire life, and predicted the remaining driving distance according to
issue alarm signal for changing tire, according to the tire the tire internal pressure and temperature and the physical
pressure and temperature, and tire location identification attribute value of the carcass structure component [7].
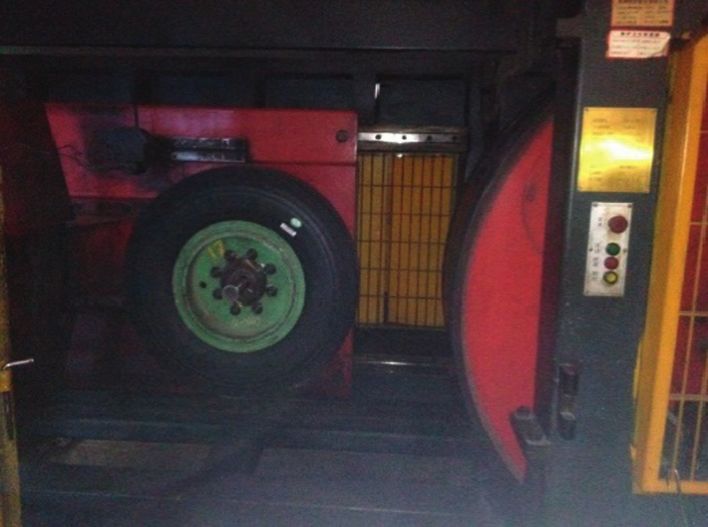
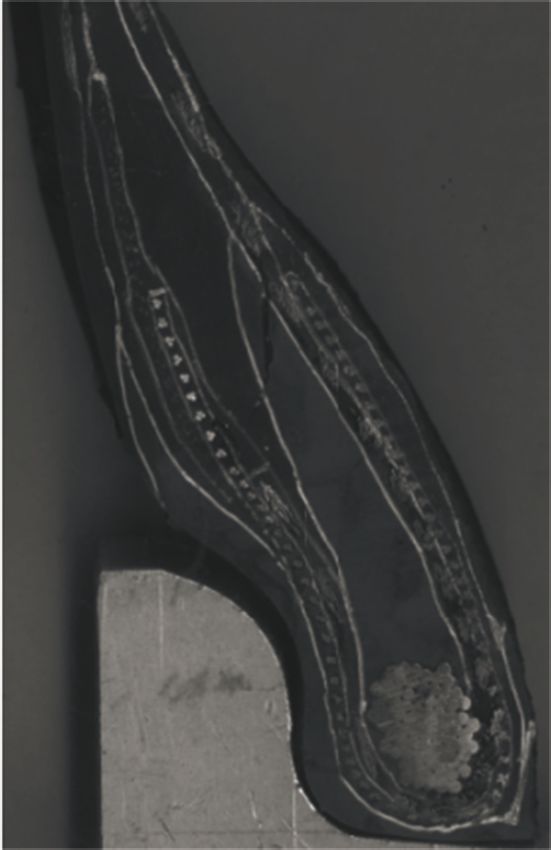
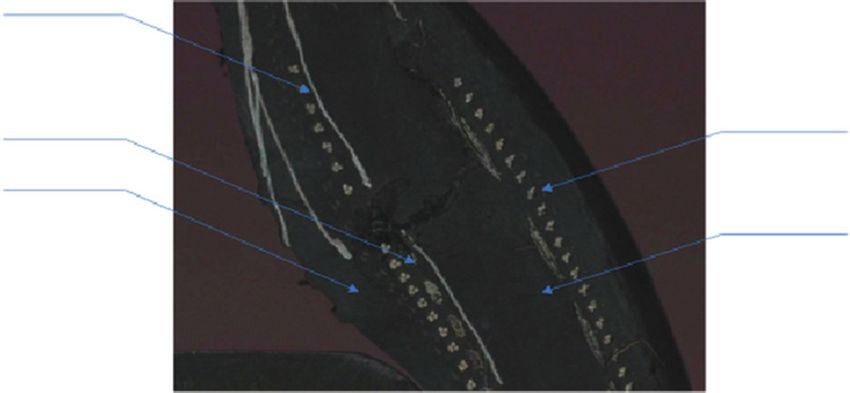
2 Advances in Materials Science and Engineering

 The fatigue life of the tire is composed of crack forming The fatigue evaluation and sensitivity analysis proposed
and crack propagation. At present, the strain energy density in this paper have the object of solving the failure strain
(SED) is used as the evaluation index of tire fatigue life and energy density gradient sensitivity of structure parameters
structural optimization at home and abroad, and the em- through seeking the most sensitive parameters of tire
pirical formula for the tire life and strain energy density is structure design in order to promote TBR tire fatigue du-
established [8–13]. However, this method cannot predict the rability by optimizing the sensitive parameters. According to
direction of crack propagation, and the empirical formula the simulation results of tire performance, the tire pro-
ignores the difference of tire structure, making it impractical; duction process was adjusted; the test tire was then produced
literature [14–19] uses the virtual crack closure technique after which a durability test was carried out. The experi-
(VCCT) based on fracture energy density or strain energy mental results show that the optimized scheme can signif-
release rate to predict the crack propagation direction ef- icantly improve the fatigue life of the tire, which proved that
fectively, while it requires the initial crack, and the influence the proposed method in this paper is feasible to evaluate and
of the initial crack location on the calculation results cannot predict the durability of the tire. A simple process chat for
be ignored. Ebbott [20] first used VCCT for truck tire du- the test and analysis carried out in the paper and their
rability and Zhong [21] applied more complex fatigue and purpose is shown in Figure 1.
fracture treatments; SOUTH [22–26] studied the formation
and propagation of cracks between two layers of rubber with 2. Tire Durability Test
cord and predicted the fatigue life by S–N test curve and
finite element analysis (FEA). However, the fatigue life curve In this study, the tire durability test was carried out using the
of the tire using S–N has a long test period and high cost, tire fatigue durability tester. A real fatigue test stand with a
which limits its application; Liu Yuyan used the damage mounted tire is shown in Figure 2. The TBR tires 11.00R20
mechanics method while considering the loading frequency, and 12.00R20 are the test tire. The tire test conditions are
mean stress, stress amplitude, and fatigue effect of the usually harsh conditions such that the applied load is twice
heating process on fatigue life [27–29] to establish the the rated load value of the tire. These harshly applied
damage evolution equation and the fatigue life prediction conditions are used in order to shorten the test time and save
equation of rubber composites; Tian Zhenhui of China the cost of the trial process [33]. Refer to Table 1, for the
Earthquake Administration Institute of engineering me- details of the harshly applied conditions.
chanics and Tan Huifeng et al. of Harbin Institute of At the end of the experiment, the tire sections were cut
Technology Composite materials research [30] conducted an for subsequent modeling and analysis. A total of five (5)
experiment and found that the variation of the cyclic 11.00R20, eight (8) 12.00R20, and two (2) 255/70R22.5 tires
maximum strain of the double layer rubber composite with were subjected to the fatigue endurance test. By observing
the cycle times follows the law of the three stages. the failure forms of each tire, it was found that the specific
 To sum up, there are many methods employed to study failure parts and the direction of crack propagation are
the fatigue failure of the tire, each has its own advantages and different, yet the failure mode is mainly composed of tire
disadvantages, with the main problem being the limitations bead and shoulder crack, indicating that it is difficult to
of each method and the vast discrepancy between study study the fatigue durability of tire by the VCCT method.
results and the actual fatigue failure phenomenon of the tire. However, this method needs to set the initial crack during
The dimensionless parameter, strain energy density gradient tire modeling. It is difficult to match the actual failure forms
(SEDG), has been successfully applied in the dam strength of the tire with the tire model. At the same time, this will take
and earthquake prediction [31] and was used to predict the a lot of time, so this method is not used in this article.
failure modulus and failure strength of concrete and geology, The section of a test tire is shown in Figure 3, while
but it has not been reported in tire fatigue life analysis and Table 1 shows the main failure forms of tires and test results.
prediction. In this paper, the TBR tires 11.00R20 and As shown in Table 1, in order to further prove the ef-
12.00R20 are the research object. At the same time, the strain fectiveness of the proposed fatigue evaluation using the
energy density gradient model was adopted to study the SEDG method, the above process is repeated for each test
fatigue durability of the tire by calculating and describing the tire to verify whether the initial failure location and crack
strain energy density distribution and gradient of the tire direction obtained by the method are consistent with the
using finite element analysis and numerical analysis. The actual damage form. The main failure forms of tires are left
results show that the maximum value of strain energy bead area crack, right bead area crack, right shoulder area
density gradient corresponds to the initial failure zone, and crack, left and right bead areas crack, and right bead area
its direction corresponds to the crack direction. crack.
 Tire designers usually employ the trial-and-error
method to adjust the structure of the material parameters to 3. The FE Model
improve tire durability. As a result, the design work is in-
efficient and expensive. In the literature [32], the sensitivity There are lots of approaches mentioned in research on how
analysis of tire material was carried out to establish the to build tire FE (finite element) model [34–39]. In order to
relationship between tire fatigue life evaluation index and obtain the actual structure of the tire, all the tires were cut
rubber material parameters with a focus on investigating the after the durability test. The geometry of the tire is based on
influence of different parameters on fatigue life. the test tire section cut from the tire wire cutter. After getting
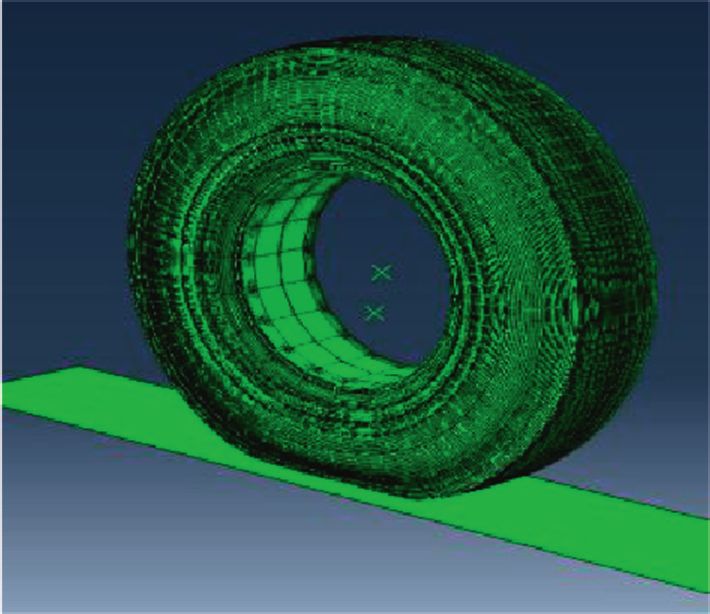
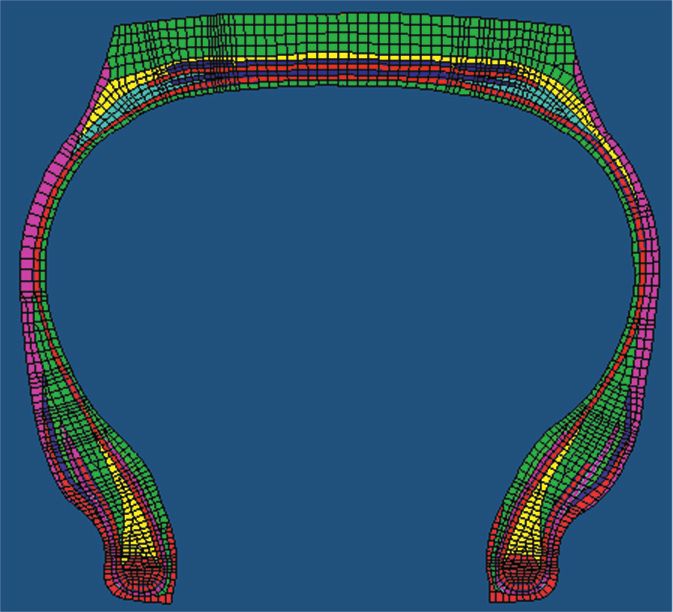
Advances in Materials Science and Engineering 3

 A fatigue evaluation method for radial tire
 based on strain energy density gradient

 Material model Fatigue failure
 Gradient theory
 selection analysis method

 Finite element Fatigue failure Strain energy density
 model establishment evaluation index gradient theory

 Tire fatigue analysis and experimental verification

 The influence of contour shape and
 structural parameters on tire fatigue life

 A fatigue evaluation
 method for radial tire

 Figure 1: Flowchart.

 Figure 2: Real fatigue test stand with a tire.

 Table 1: Tire endurance test conditions and results summary.
Tire model Number Pressure (kPa) Load (N) Damage form Life (h)
 1 600 71000 Left bead area crack 40.17
11.00R20 2 600 71000 Left bead area crack 44.45
 3 600 71000 Right bead area crack 60.12
 1 830 75000 Right shoulder area crack 119.23
 2 830 75000 Right bead area crack 72.88
 3 830 75000 Left bead area crack 102.53
12.00R20
 4 830 75000 Right shoulder and bead areas crack 117.12
 5 830 75000 Left and right bead areas crack 107.7
 6 830 75000 Right bead area crack 58.02
 1 830 25000 Right shoulder area crack 60
255/70R22.5
 2 830 25000 Not destroyed 100+

the tire section, we scan the tire section with a scanner and The uniform grid model is adopted and the whole 3D model
redraw it in AutoCAD to get the tire geometric model. Then, is controlled around 294000 elements and 315000 nodes
Hypermesh was applied to create the 2D FE model of the [40].
tire. The damaged part of the tire was refined to get an The tire is a composite of various materials, including
accuracy simulation result. The tire 2D FE model was im- rubber compounds, steel cord, and cord-rubber composite.
ported to Abaqus and rotated by 360 degrees to form a 3D As rubber is a hyperplastic material, YEOH material for-
tire model. The 2D and 3D models are shown in Figure 4. mulation is suitable for simulating nonlinear mechanical
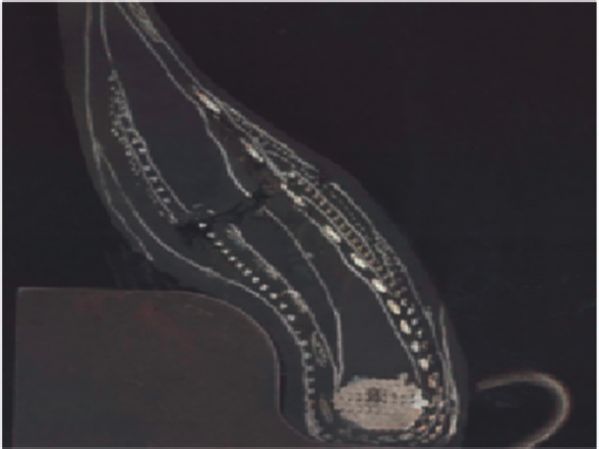
4 Advances in Materials Science and Engineering

 Carcass

 Chafer Innerliner

 Cushion
 Hardapex

 (a) (b)

 Figure 3: Section of sample test tire. (a) Tire bead area. (b) Failure point of the bead area.

 (a) (b)

 Figure 4: Finite element model. (a) Two-dimensional finite element model. (b) Three-dimensional finite element model.

behavior and incompressible property of the tire [41]. The The projection of the curve ι on the xOy surface is a plane
reinforcement elements, usually called cords, are assumed to curve L ∗ ; the equation in the xOy plane rectangular co-
be linear elastic materials in this simulation. Rebar elements ordinate system is
are selected to simulate the orthotropic elastic properties of
 f(x, y) � c. (2)
the cord-rubber system [42].
 The element type of CGAX4H and CGAX3H was se- For a point on the curve L ∗ , the function values that are
lected to simulate the rubber material and the element type given to the function are c, so we call the plane curve L ∗ as
of SFMGAX1 was selected for the tire cord part. The wheel the contour of the function [43, 44]. The normal vector at the
rim and the road surface are defined as an analytical rigid point p(x,y) of the contour, namely, the gradient is
body. The applied pressure and load are the same as the tire
endurance test shown in Table 1. zf zf
 i+ j. (3)
 zx zy
4. Strain Energy Density Gradient As a result, at any point, the obtainable gradient di-
 rection of the function and normal direction of the contour
Based on the finite element model, the strain energy dis- line f (x,y) � c over a point P have the same direction and
tribution (SED) can be calculated in Abaqus. point from the lower value of the contour to the higher
 The SED value at a point (x,y) in any section of the tire contour. The modulus of the gradient is the maximum value
can be described as two-element function z � f (x,y). This of the derivative of the function at that point (directional
function represents a surface geometry, and the equation of derivative along this direction) and the module of strain
the equal height curve ι of the surface which is cut by the energy density gradient (SEDG) is expressed as |gra d(x, y)|.
plane z � c (C is constant) is From this, we know that the area with the maximum
 z � f(x, y), value of SEDG modulus is the biggest SED change ampli-
 (1) tude. This proves that the above is the most frequent and
 z � c. intense area of energy storage and release. Based on fracture
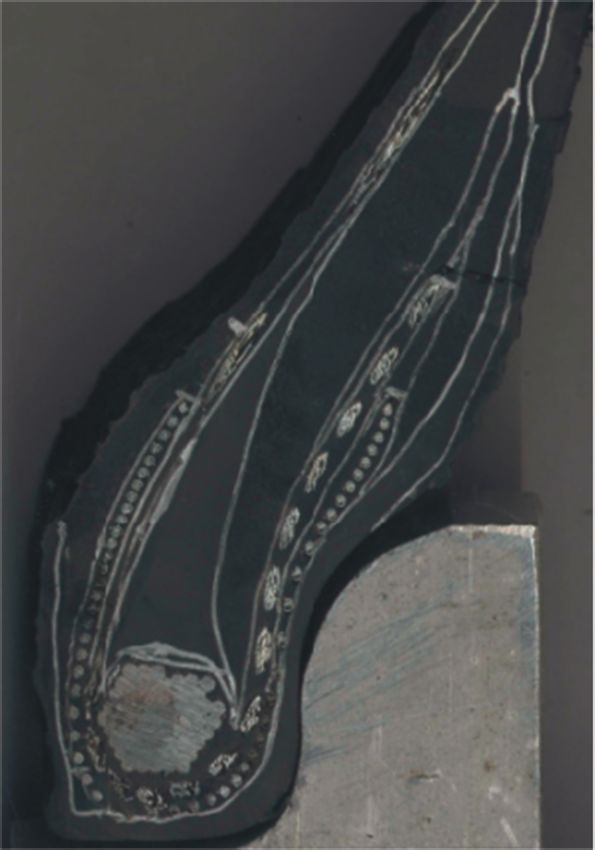
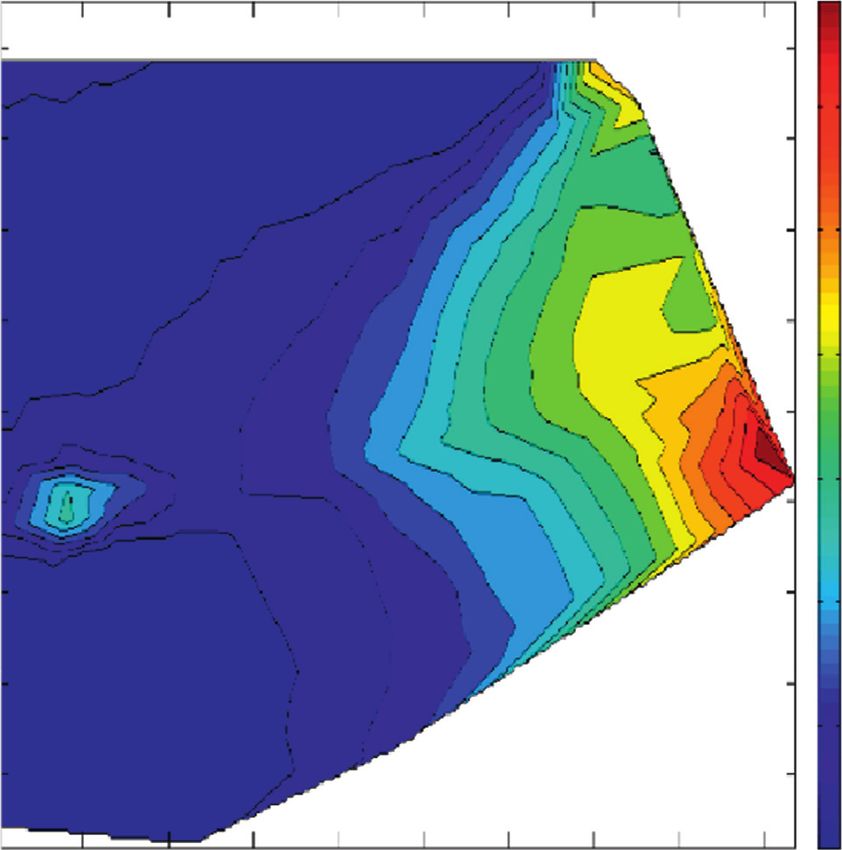
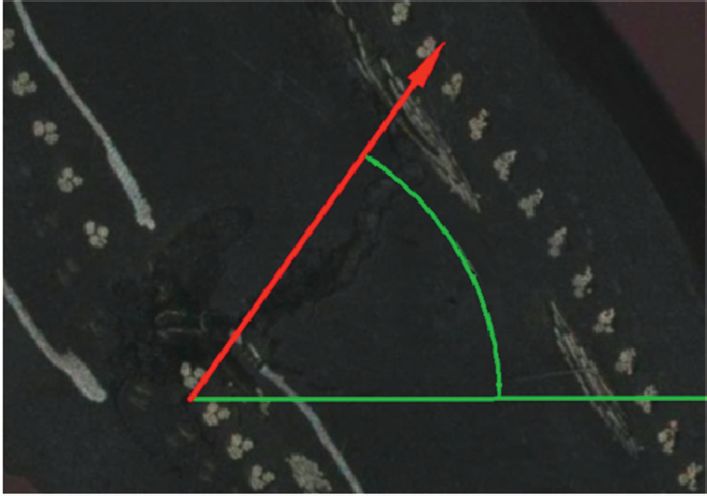
Advances in Materials Science and Engineering 5

mechanics theory, the crack growth rate is proportional to From Table 2, the coordinates of the maximum SEDG
the strain energy release rate [45]. The dimensionless pa- modulus correspond with the actual initial damage site.
rameter gradient modulus is suitable for establishing the Apart from the gradient direction of 12.00R20-2 which is
mathematical relationship with fatigue life. Therefore, SEDG not consistent with the direction of crack angle, the rest
can be used as the tire fatigue evaluation index, and the are the same. Overall, there is an inverse relationship
relationship between the index and the fatigue failure form between the life span and the maximum gradient mod-
and life of the tire can be established as the tire fatigue ulus, see Figure 9. It is indicated that the larger the
evaluation method proposed in this paper. gradient modulus, the shorter the lifetime. For that
 reason, tire fatigue can be evaluated by means of SEDG.
5. Analysis of Results By means of the above analysis and the subsequent
 experimental verification, the position of this paper is
The contact center of the tire surface was selected in Abaqus that the SEDG method can be applied to predict and
such that the output node coordinates and the corre- select the durability of each scheme in the design stage
sponding SED were of the (x, y, z) form, where x, y are the and to improve the durability test method and evaluation
usual output node coordinates and z is for the coordinates of system in failure determination.
the SED value. Then, the fatigue life test is performed, which gen-
 As shown in Figure 5, MATLAB programming was used erally meets that the crack is in the same direction as the
to produce SED contour map and SEDG two-dimensional gradient. In general, the fatigue life is inversely pro-
vector. The grid process was selected for Kriging interpo- portional to the maximum value of the gradient modulus;
lation. The advantages of this method are the overlap in the that is, the larger the maximum value of the gradient
interpolation points and sampling points; the interpolation modulus, the shorter the life. Therefore, SEDG can be
point value is the sampling point value and in order to used to evaluate and predict tire fatigue failure forms and
maximize a representative sample. When there are a lot of fatigue life.
data points, it is linear and unbiased and offers minimum
estimation variance, making the result of interpolation more
reliable [46, 47]. 6. Sensitivity Analysis of Structural Parameters
 As can be seen from Figure 5, the SED concentration
area is different from SEDG. Specifically, the concentration 6.1. Structural Design. The role of SEDG in the design stage
area originates and migrates from the shoulder and sidewall is mainly for the purpose of comparison and selection of
to the end of the belt, which is consistent with the fact that optimization scheme, but designers are confronted with
the main part of the damage of the shoulder is at the end of complex object structures, a variety of materials to choose
the belt. It is evident that the SEDG method is more accurate from, so it is urgent to find the most effective and di-
in predicting the damage site. rectional parameters, which when altered can signifi-
 For example, the analysis process of using the fatigue section cantly change the SEDG affecting tire durability and
in Figure 3 can be as follows: the maximum values of SEDG thereby ensuring work efficiency. In this paper, the main
modulus and their coordinates and directions for each part can structural parameters of the vulnerable parts are adjusted
be deduced by calculating and plotting the SEDG 2D vector of to calculate the sensitivity of SEDG to these structural
the left and right shoulder and bead, respectively. As shown in parameters and find out the parameters which have the
Figure 6, the maximum value of the SEDG modulus is at the left greatest impact on SEDG and fatigue life. The specific
bead, and the direction angle is shown in Figure 6(c). As shown structure design is shown in Table 3.
in Figure 7, in order to illustrate the feasibility of using SEDG to
analyze the fatigue failure of the tire, the maximum value and
direction of SEDG modulus in the tire finite element analysis 6.2. Sensitivity Analysis. Taking the change amplitude of the
model and the corresponding position of the tire section is SEDG model as the objective function, the virtual work
marked. equation of finite deformation is taken as the constraint
 From Figure 8, the initial failure location and the crack condition, respectively, expressed as
orientation determined by the SEDG method are consistent
with the actual failure module. As shown in Figure 7, in this Φr � Φr αt hp , ΔuN hp , hp , (4)
paper, in order to further prove the validity of the proposed
method using SEDG for fatigue discrimination, the other 2
fatigue failure sections are analyzed in the same way. Thus, FN � FN αt hp , ΔuN hp , hp � 0, (5)
the direction of the SEDG corresponds with the direction of
the fastest cyclical change; see Figures 7 and 9. where hp is the corresponding structural parameters,Φr is
 In Table 2, in order to verify whether the initial failure the corresponding SEDG modulus, FN � 0 is the virtual
location and the crack propagation direction are consistent with work equation in the form of finite deformation increment,
the actual situation, the above process is repeated for each test ΔuN (hp ) is incremental displacement, and αt (hp ) is the state
section, and the coordinates, direction of crack propagation, and of the moment t. The sensitivity of objective function and
corresponding lifetime values are derived and presented as constraint equation to design variables can be obtained by
follows. formulas (4) and (5):
6 Advances in Materials Science and Engineering

 ×104
 ×105
 2.5
 46.5
 46.5
 3 46
 46
 2
 45.5
 45.5 2.5
 45
 45
 2 1.5
 44.5
 44
 1.5 44
 43.5 1
 43.5
 43 1
 43
 42.5 0.5
 0.5
 42.5

 42
 8 8.5 9 9.5 10 10.5 11 11.5 12 7.5 8 8.5 9 9.5 10 10.5 11 11.5
 (a) (b)

Figure 5: SED contour map and SEDG two-dimensional vector diagram of a shoulder. (a) SED contour map. (b) SEDG 2D vector map.

 ×104
 3
 44.32

 44.3 2.5

 44.28
 2
 44.26

 44.24 1.5

 44.22 1
 X = 7.4945
 44.2 Y = 44.1982
 Level = 31174.5602 0.5
 44.18

 44.16
 7.4 7.42 7.44 7.46 7.48 7.5 7.52 7.54 7.56

 (a)
 ×104
 X = –8.1383
 2.2
 44.52 Y = 44.5071 2
 Level = 23121.4031 1.8
 44.5 1.6
 44.48 1.4
 1.2
 44.46
 1
 44.44 0.8
 0.6
 44.42
 0.4
 44.4 0.2

 –8.2 –8.18 –8.16 –8.14 –8.12 –8.1 –8.08 –8.06

 (b)
 Figure 6: Continued.
Advances in Materials Science and Engineering 7

 ×104
 12
 31.32 11
 10
 31.3
 9
 31.28 8
 7
 X = 11.6747 6
 31.26
 Y = 31.2506
 Level = 12816.1463 5
 31.24 4
 31.22 3
 2
 31.2 1

 11.72 11.74 11.76 11.78 11.8 11.82 11.84

 (c)
 ×104
 6
 5.5
 31.41
 5
 31.4 4.5
 4
 31.39 3.5
 3
 31.38 X = 12.3161 2.5
 Y = 31.3707
 31.37 Level = 63985.8574 2
 1.5
 31.36 1
 0.5
 31.35
 –12.37–12.36–12.35–12.34–12.33–12.32–12.31

 (d)

 Figure 6: SEDG 2D vector of each part. (a) Left tire shoulder. (b) Right tire shoulder. (c) Left bead area. (d) Right bead area.

 56° 56°

 (a) (b)

Figure 7: The concrete damage form of the other 2 sections: (a) analysis of fatigue Section 1 results; (b) analysis of fatigue Section 2 results.

 113° 113°
 18°
 18°

 (a) (b)

Figure 8: Concrete failure modulus. (a) Location of damage in Abaqus. (b) Failure form in the actual section. (a) Tire shoulder area. (b) Tire
bead area.
8 Advances in Materials Science and Engineering

 140
 120
 100

 Fatigue life (h)
 80
 60
 40
 y = –103.4ln(x) + 301.15
 20 R2 = 0.9141
 0
 4 6 8 10 12 14
 Strain energy density gradient modulus (E + 04)
 Figure 9: The fitting curves of tire fatigue life.

 Table 2: Failure location and crack angle statistics.
 Number Gradient modulus (E4) Coordinate Crack angle Correspond Life (h)
 1 12.8 (11.77,31.25) 56 Yes 40.17
11.00R20 2 10.79 (11.83,31.87) 139 Yes 44.45
 3 9.07 (−11.20,31.19) 41 Yes 60.12
 1 5.70 (−8.47,46.74) 18 Yes 119.23
 2 9.54 (−13.10,30.88) 83 Yes 72.88
 3 7.02 (12.80,30.67) 113 Yes 102.53
 5.59 (−8.71,46.64) (−12.48,30.69) 122 Yes
12.00R20 4 117.12
 6.3 56 Yes
 7.7 (12.95,30.84) (−12.96,30.84) 57 Yes
 5 107.7
 8.96 76 Yes
 6 10.80 (11.95,30.59) 48 Yes 58.02

 dΦr zΦr zΦr dαt zΦr dΔ uN 7. Trial Tire Production and Testing
 � + t + , (6)
 dhp zhp zα dhp zΔ uN dhp As depicted in Figure 10, it is the current design of 11.00R20
 with a maximum SEDG tire modulus of 90288, the scheme
 dFN zFN zFN dαt zFN dΔ uN of the optimal solution with a value of 58766, and its material
 � + t + � 0. (7)
 dhp zhp zα dhp zΔ uN dhp distribution map. Figure 10 refers to the height of the carcass
 bulge end and the reinforcement layer because the carcass
 The results of structural sensitivity analysis are shown in bulge end and the reinforcement layer are more sensitive to
Table 4. the SEDG modulus at the bead, so changing the carcass
 As can be seen from Table 4, due to the huge changes in height affects significantly the fatigue life at the tire shoulders
sensitivity, the width of the 2# belt is more sensitive to the and beads area.
SEDG modulus at the shoulder and the height of carcass Figure 11 is the failure section of the trial sample tire
turn-up edge and steel wire strengthened layer height are the according to the optimization scheme, with the normal
most sensitive parameter to bead SEDG modulus. The production of the tire, followed by durability testing, after
implication is that a change in the width of the 2# belt and which the damaged section was cut off. The experimental
the interlayer of the height of carcass turn-up edge and steel results show that the fatigue life of the current design is 45
wire strengthened layer height can greatly influence the hours, and the fatigue life of the optimized scheme is about
fatigue life of the tire shoulder and bead. Designers can focus 80 hours. The latter significantly improves the fatigue life of
on changing the structural parameters, as well as other the tire. The experimental results show that the above-op-
material parameters in order to improve the SEDG distri- timized scheme is effective; the reliability of the method is
bution of the vulnerable area, so as to enhance the durability further verified. Figure 11 shows the tire cross sections of the
of the tire. current design and optimized design after the durability
Advances in Materials Science and Engineering 9

 Table 3: Structural sensitivity design.
Structure parameter Scheme Pressure (kPa) Load (N) Change
Current theoretical design section 1 600 71000 —
 2 600 71000 Add 10 mm
Steel wire strengthened layer height 3 600 71000 Add 18 mm
 4 600 71000 Add 28 mm
 5 600 71000 Reduce 4.5 mm
 6 600 71000 Reduce 13.5 mm
Height of carcass turn-up edge
 7 600 71000 Reduce 22.5 mm
 8 600 71000 Reduce 27 mm
Four-layer belt structure 9 600 71000 —
 10 600 71000 Add 2.5 mm
 11 600 71000 Add 5 mm
 12 600 71000 Add 7.5 mm
The width of 2# belt
 13 600 71000 Add 10 mm
 14 600 71000 Reduce 2.5 mm
 15 600 71000 Reduce 5 mm

 Table 4: Results of structural sensitivity analysis.
Scheme SEDG modulus of tire shoulder Sensitivity SEDG modulus of bead Sensitivity
1 45741 — 90288 —
2 46009 26.8 101972 1168.4
3 39552 −343.8 81754 −474.1
4 41825 −139.9 65565 −882.9
5 46365 138.7 91750 324.9
6 47993 166.8 146225 4143.5
7 48757 134.0 82876 −329.4
8 38289 −276 87132 −116.9
9 31002 — 94021 —
10 32807 722 92447 −629.6
11 28919 −416.6 92439 −316.4
12 29115 −251.6 92429 −212.3
13 29651 −135.1 92413 −160.8
14 32555 621.2 92471 −620
15 32124 224.4 92511 −302
 73.17

 79.99

 64.56
 55.17

 (a) (b)

 Figure 10: Current design and optimized design of tire material distribution map. (a) Current design. (b) Optimized design.
10 Advances in Materials Science and Engineering

 (a) (b)

 Figure 11: Fatigue failure section of current design and optimized design. (a) Current design. (b) Optimized design.

tests. The results show that the optimization scheme can Nomenclature
significantly improve tire fatigue life, which not only proves
the effectiveness of the above structural optimization FE: Finite element
method but also verifies the method of fatigue analysis, FEA: Finite element analysis
especially the accuracy of fatigue life prediction. SED: Strain energy density
 SEDG: Strain energy density gradient
 S–N: Stress and fatigue life
8. Conclusion TBR: Truck Bus Radial
In this paper, the effectiveness of the gradient strain energy VCCT: Virtual crack closure technique.
density in the fatigue failure and fatigue life prediction of the
tire is discussed by means of finite element simulation and tire Data Availability
endurance test. The results show that the maximum value of
the strain energy density gradient modulus corresponds to the All the data generated or analyzed during this study are
initial failure zone, which is inversely proportional to the fa- included in this article.
tigue life of the tire, and is in the direction of crack propagation.
On this basis, the sensitivity of the strain energy density gra- Conflicts of Interest
dient to the structural parameters is studied by utilizing the
sensitivity analysis technique. The results showed that the width The authors declare that they have no conflicts of interest.
of the 2# belt is the most sensitive parameter to shoulder in
SEDG modulus; the height of carcass turn-up edge and steel Acknowledgments
wire strengthened layer height and are most sensitive to bead
SEDG modulus. It became obvious that changing the structural This work was supported by the National Natural Science
parameters will have a great impact on the durability of the tire, Foundation of China (51405201). The authors would like to
effectively reducing the scope of the adjustment parameters. express their gratitude to Mr. Wan Zhijun from YFKSS for
 Aiming at the optimization scheme of the 11.00R20 tire, his invaluable help in compiling the MATLAB program. Mr.
the tire trial production and durability test were carried out. Li Zhao from Aeolus Tyre Co. Ltd. also provided lots of help
The results show that the scheme can significantly improve in tire contour design and the authors remain grateful.
the fatigue life of the tire, and the reliability of the method
was further verified. References
 The strain energy density gradient and sensitivity analysis in
 [1] S. Govindjee, Firestone tire failure analysis.Confidential
the destruction of the application of radial tire fatigue can not
 Bridgestone/Firestone Document, 2001.
only reduce the number of experiments during product de- [2] Z. He, K. K. He, S. Z. Zhou et al., “Review of research ap-
velopment and shorten the product development cycle but also proaches of fatigue failure of tyres,” Journal of Mechanical
effectively improve the durability of the tire and further improve Engineering, vol. 45, no. 03, pp. 76–83, 2009.
the application value of TBR tire fatigue damage theory and [3] S. J. Jin, D. B. Qian, D. H. Quan et al., Equipment and Method
promotion of fatigue life. for Estimating Tire Life, 2005.
Advances in Materials Science and Engineering 11

 [4] J. Su, L. Zhang, R. Chen et al., Vehicle Tire Life Detection [25] L. Wang, Effect of Aging on Properties of Cord Rubber
 System, 2012. Composites, Harbin Institute of Technology, Haerbing, Hei-
 [5] G. R. Li, Tire Tread Pattern for Improving Tyre Life, 2015. longjiang, 2008.
 [6] C. N. Chen, W. Fu, and Q. Zhou, Evaluation Method for [26] R. H. Yang, Study on Bearing Characteristics and Fatigue Life
 Adhesion Life of Steel Cord in Radial Tire, 2011. of Rubber Spherical Joints under Complex Stress Condition,
 [7] G. Shunsuke and K. Yamauchi, Carcass Life Prediction Hunan University of Technology, Zhuzhou, Hunan, 2013.
 System, 2013. [27] Z. Tian, H. Tan, X. Zhang et al., “Fatigue damage accumu-
 [8] K. Grosch, “Rolling resistance and fatiguelife of tires,” Rubber lation of [±20°] steel/rubber composite,” Journal of Composite
 Chemistry and Technology1988, vol. 61, no. 1, pp. 42–63. Materials, vol. 21, no. 2, pp. 60–64, 2004.
 [9] J. De Eskinazi, K. Ishihara, H. Volk, and T. C. Warholic, [28] L. M. Duan and Y. Q. Zhou, “Prediction of material fatigue life
 “Towards predicting relative belt edge endurance with the based on industrial CT images,” Journal of Chongqing University
 finite element method,” Tire Science and Technology, vol. 18, (Natural ScienceE Edition), vol. 31, no. 8, pp. 831–835, 2008.
 no. 4, pp. 216–235, 1990. [29] Z. Wan, Y. Liu, and X. Du, “Study on fatigue damage
[10] G. P. Giuliani, G. Medri, and A. Pirondi, “A test to evaluate mechanisms of rubber composite,” Physics Examination and
 fatigue crack growth in rubber compounds under mixed Testing, no. 4, pp. 13–17, 2000.
 [30] Z. Tian, H. Tan, and L. Xie, “Fatigue damage properties of
 mode loading,” Tire Science and Technology, vol. 29, no. 1,
 rubber composites,” Acta Materiae Compositae Sinica, vol. 22,
 pp. 44–55, 2001.
 no. 1, pp. 34–37, 2005.
[11] T. S. Fleischman, V. Kerchman, and T. G. Ebbott, “Torsional
 [31] W. Bai, C. Teng, and X. Wang, “An analysis on rheological
 crack growth test to simulate belt edge deformation,” Tire
 fracture mechanics of multi-fault interaction on xianshuihe
 Science and Technology, vol. 29, no. 2, pp. 91–107, 2001.
 earthquake belt,” Chinese Journal of Geophysics, vol. 33, no. 3,
[12] G. L. Wang, H. Zhou, C. Liang et al., “Influence of contour
 pp. 308–318, 1990.
 and structure parameters on fatigue life of truck and Bus [32] G. Wang, B. Lin, D. An et al., “Fatigue performance opti-
 radial tire,” Rubber Industry, vol. 64, no. 5, pp. 290–294, 2017. mization of radial tires based on sensitivity analysis,” Auto-
[13] L. B. Chen, Study on Crack Propagation and Life Prediction of motive Engineering, vol. 30, no. 4, pp. 354–356, 2009.
 Radial Tire of Load-Bearing Radial Tire, Jiangsu University, [33] S. Liu, “Introduction to standards for durability test methods
 Zhenjiang, Jiangsu, 2009. of truck tires,” Chemical Standardization and Quality Su-
[14] Z. Q. Gong, Experimental Study and Numerical Simulation of pervision, vol. 06, pp. 6-7, 1998.
 Fracture Behavior of OCr18Ni9 Stainless Steel at Elevated [34] R. X. Luo, Finite Element Analysis of 34 ∗ 10.75-16 Aero Tire
 Temperature, Xiamen University, Xiamen, Fujian, 2011. Based on ABAQUS, Guilin University Of Electronic Tech-
[15] D. D. Dan and X. C. Li, “Numerical analysis of energy release nology, Guilin, Guangxi, 2015.
 rate of piezoelectric materials,” Journal of Shenyang Ligong [35] W. Z. Zhang, Finite Element Analysis of Tire Static Charac-
 University, vol. 35, no. 3, pp. 102–106, 2016. teristics and its Influence on Vehicle Stability, Zhengzhou
[16] T. W. Kim, H. Y. Jeong, J. H. Choe, and Y. H. Kim, “Prediction University, Zhenzhou, Henan, 2011.
 of the fatigue life of tires using CED and VCCT,” Key En- [36] Q. Y. Cai, Simulation Study on Tire Vibration Characteristics
 gineering Materials, vol. 297-300, pp. 102–107, 2005. and Noise Control, Henan University of Science and Tech-
[17] Y. OH, “Relation between crack surface displacements and nology, Luoyang, Henan, 2015.
 strain energy release rate in thin rubber sheets,” Mechanics of [37] J. C. Huang, Study on Thermal Stress Coupling Problem of
 Materials, vol. 34, no. 8, pp. 459–474, 2002. Truck Radial Tire, Qingdao University of Science and Tech-
[18] Y. S. Huang and O. H. Yeoh, “Crack initiation and propa- nology, Qingdao, Shandong, 2016.
 gation in model cord-rubber composites,” Rubber Chemistry [38] D. F. An, J. Zhang, G. L. Wang et al., “Modal analysis of TBR
 and Technology, vol. 62, no. 4, pp. 709–731, 1989. tire by finite element method,” Tire Industry, vol. 28, no. 7,
[19] S. Ozupek and E. B. Becker, “Finite element method for the pp. 387–390, 2008.
 study of belt edge delaminations in truck tires,” Rubber [39] L. J. Wei, Z. Y. Yue, Q. Y. Hou et al., “Finite element analysis
 Chemistry and Technology, vol. 78, no. 4, pp. 557–571, 2005. of radial tire cord force,” Rubber Industry, vol. 61, no. 5,
[20] T. G. Ebbott, ““An application of finite element based fracture pp. 295–299, 2014.
 mechanics analysis to cord-rubber structure,” 12th annual [40] C. Peng, X. Chen, and C. Luo, “Cross-section mapping and
 finite element analysis of military truck steel truck radial
 meeting and conference of the tire society, 23–24 march 1993;
 tires,” Journal of Military Transportation University, vol. 13,
 also appeared as tire,” SciTechnol. International Publisher of
 no. 9, pp. 49–52, 2011.
 Science, vol. 24, no. 3, pp. 220–235, 1993.
 [41] C. Liang, L. Ji, H. Mousavi et al., “Evaluation of Tire Traction
[21] X. A. Zhong, “Computational fracture mechanics analysis of
 Performance on Dry Surface Based on Tire-Road Contact
 truck tire durability,” Journal of Applied Mechanics, vol. 73, Stress,” in Proceedings of the 30th SIAR International Congress
 no. 5, pp. 799–806, 2006. of Automotive and Transport Engineering, Craiova, Romania,
[22] J. T South, Mechanic Properties and Durability of Natural September 2020.
 Rubber Compounds and Composites, Virginia Polytechnic [42] C. Fang, Finite Element Analysis of Radial Truck Tire Based
 Institute and State University, Virginia, USA, 2001. on Rebar element, 2007.
[23] X. H. Sun, Study on Microcosmic Mechanism of Flexural [43] Q. L. Wen, Realistic Terrain Reconstruction Based on Contour
 Fatigue Failure of SSBR and Fatigue Resistance Optimization Lines, Xidian University, Xian, Shanxi, 2007.
 of Tire Tread Base Adhesive, Qingdao University of Science [44] K. D. Chen, Advanced Mathematics, Chongqing University
 and Technology, Qingdao, Shandong, 2011. press, Chongqing, China, 2001.
[24] J. Y. Zhang, Finite Element Calculation of Fatigue Life and Lag [45] S. Zhang and H. Jia, “On the limitations of material mechanics
 Heat Generation of Radial Tire, Beijing University of and the development of fracture mechanics in tire structure
 Chemical Technology, Beijing, China, 2017. design,” Rubber Industry, no. 09, pp. 34–39, 1997.
12 Advances in Materials Science and Engineering

[46] Z. G. Duan, H. S. Xiao, and W. X. Yuan, “Interpolation
 method of forest canopy height model based on discrete point
 cloud data,” Forestry Science, vol. 52, no. 9, pp. 86–94, 2016.
[47] J. J. Li, J. Li, X. R. Huang et al., Comparison of spatial in-
 terpolation methods in groundwater quality AssessmentA,
 2016.
You can also read