The Study of Derivatization Prior MALDI MSI Analysis-Charge Tagging Based on the Cholesterol and Betaine Aldehyde - MDPI

Page created by Lauren Moss
 
CONTINUE READING
The Study of Derivatization Prior MALDI MSI Analysis-Charge Tagging Based on the Cholesterol and Betaine Aldehyde - MDPI
molecules
Article
The Study of Derivatization Prior MALDI MSI
Analysis—Charge Tagging Based on the Cholesterol and
Betaine Aldehyde
Przemyslaw Mielczarek 1 , Tymoteusz Slowik 2 , Jolanta Helena Kotlinska 3 , Piotr Suder 4
and Anna Bodzon-Kulakowska 4, *

                                          1   Laboratory of Proteomics and Mass Spectrometry, Maj Institute of Pharmacology, Polish Academy of Sciences,
                                              Smetna 12 St., 31-343 Krakow, Poland; mielczar@if-pan.krakow.pl
                                          2   Experimental Medicine Center, Medical University of Lublin, Jaczewskiego 8D St., 20-090 Lublin, Poland;
                                              tymoteuszslowik@umlub.pl
                                          3   Department of Pharmacology and Pharmacodynamics, Medical University of Lublin, Chodzki 4a St.,
                                              20-093 Lublin, Poland; jolanta.kotlinska@umlub.pl
                                          4   Department of Analytical Chemistry and Biochemistry, Faculty of Materials Science and Ceramics,
                                              AGH University of Science and Technology, A. Mickiewicza 30 Ave., 30-059 Krakow, Poland;
                                              piotr.suder@agh.edu.pl
                                          *   Correspondence: abk@agh.edu.pl; Tel.: +48-12-617-5083

                                          Abstract: Mass spectrometry imaging is a powerful tool for analyzing the different kinds of molecules
                                in tissue sections, but some substances cannot be measured easily, due to their physicochemical
         
                                          properties. In such cases, chemical derivatization could be applied to introduce the charge into the
Citation: Mielczarek, P.; Slowik, T.;
                                          molecule and facilitate its detection. Here, we study cholesterol derivatization with betaine aldehyde
Kotlinska, J.H.; Suder, P.;
                                          from tissue slices and evaluate how different sample preparation methods influence the signal from
Bodzon-Kulakowska, A. The Study of
                                          the derivatization product. In this study, we have tested different solutions for betaine aldehyde,
Derivatization Prior MALDI MSI
                                          different approaches to betaine aldehyde deposition (number of layers, deposition nozzle height),
Analysis—Charge Tagging Based on
the Cholesterol and Betaine
                                          and different MALDI matrices for its analysis. As a result, we proved that the proposed approach
Aldehyde. Molecules 2021, 26, 2737.       could be used for the analysis of cholesterol in different tissues.
https://doi.org/10.3390/
molecules26092737                         Keywords: cholesterol; betaine aldehyde; mass spectrometry (MS); mass spectrometry imaging (MSI)

Academic Editors: Marek
M. Kowalczuk and Anna Drabik
                                          1. Introduction
Received: 9 April 2021
                                                About 25% of the whole-body cholesterol is deposited in the brain. Of this, 70% builds
Accepted: 4 May 2021
                                          up in the myelin shed of oligodendrocytes around the axons, whereas 30% is localized in
Published: 6 May 2021
                                          the plasma membranes of neurons and astrocytes [1]. Because the lipoproteins cannot pass
                                          through the brain–blood barrier (BBB), de novo synthesis of cholesterol is the only source
Publisher’s Note: MDPI stays neutral
                                          of this molecule in the brain. The astrocytes are the main channel for cholesterol delivery,
with regard to jurisdictional claims in
                                          as they produce two to three times more of this molecule than the neurons. They also
published maps and institutional affil-
                                          produce apolipoprotein E (apoE), which is a major transport protein for extracellular
iations.
                                          cholesterol. Neurons are able to produce enough cholesterol to survive and grow, but ad-
                                          ditional cholesterol is necessary for the formation of mature synapses [2]. Cholesterol
                                          is responsible for the shape of the membranes and signal transduction. Its depletion in
                                          neurons impairs synaptic vesicle exocytosis, neuronal activity, and neurotransmission,
Copyright: © 2021 by the authors.
                                          leading to dendritic spine and synapse degeneration [3]. Moreover, the demand for choles-
Licensee MDPI, Basel, Switzerland.
                                          terol changes throughout life and is the most intense during postnatal development [4].
This article is an open access article
                                          There is growing evidence that alternations in cholesterol homeostasis are connected with
distributed under the terms and
                                          CNS pathologies such as Alzheimer’s disease, Niemann–Pick disease, Rett syndrome [5],
conditions of the Creative Commons
Attribution (CC BY) license (https://
                                          or Smith–Lemli–Opitz syndrome (SLOS) [6].
creativecommons.org/licenses/by/
4.0/).

Molecules 2021, 26, 2737. https://doi.org/10.3390/molecules26092737                                        https://www.mdpi.com/journal/molecules
The Study of Derivatization Prior MALDI MSI Analysis-Charge Tagging Based on the Cholesterol and Betaine Aldehyde - MDPI
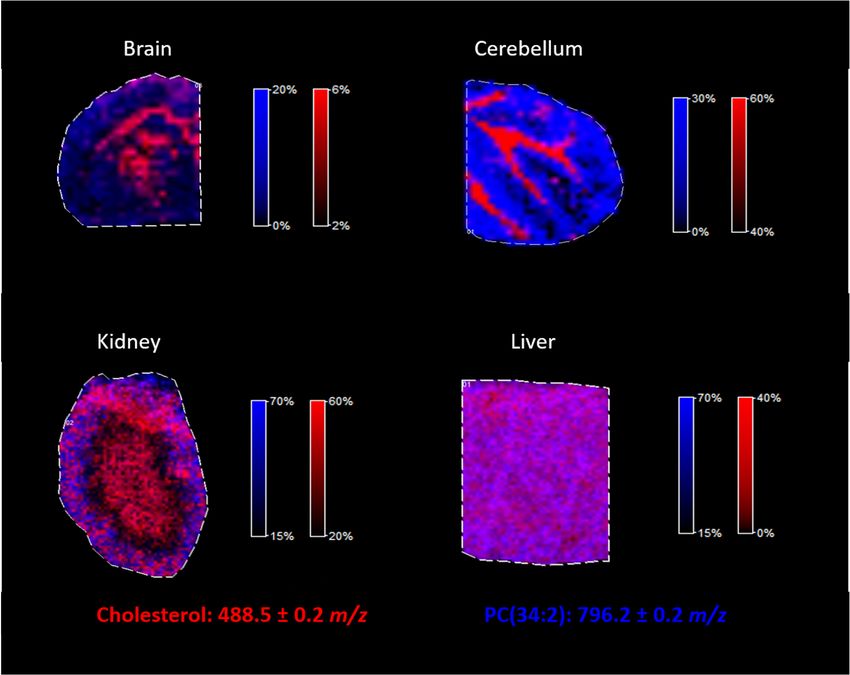
Molecules 2021, 26, 2737                                                                                            2 of 11

                                 Cholesterol analysis using MALDI MS can be demanding because cholesterol is
                           characterized by low proton affinity and low acidity. Nevertheless, several approaches
                           have been proposed to make this analysis possible. Dufresne et al. and Xu et al. used silver
                           sputtering to efficiently detect cholesterol as a silver adduct [cholesterol + 109 Ag]+ [7,8].
                           Some of the approaches utilize salt doping and metal sputtering. For example, Dufrense
                           et al. used sodium acetate and carbonate buffer mixture at pH 10.3 and sputtered a layer of
                           gold (Au-CBS) that allowed for sodiated cholesterol observation [9].
                                 Patti et al. used a direct silver coating of the NIMS surface (nanostructure-initiator
                           MS specially prepared silicon wafers), with aqueous AgNO3 , before tissue deposition,
                           and laser desorption ionization (LDI) for cholesterol analysis [6]. A valuable review of
                           different methods of cholesterol analysis could be found in [10].
                                 For the compounds that do not ionize well, chemical derivatization is usually applied.
                           Derivatization may also be used to increase the detection sensitivity and to decrease the
                           limit of detection (LOD) or quantification (LOQ) of the compound. This process aims to
                           increase the proton affinity of the analyte, or to introduce the charge for the analyte to
                           increase the sensitivity of its analysis. Derivatization should be as specific as possible,
                           occurring in solvents compatible with the MALDI ion source, and in conditions mild
                           enough to avoid delocalization or tissue distortion. In some cases, the reaction product is
                           designed to reach a maximal absorbance at 355 nm; thus, it could be analyzed without the
                           MALDI matrix [11,12].
                                 Derivatization requires a deposit of a layer of the chosen chemical compound over the
                           surface of the analyzed tissue to allow the chemical reaction to occur. In our experiments,
                           the SunCollect System was used for the matrix deposition before the MALDI MSI analysis.
                           This approach is recognized as the “wet interface matrix deposition method”, using an
                           optimized spray generator to produce extremely small matrix droplets. This feature enables
                           its usage during the derivatization process.
                                 Betaine aldehyde reacts selectively with alcohols. The reaction occurs between the
                           aldehyde group of betaine and the hydroxyl group of the target alcohol (see Figure 1).
                           In this reaction, hemiacetal salt is formed, and the obtained product is labeled with a charge.
                           This could significantly improve the detection sensitivity [13]. This approach was proposed
                           by Wu et al. [13] for reactive DESI and has been used previously by us for vascular graft
                           analysis [14]. In this article, we intended to evaluate whether such derivatization is also
                           possible for the MALDI analysis.
The Study of Derivatization Prior MALDI MSI Analysis-Charge Tagging Based on the Cholesterol and Betaine Aldehyde - MDPI
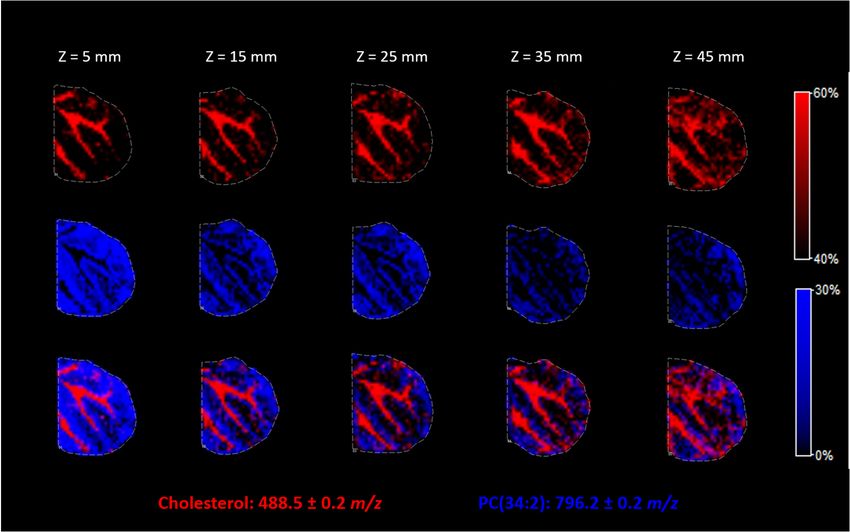
Molecules 2021, 26, 2737                                                                                                                         3 of 11
 Molecules 2021, 26, 2737                                                                                                                       3 of 12
Molecules 2021, 26, 2737                                                                                                                       3 of 12

       Figure 1.
       Figure  1. The
                  The scheme
                      scheme of
                             of cholesterol
                                cholesterol derivatization
                                            derivatization reaction
                                                             reaction with
                                                                       with the
                                                                             the betaine
                                                                                 betaine aldehyde
                                                                                          aldehyde(top)
                                                                                                   (top)and
                                                                                                         andthe
                                                                                                             theMS/MS
                                                                                                                MS/MS spectrum
                                                                                                                       spectrum for
                                                                                                                                for
      Figure 1. The  scheme of cholesterol derivatization   reaction with  the betaine   aldehyde (top) and the MS/MS spectrum for
       the derivatization
       thederivatization  product,
           derivatizationproduct,  obtained
                          product,obtained   from
                                   obtainedfrom
                                            fromthethe  tissue
                                                  thetissue     (bottom).
                                                       tissue(bottom).
                                                               (bottom).
      the

                                    2. Results  and Discussion
                                   2.2.Results
                                        Resultsand
                                                andDiscussion
                                                     Discussion
                                    2.1. Matrix, Betaine Aldehyde and the Number of Layers on the Tissue Cross-Sections
                                                                                                         Cross-Sections
                                   2.1. Matrix, Betaine Aldehyde and the Number of Layers on the Tissue Cross-Sections
                                          The general scheme of the substance derivatization in the MSI experiment comprised
                                         The general scheme of the substance derivatization in the MSI experiment comprised
                                    of depositing
                                       depositing the
                                                   thederivative
                                                       derivativeagent
                                                                   agent(in
                                                                          (inour
                                                                              ourcase,
                                                                                   case, betaine
                                                                                       betaine   aldehyde)
                                                                                               aldehyde)    in an
                                                                                                         in an    appropriate
                                                                                                               appropriate    solu-
                                                                                                                           solution,
                                   of depositing the derivative agent (in our case, betaine aldehyde) in an appropriate solu-
                                    followed
                                    tion,      by covering
                                          followed         the tissue
                                                    by covering        slice with
                                                                 the tissue  slice the
                                                                                   withappropriate  matrix
                                                                                         the appropriate   (Figure
                                                                                                         matrix     2). 2).
                                                                                                                 (Figure
                                   tion, followed by covering the tissue slice with the appropriate matrix (Figure 2).

                         Figure 2. The scheme of sample preparation before MSI analysis with
                                                                                        with tested
                                                                                             tested alternations.
                                                                                                    alternations.
                        Figure 2. The scheme of sample preparation before MSI analysis with tested alternations.
                                           In the
                                          In  the first
                                                    first part
                                                          part ofof the
                                                                     the experiment,
                                                                           experiment, two  two different
                                                                                                  different solvents
                                                                                                               solvents for
                                                                                                                          for betaine
                                                                                                                              betaine aldehyde
                                                                                                                                       aldehyde werewere
                                         In the first part of the experiment, two different solvents for betaine aldehyde were
                                     used: aa saturated
                                     used:    saturated solution
                                                            solution of   of betaine
                                                                             betaine aldehyde
                                                                                       aldehyde in  in 100%
                                                                                                        100% ACN,
                                                                                                                ACN, andand aa 0.1%
                                                                                                                               0.1% betaine
                                                                                                                                     betaine aldehyde
                                                                                                                                               aldehyde
                                   used:
                                     in an a saturatedOsolution
                                                            solutionof      betaine
                                                                                v/v).aldehyde      in 100% theACN,     and of
                                                                                                                            a 0.1%  betaine aldehyde
                                     in an ACN/H
                                            ACN/H22O solution             (2:1,
                                                                         (2:1,  v/v).  Additionally,
                                                                                      Additionally,       the   influence
                                                                                                               influence       the number
                                                                                                                           of the  number     of
                                                                                                                                              of betaine
                                                                                                                                                 betaine
                                   inaldehyde
                                       an ACN/H       2O solution (2:1, v/v). Additionally, the influence of the number of betaine
                                     aldehyde layers on the intensity of the signal from the product of derivatization was
                                                  layers    on   the   intensity    of  the   signal   from    the  product    of derivatization     was
                                   aldehyde
                                     checked. In layers   on the intensity         of the signal      frommg/mL
                                                                                                              the product of derivatization
                                                                                                                                        1:1, v/v + was
                                     checked.    In the
                                                     the last
                                                          last step,
                                                                step,two twomatrices,
                                                                               matrices,the theDHB
                                                                                                 DHB(25  (25 mg/mLininACN/HACN/H2 O,                0.2%
                                                                                                                                     2O, 1:1, v/v+ 0.2%
                                   checked.
                                     TFA) and  In theCHCAlast step,mg/mL
                                                                       two matrices,      the DHB      (25v/vmg/mL     inTFA),
                                                                                                                          ACN/H     2O, 1:1, v/v+ 0.2%
                                     TFA)   and the
                                                  the CHCA (5     (5 mg/mL in    in ACN/H
                                                                                    ACN/H       2 O,1:1,
                                                                                               2O,
                                                                                                     1:1,        + 0.2%
                                                                                                         v/v + 0.2%    TFA),     were
                                                                                                                               were    applied.
                                                                                                                                     applied.
                                   TFA) andFor   the
                                                all   CHCA
                                                    the         (5  mg/mL
                                                         comparisons,        10 in ACN/H
                                                                                 spectra      2O, 1:1, v/v + 0.2% TFA), were applied.
                                                                                           from   the  same    most   intensive  points  within   the the
                                                                                                                                                      an-
                                          For all the comparisons, 10 spectra from the same most intensive points                            within
                                         Fortissue
                                     alyzed    all thewere
                                                         comparisons,
                                                             taken,     and  10
                                                                              thespectra
                                                                                   average  from   theofsame
                                                                                              values       peak  most   intensive
                                                                                                                  intensity  and    points within
                                                                                                                                  standard           the
                                                                                                                                             deviations
                                     analyzed tissue were taken, and the average values of peak intensity and standard devia-
                                   analyzed
                                     were       tissue were     taken,     and the    average    values    of peak intensity and standard devia-
                                     tions calculated     for the
                                            were calculated          ion
                                                                   for  thefrom
                                                                             ion the
                                                                                  from derivatized     cholesterol.
                                                                                         the derivatized       cholesterol.
                                   tions were calculated for the ion from the derivatized cholesterol.
                                     2.1.1. Betaine Aldehyde Solution
                                         Because betaine aldehyde reacts with alcohols, these solvents cannot be used for its
                                    application. Aqueous solutions for mass spectrometry imaging may result in the loss of
                                    image resolution. On the other hand, the water addition may help extract the analyte of
                                    interest from the tissue. In our case, the application of the betaine aldehyde in 100% ACN
The Study of Derivatization Prior MALDI MSI Analysis-Charge Tagging Based on the Cholesterol and Betaine Aldehyde - MDPI
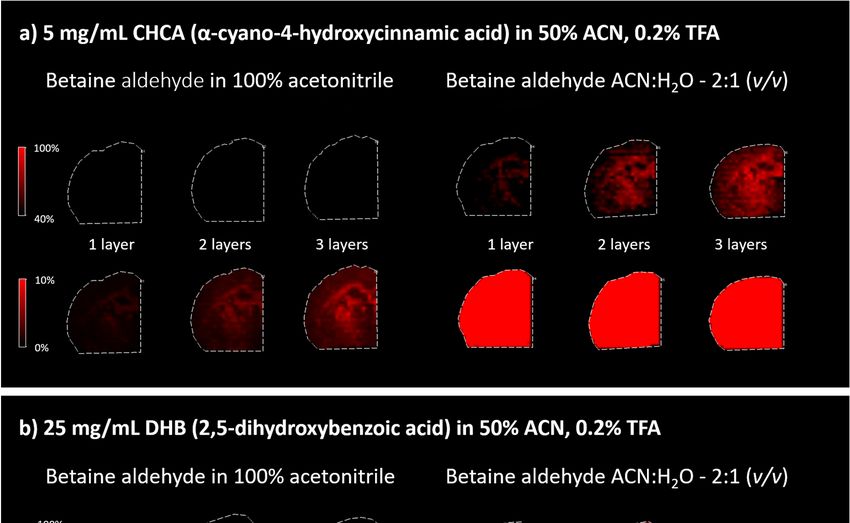
es 2021, 26, 2737                                                                                                                       4 of 12

                                2.1.1. Betaine Aldehyde Solution
           Molecules 2021, 26, 2737   Because betaine aldehyde reacts with alcohols, these solvents cannot be used for its           4 of 11
                                application. Aqueous solutions for mass spectrometry imaging may result in the loss of
                                image resolution. On the other hand, the water addition may help extract the analyte of
                                interest from the tissue. In our case, the application of the betaine aldehyde in 100% ACN
                                                resulted in an overall less intensive signal from the derivatization product (m/z = 488.7)
                                resulted in an overall less intensive signal from the derivatization product (m/z = 488.7)
                                                (left panels in Figure 3). When betaine aldehyde was dissolved in acetonitrile with water
                                (left panels in Figure 3). When betaine aldehyde was dissolved in acetonitrile with water
                                                (ACN:H2 O; 2:1), an overall higher signal was obtained (right panels in Figure 3).
                                (ACN:H2O; 2:1), an overall higher signal was obtained (right panels in Figure 3).

                               Figure 3. The results of the analysis for different matrices, betaine aldehyde solutions, and the
                    Figure 3. The results of the analysis for different matrices, betaine aldehyde solutions, and the number of layers. (a) CHCA
                               number of layers. (a) CHCA and (b) DHB matrices. Left panels: saturated solution of betaine alde-
                    and (b) DHB   matrices.
                               hyde   in 100% Left panels: saturated
                                                acetonitrile.          solution
                                                              Right panels:      of betaine
                                                                             solution          aldehyde
                                                                                         of 0.1%  betainein  100% acetonitrile.
                                                                                                           aldehyde  in ACN:H2RightO (2:1,panels:
                                                                                                                                           v/v). solution of
                    0.1% betaineThe
                                 aldehyde    in ACN:H
                                    rows for each matrix
                                                       2 O (2:1, v/v).
                                                             present the heatmap for the same analysis with the changes in the %analysis
                                                                       The  rows   for each   matrix present  the heatmap    for the same    of     with the
                    changes in the %   of displayed  intensity.  The top rows   in  (a,b) represent  the  intensity scale from
                               displayed intensity. The top rows in (a,b) represent the intensity scale from 40 to 100%, where   40 to 100%,  where  100% is
                    for the most100%
                                 intensive   cholesterol signal.  The  bottom   rows    represent  the  scale adjustment    of the
                                      is for the most intensive cholesterol signal. The bottom rows represent the scale adjustment intensity  from 0  to 10%,
                               of for
                    which allows  the the
                                       intensity from 0of
                                           observation   tosignals
                                                            10%, which    allows
                                                                   of lower       for thewhich
                                                                              intensity,    observation   of signals
                                                                                                  are invisible when ofthe
                                                                                                                        lower   intensity,
                                                                                                                            40–100%    range is used.
                               which are invisible when the 40–100% range is used.
                                              2.1.2. The Number of Betaine Aldehyde Layers applied for Cholesterol Derivatization
                                2.1.2. The Number of  Betaine the
                                                    Covering   Aldehyde   Layers
                                                                  area of the      applied
                                                                              tissue        for Cholesterol
                                                                                     slices with            Derivatization
                                                                                                 a polypropylene lid during betaine aldehyde
                                     Covering solution
                                                the area of  the tissueallowed
                                                           deposition    slices with
                                                                                  us toa test
                                                                                          polypropylene   lidnumbers
                                                                                              how different   during betaine    alde-
                                                                                                                        of betaine  aldehyde layers
                                hyde solution deposition     allowed
                                                influenced the   signalus  to test
                                                                        from       how differentproduct.
                                                                              the derivatization    numbersWe  ofdecided
                                                                                                                  betainetoaldehyde
                                                                                                                             test one, two, and three
                                                layers
                                layers influenced   the of betaine
                                                        signal from aldehyde   solution. The
                                                                      the derivatization       signalWe
                                                                                            product.  from  the entire
                                                                                                         decided       areaone,
                                                                                                                   to test   of the tissue was taken.
                                                                                                                                 two,
                                and three layersThe   intensity
                                                   of betaine   of the peak
                                                              aldehyde        for cholesterol
                                                                          solution. The signalwith
                                                                                                 frombetaine,  along
                                                                                                       the entire areawith  itstissue
                                                                                                                       of the   signal to noise ratio
                                was taken. The(s/n),    and of
                                                 intensity  mass
                                                               theresolution   were considered
                                                                    peak for cholesterol           (Figuresalong
                                                                                            with betaine,    4 andwith
                                                                                                                   5). its signal to
                                noise ratio (s/n), and mass resolution were considered (Figures 4 and 5).
The Study of Derivatization Prior MALDI MSI Analysis-Charge Tagging Based on the Cholesterol and Betaine Aldehyde - MDPI
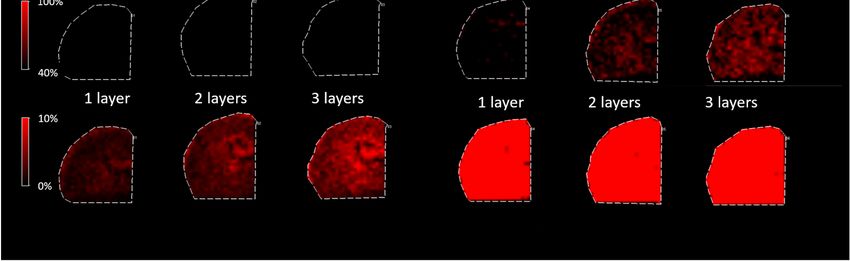
Molecules 2021, 26, 2737                                                                                                                                                                     5 of 11
         Molecules 2021, 26, 2737                                                                                                                                                      5 of 12

                       Betaine aldehyde in 100% ACN

                                                                                                                             Peak intensity
                             488.7

                                                                 750.4  798.8
                                                               724.3 772.9
                                                                                     827.0
                                                                                                                                                        1            2        3
                                                                                          868.8
                                                                                                                                                                No. of layers
                 400    450     500   550     600    650       700     750     800     850    900   950    1000   3 Layers

                                                                                                                             s/n
                             488.7                               750.4   798.8
                                                               724.3 772.9
                                                                                     827.0
                                                                                          868.8
                                                                                                                  2 Layers                                  1         2       3
                 400    450     500   550     600    650       700     750     800     850    900   950    1000                                                 No. of layers

                                                                                                                             Mass resolution
                                                                     750.4 798.8

                                                               724.3
                                                                         772.9

                             488.7                                                   827.0
                                                                                         868.8
                                                                                                                  1 Layers
                 400   450      500   550    600     650   700         750     800     850    900   950    1000                                         1            2        3
                                                                                                                                                                No. of layers
         Molecules 2021, 26, 2737                                                                                                                                                      6 of 12
                4. The 4.
         Figure Figure influence   of theofnumber
                          The influence            of layers
                                            the number        of of
                                                       of layers betaine
                                                                    betainealdehyde
                                                                            aldehyde in
                                                                                      in 100% ofacetonitrile
                                                                                         100% of acetonitrileonon obtained
                                                                                                                obtained   mass
                                                                                                                         mass    spectra.
                                                                                                                              spectra.

                                                                       Although the overall signal for derivatization with betaine aldehyde in 100% of ace-
                 Betaine aldehydetonitrile
                                   ACN:H       2O; a2:1
                                           is low,   clear linear dependence can be observed between the number of layers,
                                                                                                                                      Peak intensity

                             488.7
                                                           the signal intensity, and the s/n ratio.
                                                                  A similar effect could be observed for betaine aldehyde in an acetonitrile/water solu-
                                                           tion (ACN:H2O; 2:1, v/v), although a slight saturation of the signal’s response with the
                                                           increasing number of layers could be observed when we considered the intensity from the
                                                           whole tissue area (see Figure S3, Supplementary Materials). Additionally, in this case, the
                                                           mass resolution for the monitored peak (m/z = 488.7) decreased somewhat with the num-
                                                             750.4 798.8                                                        1     2      3
                                                           ber of layers.
                 400   450    500 550       600    650   700    750     800      850 900      950   1000                                                             No. of layers
                                                                                                                  3 Layers
                             488.7
                                                                                                                                      s/n

                                                                750.4 798.8

                 400   450     500 550      600    650   700     750     800     850    900   950   1000
                                                                                                                  2 Layers                                       1        2        3
                                                                                                                                                                     No. of layers
                                                                                                                                      Mass resolution

                             488.7

                                                                750.4 798.8
                                                                                                                  1 Layers
                 400   450     500 550      600    650   700     750     800     850    900   950   1000                                                        1         2        3
                                                                                                                                                                     No. of layers

              Figure
      Figure 5.  The 5.  The influence
                      influence   of theofnumber
                                           the number of layers
                                                  of layers     of betaine
                                                            of betaine     aldehydein
                                                                         aldehyde   inacetonitrile
                                                                                       acetonitrile with
                                                                                                    withwater
                                                                                                         watersolution, ACN:H
                                                                                                                solution,     2O = O
                                                                                                                          ACN:H    2:1
                                                                                                                                  2 = 2:1
              (v/v), on obtained mass spectra.
      (v/v), on obtained mass spectra.
                                                                 When comparing different matrices for the analysis of derivativatized cholesterol on
                                                           the tissue section, the CHCA matrix appeared to be better than DHB, as DHB-based spec-
                                                           tra suffer from a lower resolution (see Figure 3).

                                                           2.2. The Height of the Nozzle for Betaine Aldehyde Spraying
The Study of Derivatization Prior MALDI MSI Analysis-Charge Tagging Based on the Cholesterol and Betaine Aldehyde - MDPI
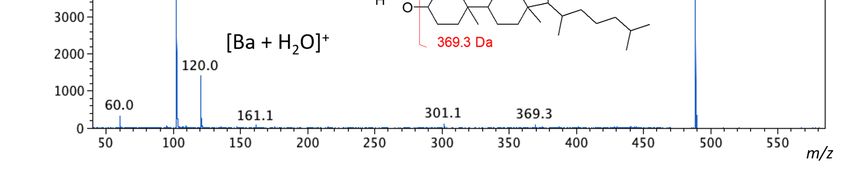
Molecules 2021, 26, 2737                                                                                                                6 of 11

                                         Although the overall signal for derivatization with betaine aldehyde in 100% of
                                   acetonitrile is low, a clear linear dependence can be observed between the number of layers,
                                   the signal intensity, and the s/n ratio.
                                         A similar effect could be observed for betaine aldehyde in an acetonitrile/water
                                   solution (ACN:H2 O; 2:1, v/v), although a slight saturation of the signal’s response with
                                   the increasing number of layers could be observed when we considered the intensity from
                                   the whole tissue area (see Figure S3, Supplementary Materials). Additionally, in this case,
                                   the mass resolution for the monitored peak (m/z = 488.7) decreased somewhat with the
                                   number of layers.
                                         When comparing different matrices for the analysis of derivativatized cholesterol on
                                   the tissue section, the CHCA matrix appeared to be better than DHB, as DHB-based spectra
                                   suffer from a lower resolution (see Figure 3).

                                   2.2. The Height of the Nozzle for Betaine Aldehyde Spraying
                                              The distance between the nozzle and the ITO surface is one of the most important
                                       parameters of the matrix for the deposition of other substances using the SunCollect System.
                                       Z = 1 mm is the highest position, and Z = 49 mm is the lowest position possible. Spraying
                                       the matrix from the topmost position results in a very dry spray, while the lowest position
                                       results in wetter vapor and better penetration of the solution into the tissue. We evaluated
                                       how the nozzle position influences the derivatization process and the resolution of the final
                                       heatmap of substance localization in the tissue.
                                              In Figure 6, we can see that the higher nozzle positions allowed for a better resolution
                     Molecules 2021, 26,of the picture. Thus, in the case of cholesterol derivatization, the highest possible nozzle
                                         2737                                                                                                        7 of
                                       position (Z = 5 mm) should be used to avoid lateral resolution loss.

                             FigureFigure
                                    6. The influence of the nozzle
                                           6. The influence   of theheight
                                                                     nozzleduring matrix
                                                                             height      deposition
                                                                                    during          on the spatial
                                                                                            matrix deposition   onresolution of resolution
                                                                                                                   the spatial   obtained results.
                                                                                                                                            of
                                   obtained results.
                                                    2.3. Different Approaches for Sample Preparation before MSI Analysis
                                   2.3. Different Approaches
                                                          Two for  Sample Preparation
                                                                approaches                beforederivatization
                                                                               to cholesterol    MSI Analysis with betaine aldehyde were expe
                                                    mentally
                                         Two approaches     to tested.  The first—the
                                                               cholesterol              classical
                                                                              derivatization      one—was
                                                                                               with  betainebased   on spraying
                                                                                                             aldehyde           betaine aldehyde s
                                                                                                                        were experimen-
                                   tally tested. Thelution  on the
                                                      first—the     tissue (aone—was
                                                                  classical    mouse cerebellum     cross-section)
                                                                                         based on spraying         andaldehyde
                                                                                                              betaine   standard solution
                                                                                                                                 CHCA matrix de
                                   on the tissue (aosition
                                                     mouseprior    to MSI. The
                                                              cerebellum         second approach
                                                                             cross-section)          was based
                                                                                              and standard      on preparing
                                                                                                              CHCA             precoated ITO glass
                                                                                                                      matrix deposition
                                   prior to MSI. Thewith  a derivatizing
                                                        second   approach  agent
                                                                              was [15].
                                                                                   basedBriefly, ITO glassprecoated
                                                                                           on preparing     was coated  with
                                                                                                                      ITO    a CHCA
                                                                                                                           glasses    matrix,
                                                                                                                                   with a     appl
                                                    ing  the standard    procedure   (see  section “Matrix  deposition”).
                                   derivatizing agent [15]. Briefly, ITO glass was coated with a CHCA matrix, applying the Afterward, the betaine
                                                    dehyde
                                   standard procedure         solution
                                                           (see  sectionwas   sprayed
                                                                          “Matrix       onto the matrix
                                                                                    deposition”).         layer using
                                                                                                      Afterward,   the the samealdehyde
                                                                                                                       betaine   procedure that w
                                                    used on the tissue cross-section (three layers in total). The 10 µm tissue slices were thaw
                                                    mounted directly onto the CHCA-precoated ITO glass. Another layer of the CHCA matr
                                                    was then sprayed onto the tissue according to the standard procedure. Additionally, o
                                                    sample was prepared without cholesterol derivatization.
                                                          The preparation of precoated ITO glasses is usually used to save time during samp
The Study of Derivatization Prior MALDI MSI Analysis-Charge Tagging Based on the Cholesterol and Betaine Aldehyde - MDPI
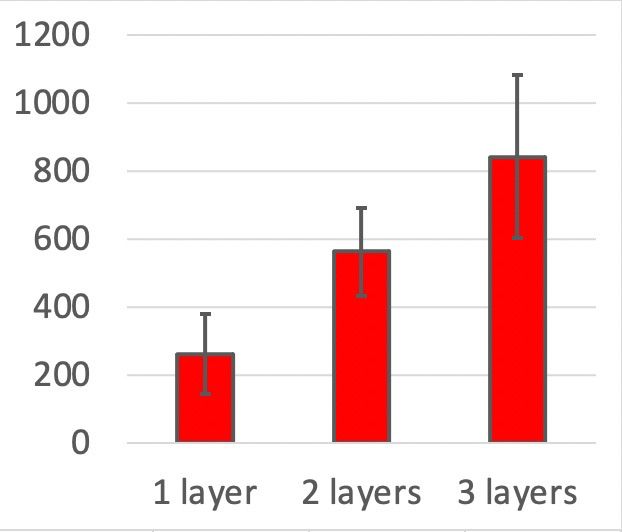
Molecules 2021, 26, 2737                                                                                                             7 of 11

                                   solution was sprayed onto the matrix layer using the same procedure that was used on
                                   the tissue cross-section (three layers in total). The 10 µm tissue slices were thaw-mounted
                                   directly onto the CHCA-precoated ITO glass. Another layer of the CHCA matrix was then
                                   sprayed onto the tissue according to the standard procedure. Additionally, one sample was
                                   prepared without cholesterol derivatization.
                                         The preparation of precoated ITO glasses is usually used to save time during sam-
                                   ple preparation, as classical matrix deposition on the day of the measurement is time-
                                   consuming [16]. Another advantage can be found for derivatization: the matrix and the
                                   derivative agent can be deposited on the ITO glass before the tissue cross-section thaw-
                                   mounting. This helps to avoid depositing the derivative agent on the tissue and reduces
                                   the risk of molecules delocalization during this process. It has to be stressed that in our
                                   case, another layer of CHCA matrix had to be applied on the tissue section to obtain the
                                   expected signal.
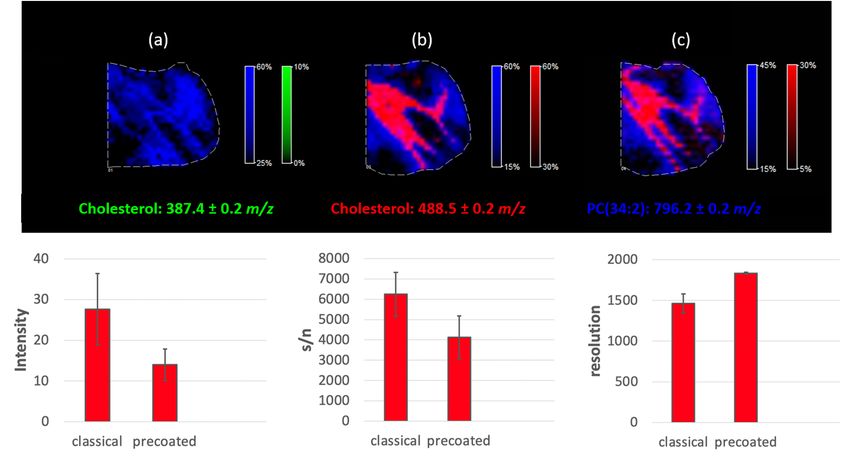
                                         As shown in Figure 7, cholesterol was visible for both approaches (uncoated and
                                   precoated glass), as an ion with m/z equals 488.5. PC (34:2) was used here as an endogenous
                                   standard and showed that standard lipid analysis is also possible with simultaneous
                                   cholesterol detection after each of the proposed strategies. The methodology involving the
                                   precoated ITO glasses resulted in a slightly higher spatial resolution of the final image. It is
                                   possible that avoiding tissue wetting is the cause. However, the signal from cholesterol is
                                   significantly weaker than the signal obtained after spraying the betaine aldehyde solution
                                   directly on the tissue. This is likely the result of avoiding the extraction process, which
                                   occurs while spraying the betaine aldehyde solution on the tissue. The reduction in ion
Molecules 2021, 26, 2737           intensities is more significant than the reduction in the s/n ratio. As a result, the8 mass  of 12
                                   resolution obtained for the tissue on a precoated ITO glass is much higher (see Figure 7).
                                   As we can see in Figure 7, it was impossible to detect any signal from naive cholesterol (the
                                   green
                                  (the    color
                                       green    denotes
                                              color       a ratio
                                                     denotes      of 387.4
                                                              a ratio      m/z).
                                                                      of 387.4    TheThe
                                                                               m/z).   applications of only
                                                                                          applications      thethe
                                                                                                       of only  CHCACHCA  matrix   on
                                                                                                                              matrix
                                   the tissue (at 369.5 and  385.5 m/z)  visible in SIMS were  also checked  with  negative
                                  on the tissue (at 369.5 and 385.5 m/z) visible in SIMS were also checked with negative      results.
                                   While betaine
                                  results.         aldehyde
                                           While betaine      retained
                                                           aldehyde     a positive
                                                                      retained      charge,charge,
                                                                                a positive  we tested  whether
                                                                                                   we tested    it was itpossible
                                                                                                             whether      was pos-  to
                                   obtain  a signal from   cholesterol  after derivatization  without  CHCA    matrix    deposition,
                                  sible to obtain a signal from cholesterol after derivatization without CHCA matrix depo-
                                   but forbut
                                  sition,  both
                                              forapproaches   (the classical
                                                  both approaches            and the
                                                                     (the classical   precoated),
                                                                                    and           the experiments
                                                                                        the precoated),             failed. failed.
                                                                                                        the experiments

      Figure
       Figure7. 7.Different
                  Differentapproaches
                            approachesto  tocholesterol
                                             cholesterolanalysis
                                                         analysisin
                                                                  inaamouse
                                                                       mousecerebellum;
                                                                             cerebellum;(a)
                                                                                         (a)tissue
                                                                                             tissuecovered
                                                                                                    coveredonly
                                                                                                              onlywith
                                                                                                                  withaaCHCA
                                                                                                                         CHCAmatrix,
                                                                                                                               matrix,
      (b)
       (b) tissue
           tissue sprayed
                   sprayed with
                            with aa betaine
                                    betaine aldehyde
                                             aldehydesolution
                                                       solutionand
                                                                andcovered
                                                                      coveredwith
                                                                              withaaCHCA
                                                                                     CHCAmatrix,
                                                                                             matrix,(c)
                                                                                                     (c)tissue
                                                                                                         tissuemounted
                                                                                                                mountedononthe
                                                                                                                            thematrix,
                                                                                                                               matrix,
      and betaine aldehyde precoated ITO glasses covered with CHCA matrix (please note the color scale bars and % of inten-
       and betaine aldehyde precoated ITO glasses covered with CHCA matrix (please note the color scale bars and % of intensities).
      sities).

                                  2.4. Cholesterol Analysis in the Different Tissues
                                       The proposed approach of cholesterol derivatization with betaine aldehyde was
                                  tested for different mouse tissues. As illustrated in Figure 8, by using the proposed meth-
                                  odology, cholesterol can be easily analyzed in tissues such as the brain, the cerebellum,
The Study of Derivatization Prior MALDI MSI Analysis-Charge Tagging Based on the Cholesterol and Betaine Aldehyde - MDPI
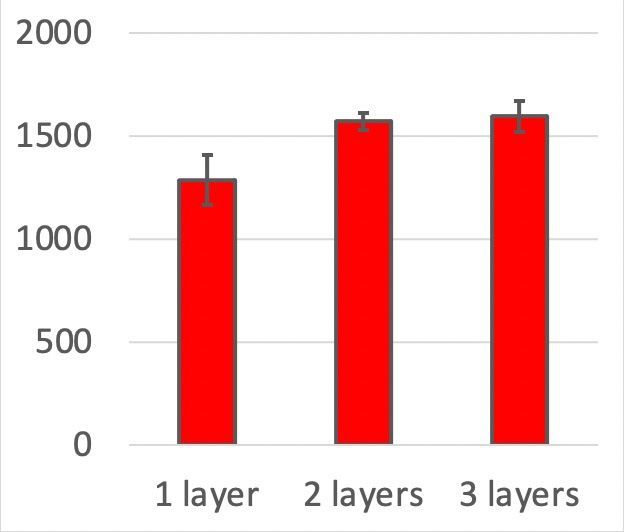
Molecules 2021, 26, 2737                                                                                                                 8 of 11

                                                  2.4. Cholesterol Analysis in the Different Tissues
                                                        The proposed approach of cholesterol derivatization with betaine aldehyde was tested
                                                  for different mouse tissues. As illustrated in Figure 8, by using the proposed methodology,
                                                  cholesterol can be easily analyzed in tissues such as the brain, the cerebellum, the kidneys,
                                                  and the liver, regardless of whether the tissue is heterogenous (such as the brain) or
                                                  homogenous (such as the liver). Additionally, lipids analysis was still possible after the
les 2021, 26, 2737                                derivatization of cholesterol, as we demonstrated on an example of PC9 (34:2),
                                                                                                                            of 12 identified in
                                                  all analyzed mouse tissues.

                                 Figure 8. analysis
                     Figure 8. Cholesterol Cholesterol  analysis
                                                    in the        in the
                                                           different     different
                                                                     tissues       tissues after derivatization
                                                                             after derivatization               by betaine
                                                                                                  by betaine aldehyde  withaldehyde  with derivatiza-
                                                                                                                             an optimized
                                 an optimized derivatization approach.
                     tion approach.

                                 3. Materials and Methods and Methods
                                               3. Materials
                                 3.1. Chemicals 3.1. Chemicals
                                       During the experiments,
                                                     During thethe    following chemicals
                                                                   experiments,              were
                                                                                 the following     used: acetonitrile
                                                                                                 chemicals            (ACN)
                                                                                                             were used:        and (ACN) and
                                                                                                                         acetonitrile
                                 methanol (J.T.methanol
                                                 Baker, Deventer,    TheDeventer,
                                                           (J.T. Baker,   Netherlands),  both at the HPLC-gradient
                                                                                    The Netherlands),                  grade. Be-
                                                                                                         both at the HPLC-gradient      grade. Be-
                                 taine aldehyde,   α-cyano-4-hydroxycinnamic
                                                taine                               acid (CHCA),acid
                                                      aldehyde, α-cyano-4-hydroxycinnamic            2,5-dihydroxybenzoic      acid
                                                                                                          (CHCA), 2,5-dihydroxybenzoic        acid
                                 (DHB), trifluoroacetic   acid (TFA) were
                                                (DHB), trifluoroacetic        at thewere
                                                                        acid (TFA)    highest
                                                                                          at theavailable  purity, received
                                                                                                 highest available            from from Sigma–
                                                                                                                    purity, received
                                 Sigma–Aldrich/Merck     (St. Louis,
                                                Aldrich/Merck     (St.MO,  USA)
                                                                      Louis,  MO,local
                                                                                   USA)distributor.  The water
                                                                                          local distributor. Theused  in used
                                                                                                                  water  the stud-
                                                                                                                               in the studies was
                                 ies was purified  using the
                                                purified usingSimplicity  systemsystem
                                                                 the Simplicity   from Millipore.
                                                                                         from Millipore.

                                                 3.2. Animal Treatment
                                 3.2. Animal Treatment
                                       All experiments Allwith
                                                           experiments   with performed
                                                               animals were   animals were   performed
                                                                                          according      according
                                                                                                     to the          to the
                                                                                                            respective      respective
                                                                                                                        Polish and     Polish and
                                                 European    Communities    Council Directives  (86/609/EEC)    and
                                 European Communities Council Directives (86/609/EEC) and were approved by the local  were  approved  by the local
                                                 Ethics  Committee   (137/2018).  The tissues from  the  mouse  brain,  rat
                                 Ethics Committee (137/2018). The tissues from the mouse brain, rat kidney and liver were   kidney and liver were
                                                 obtained   as spared tissues from control  animals  used  during  other
                                 obtained as spared tissues from control animals used during other experiments, according experiments,  according
                                 to the so-calledto3R
                                                    the(replacement/reduction/refinement)
                                                         so-called 3R (replacement/reduction/refinement)
                                                                                              rule.            rule.

                                 3.3. Tissue Sectioning
                                      Immediately after isolation, until assayed, the tissues were kept in a laboratory
                                 freezer at −80 °C (NuAire NU9483, Plymouth, MN, USA). Approximately 1 h before cut-
                                 ting, the tissues were transferred to the cryomicrotome chamber (Cryotome FSE, Thermo
The Study of Derivatization Prior MALDI MSI Analysis-Charge Tagging Based on the Cholesterol and Betaine Aldehyde - MDPI
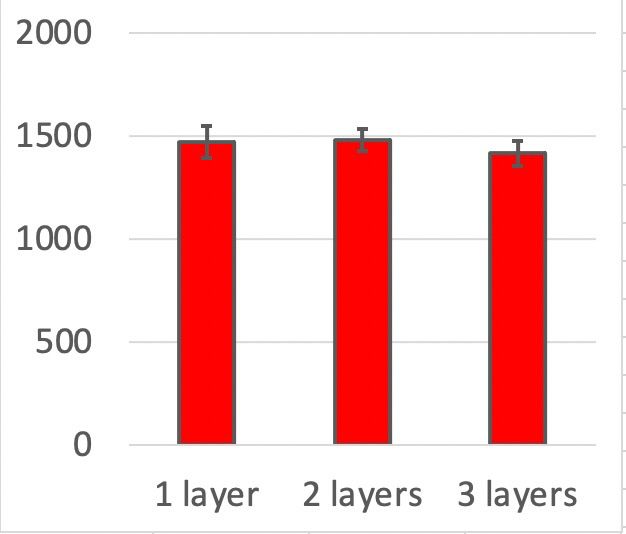
Molecules 2021, 26, 2737                                                                                            9 of 11

                           3.3. Tissue Sectioning
                                 Immediately after isolation, until assayed, the tissues were kept in a laboratory freezer
                           at −80 ◦ C (NuAire NU9483, Plymouth, MN, USA). Approximately 1 h before cutting,
                           the tissues were transferred to the cryomicrotome chamber (Cryotome FSE, Thermo Fisher
                           Scientific, Chesire, UK). The temperature inside the chamber and the temperature of the
                           specimen were set to −15 ◦ C. Slices were cut and immediately thaw-mounted on the ITO
                           glasses (Bruker-Daltonics, Bremen, Germany). The thickness of the tissue slices was 10 µm.
                           The tissues were then dried under the vacuum for about 45 min. Prepared samples were
                           stored at −80 ◦ C in the hermetically sealed boxes until the analysis. Just prior to analysis,
                           the samples were warmed up to an ambient temperature in a vacuum desiccator to prevent
                           moisture condensation on the sample’s surface, and dried for about 1 h. Exemplary tissue
                           sections were stained with cresyl violet. The procedure and the associated images are
                           available in the supplementary materials (Figure S2, Supplementary Materials)

                           3.4. Matrix Deposition and Cholesterol Derivatization
                                Before each matrix deposition, an optical image (600 dpi) of the tissue cross-sections
                           was registered for a glass slide with marked fiducials. Derivatization of cholesterol in
                           the tissues was performed using a SunCollect device (SunChrom GmbH, Friedrichsdorf,
                           Germany) by spraying a 0.1% betaine aldehyde solution in an ACN:H2 O solution (2:1, v/v)
                           with a constant flow rate equal to 60 µL/min, which yielded approximately 0.4 µg/cm2 of
                           betaine aldehyde deposited on a single layer. For some experiments, a saturated betaine
                           aldehyde solution in a pure ACN was used. A different number of layers was tested during
                           experiments. The reaction between betaine aldehyde and cholesterol on the tissue sections
                           occurs immediately, so it is not necessary to wait a specific time for the process to occur.
                                In the classical approach, matrix coating was performed after cholesterol derivatiza-
                           tion. The tissue cross-sections were coated with a CHCA matrix solution (5 mg/mL in 1:1
                           v/v ACN:H2 O + 0.2% TFA) or alternatively with a DHB matrix solution (25 mg/mL in 1:1
                           v/v ACN:H2 O + 0.2% TFA) using a SunCollect device. This resulted in the deposition of
                           approximately 2 µg of CHCA or 10 µg of DHB matrices per square millimeter of ITO glass
                           slide. Briefly, each matrix was deposited on the tissue via the application of 10 layers with
                           a line distance of 2 mm, a speed of 600 mm/min and with Z = 25 mm (nozzle height over
                           the sample). The flow rate of the matrix solution was variable: 10 µL/min for the first layer,
                           20 µL/min for the second layer, 30 µL/min for the third layer, 40 µL/min for the fourth
                           layer, and 60 µL/min for all other layers.
                                Covering individual tissue cross-sections on the ITO glass with a polystyrene lid
                           allowed for testing and measuring different conditions on the same glass slide. It also
                           allowed for a proper comparison of the obtained results (see Figure S1, Supplementary
                           Materials). A polystyrene lid allowed for spraying different numbers of betaine aldehyde
                           layers and protected against unwanted derivatization of adjacent tissue cross-sections (the
                           derivatization is extremely sensitive). In terms of the matrix application, this enabled us to
                           reach sharp matrix edging, which allowed for placing a larger number of tissue sections on
                           a single ITO slide.

                           3.5. MALDI Measurements
                                 Matrix-coated sections, after betaine aldehyde derivatization and without any deriva-
                           tization, were subjected to imaging using a MALDI–TOF/TOF UltrafleXtreme MS (Bruker
                           Daltonics, Bremen, Germany) with a Smartbeam II™ laser operating at 2 kHz. Ions were
                           accelerated at 25 kV with a pulsed ion extraction of 120 ns and ion suppression up to
                           100 Da. Spectra were recorded in positive ion mode with reflectron, within an m/z range of
                           200–3000. They were externally calibrated with Peptide Calibration Standard II (Bruker
                           Daltonics, Bremen, Germany) and a CHCA matrix ion [2M + H]+ with an m/z equal to
                           379.09. A raster width of 100 µm was applied to all samples, except for the imaging of
                           mouse brain tissue, where the raster width was set to 200 µm. In total, 400 shots were col-
                           lected from each ablation point with 20 shots at the raster spot, and the laser focus diameter
The Study of Derivatization Prior MALDI MSI Analysis-Charge Tagging Based on the Cholesterol and Betaine Aldehyde - MDPI
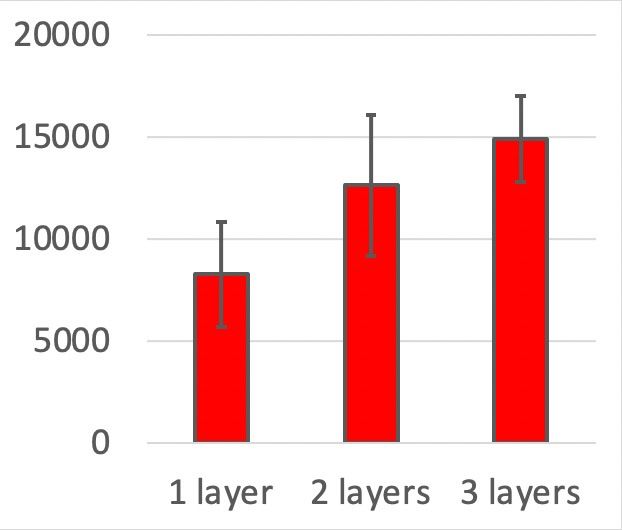
Molecules 2021, 26, 2737                                                                                                    10 of 11

                           was set to “4_large”. The FlexControl version 3.4 (Bruker Daltonics) was employed for
                           spectra acquisition, and the FlexImaging version 4.0 was used for data processing and the
                           creation of molecular images. All spectra were normalized against TIC. Mmass software
                           (version 5.5.0, Open Source software developed by Martin Strohalm, Academy of Sciences,
                           Prague, Czech Republic) was used for the spectra analysis [17]. To investigate the trend
                           during measurement optimization, 10 spectra from the same most intensive points within
                           the analyzed tissue were taken, and the average value of peak intensity and standard
                           deviation were calculated for the ion from derivatized cholesterol.

                           4. Conclusions and Future Perspective
                                 It was demonstrated in this study that cholesterol derivatization with betaine aldehyde
                           could significantly improve cholesterol ionization during MALDI MSI. We have developed
                           an optimal approach to reach a high spatial resolution and a low LOD. It was also shown
                           that the proposed methodology allows for the simultaneous detection of cholesterol and
                           lipids visible in positive ion mode, which was demonstrated for different mouse tissues.
                           The optimal procedure of cholesterol derivatization in tissues relied on spraying a betaine
                           aldehyde solution on the tissue from a height sufficiently low to avoid wetting the tissue,
                           which significantly increased spatial resolution and avoided a loss of signal from the lipids.
                           The choice of the solution for betaine aldehyde and the number of applied layers of this
                           derivatization reagent depends on the intended purpose. Our study showed that with an
                           ACN:H2 O solution (2:1, v/v), we could observe a very strong signal, which is appropriate
                           for measurements where the highest possible sensitivity is required. Conversely, a 100%
                           ACN helped obtain a slightly lower signal, but allowed for an easier observation of different
                           lipids simultaneously. Moreover, we had a better response with regard to the number
                           of derivatization reagent layers. A CHCA appears to be better than the DHB matrix for
                           cholesterol analysis. Alternatively, a methodology involving ITO glasses precoating with
                           the derivatizing agent was developed to further increase spatial resolution during MSI,
                           and to reduce the time between sample preparation and mass spectrometry measurement.
                                 Because cholesterol plays an important role in different biochemical phenomena,
                           we hope that this derivatization technique will be helpful in further research examining
                           its significance.

                           Supplementary Materials: Figure S1: (a) ITO glass slide partially covered with polystyrene lid dur-
                           ing matrix deposition (semi-transparent lid visible on the right); (b) sharp edges of matrix obtaining
                           after lid removal; (c) regions of ITO glass slide with different matrix and derivatizing strategy. Figure
                           S2: Exemplary tissue sections stained with cresyl violet, with the heat-map of cholesterol distribution.
                           Figure S3: A slight saturation of the signal’s response with the increasing number of layers could
                           be observed when we consider the signal intensity from derivatized cholesterol from the whole
                           tissue area.
                           Author Contributions: Conceptualization, P.M. and A.B.-K.; methodology, P.M., T.S., J.H.K. and A.B.-
                           K.; software, A.B.-K.; validation, P.M. and A.B.-K.; formal analysis, P.M.; investigation, A.B.-K.;
                           resources, A.B.-K.; writing—original draft preparation, P.M., A.B.-K. and P.S.; writing—review
                           and editing, P.S; visualization, P.M. and A.B.-K.; supervision, P.S.; project administration, A.B.-K.;
                           funding acquisition, P.M. and A.B.-K. All authors have read and agreed to the published version of
                           the manuscript.
                           Funding: Authors are grateful to the Polish National Science Centre grant Opus 2018/29/B/NZ4/02243
                           and the statutory funds from the Maj Institute of Pharmacology at the Polish Academy of Sciences.
                           Some expenditures were financed by the Polish Ministry of Science and Education–the subsidy no
                           16.16.160.557.
                           Institutional Review Board Statement: The study was conducted according to the guidelines of the
                           Declaration of Helsinki, and approved by the Local Ethics Committee (agreement number 137/2018).
                           Data Availability Statement: All the data present in the study are available upon request from the
                           corresponding author.
Molecules 2021, 26, 2737                                                                                                                11 of 11

                                    Conflicts of Interest: The authors declare no conflict of interest. The funders had no role in the design
                                    of the study; in the collection, analyses, or interpretation of data; in the writing of the manuscript,
                                    or in the decision to publish the results.
                                    Sample Availability: Samples of the compounds are not available from the authors.

References
1.    Björkhem, I.; Meaney, S. Brain Cholesterol: Long Secret Life Behind a Barrier. Arterioscler. Thromb. Vasc. Biol. 2004, 24, 806–815.
      [CrossRef]
2.    Mauch, D.H.; Nägler, K.; Schumacher, S.; Göritz, C.; Müller, E.C.; Otto, A.; Pfrieger, F.W. CNS synaptogenesis promoted by
      glia-derived cholesterol. Science 2001, 294, 1354–1357. [CrossRef] [PubMed]
3.    Zhang, J.; Liu, Q. Cholesterol metabolism and homeostasis in the brain. Protein Cell 2015, 6, 254–264. [CrossRef] [PubMed]
4.    Liu, J.-P.; Tang, Y.; Zhou, S.; Toh, B.H.; McLean, C.; Li, H. Cholesterol involvement in the pathogenesis of neurodegenerative
      diseases. Mol. Cell Neurosci. 2010, 43, 33–42. [CrossRef] [PubMed]
5.    Fracassi, A.; Marangoni, M.; Rosso, P.; Pallottini, V.; Fioramonti, M.; Siteni, S.; Segatto, M. Statins and the Brain: More than Lipid
      Lowering Agents? CN 2018, 17, 59–83. [CrossRef] [PubMed]
6.    Patti, G.J.; Shriver, L.P.; Wassif, C.A.; Woo, H.K.; Uritboonthai, W.; Apon, J.; Manchester, M.; Porter, F.D.; Siuzdak, G.
      Nanostructure-initiator mass spectrometry (NIMS) imaging of brain cholesterol metabolites in Smith-Lemli-Opitz syndrome.
      NSC 2010, 170, 858–864. [CrossRef] [PubMed]
7.    Dufresne, M.; Thomas, A.; Breault-Turcot, J.; Masson, J.-F.; Chaurand, P. Silver-Assisted Laser Desorption Ionization for High
      Spatial Resolution Imaging Mass Spectrometry of Olefins from Thin Tissue Sections. Anal. Chem. 2013, 85, 3318–3324. [CrossRef]
      [PubMed]
8.    Xu, L.; Kliman, M.; Forsythe, J.G.; Korade, Z.; Hmelo, A.B.; Porter, N.A.; McLean, J.A. Profiling and Imaging Ion Mobility-Mass
      Spectrometry Analysis of Cholesterol and 7-Dehydrocholesterol in Cells Via Sputtered Silver MALDI. J. Am. Soc. Mass Spectrom.
      2015, 26, 924–933. [CrossRef] [PubMed]
9.    Dufresne, M.; Masson, J.F.; Chaurand, P. Sodium-Doped Gold-Assisted Laser Desorption Ionization for Enhanced Imaging Mass
      Spectrometry of Triacylglycerols from Thin Tissue Sections. Anal. Chem. 2016, 88, 6018–6025. [CrossRef]
10.   Li, L.-H.; Dutkiewicz, E.P.; Huang, Y.-C.; Zhou, H.-B.; Hsu, C.-C. Analytical methods for cholesterol quantification. J. Food Drug
      Anal. 2019, 27, 375–386. [CrossRef] [PubMed]
11.   Rossato, M.; Miralles, G.; M’Kadmi, C.; Maingot, M.; Amblard, M.; Mouillac, B.; Gagne, D.; Martinez, J.; Subra, G.; Enjalbad, C.;
      et al. Quantitative MALDI-MS Binding Assays: An Alternative to Radiolabeling. ChemMedChem 2016, 11, 2582–2587. [CrossRef]
      [PubMed]
12.   Shariatgorji, M.; Nilsson, A.; Fridjonsdottir, E.; Vallianatou, T.; Kallback, P.; Katan, L.; Savmarker, J.; Mantas, I.; Zhang, X.; Bezard,
      E.; et al. Comprehensive mapping of neurotransmitter networks by MALDI–MS imaging. Nat. Methods 2019, 16, 1021–1028.
      [CrossRef] [PubMed]
13.   Wu, C.; Ifa, D.R.; Manicke, N.E.; Cooks, R.G. Rapid, Direct Analysis of Cholesterol by Charge Labeling in Reactive Desorption
      Electrospray Ionization. Anal. Chem. 2009, 81, 7618–7624. [CrossRef] [PubMed]
14.   Bodzon-Kulakowska, A.; Drabik, A.; Mystkowska, J.; Chlabicz, M.; Gacko, M.; Dabrowski, J.R.; Mielczarek, P.; Silberring, J.;
      Suder, P. Desorption electrospray ionization-based imaging of interaction between vascular graft and human body. J. Biomed.
      Mater. Res. Part B Appl. Biomater. 2016, 104, 192–196. [CrossRef] [PubMed]
15.   Manier, M.L.; Spraggins, J.M.; Reyzer, M.L.; Norris, J.L.; Caprioli, R.M. A derivatization and validation strategy for determining
      the spatial localization of endogenous amine metabolites in tissues using MALDI imaging mass spectrometry. J. Mass Spectrom.
      JMS 2014, 49, 665–673. [CrossRef] [PubMed]
16.   Yang, J.; Caprioli, R.M. Matrix Precoated Targets for Direct Lipid Analysis and Imaging of Tissue. Anal. Chem. 2013, 85, 2907–2912.
      [CrossRef] [PubMed]
17.   Strohalm, M.; Kavan, D.; Novák, P.; Volný, M.; Havlicek, V. mMass 3: A cross-platform software environment for precise analysis
      of mass spectrometric data. Anal. Chem. 2010, 82, 4648–4651. [CrossRef] [PubMed]
You can also read