Impact on Air Quality of the COVID-19 Lockdown in the Urban Area of Palermo (Italy) - MDPI
←
→
Page content transcription
If your browser does not render page correctly, please read the page content below
International Journal of
           Environmental Research
           and Public Health

Article
Impact on Air Quality of the COVID-19 Lockdown in
the Urban Area of Palermo (Italy)
Marcello Vultaggio 1 , Daniela Varrica 2, *               and Maria Grazia Alaimo 2
 1    Risorse Ambiente Palermo (RAP), Piazzetta B. Cairoli, 90123 Palermo, Italy; marcello.vultaggio@rapspa.it
 2    Dipartimento di Scienze della Terra e del Mare (DiSTeM), via Archirafi 22, 90123 Palermo, Italy;
      mariagrazia.alaimo@unipa.it
 *    Correspondence: daniela.varrica@unipa.it

 Received: 31 August 2020; Accepted: 7 October 2020; Published: 9 October 2020

 Abstract: At the end of 2019, the first cases of coronavirus disease (COVID-19) were reported in
 Wuhan, China. Thereafter, the number of infected people increased rapidly, and the outbreak
 turned into a national crisis, with infected individuals all over the country. The COVID-19 global
 pandemic produced extreme changes in human behavior that affected air quality. Human mobility and
 production activities decreased significantly, and many regions recorded significant reductions in air
 pollution. The goal of our investigation was to evaluate the impact of the COVID-19 lockdown on the
 concentrations of the main air pollutants in the urban area of Palermo (Italy). In this study, the trends
 in the average concentrations of CO, NO2 , O3 , and PM10 in the air from 1 January 2020 to 31 July
 2020 were compared with the corresponding average values detected at the same monitoring stations
 in Palermo during the previous five years (2015–2019). During the lockdown period (10 March–30
 April), we observed a decrease in the concentrations of CO, NO2 , and particulate matter (PM)10 ,
 calculated to be about 51%, 50%, and 45%, respectively. This confirms that air pollution in an urban
 area is predominantly linked to vehicular traffic.

 Keywords: COVID-19; air quality; lockdown; CO–NO2 –O3 –PM10 ; urban environment

1. Introduction
      The new severe acute respiratory syndrome-coronavirus (SARS-CoV2) has had an unprecedented
impact around the world. The spread of the 2019 coronavirus disease (COVID-19), initially identified
in Wuhan in China, led to over one million cases worldwide in the first four months [1]. The virus
has affected almost all countries on the planet (235 in total), causing so far over 34 million confirmed
cases and about 1,030,000 deaths [2]. This has resulted in lockdown in many nations. The COVID-19
pandemic has substantially affected the human society, including healthcare, economic structures,
and social relationships [3].
      In Italy, between the months of February and March, a series of national and regional legislative
measures were issued to stop the spread of COVID-19, which radically changed the daily habits and
lifestyles of citizens. The lockdown and the related implemented measures led to a sudden drop in
economic activities, including a fall in road transport in many cities and a drastic reduction in the
movement of citizens through the adoption of smart-working practices wherever possible.
      In Italy, the Decree of the President of the Council of Ministers (DPCM) of 9 March 2020 [4],
also known as the “I stay at home” Decree, extended the measures on confinement and restriction
on travel to the whole country and prohibited any form of gathering of people in public places or
locations open to the public, also suspending sporting and cultural events. The DPCM of 21 March
2020 [5], known as “Italy’s block”, blocked non-essential activities and imposed a ban on moving to
different municipalities. In Italy, lockdown and travel restrictions were maintained until 3 May 2020.

Int. J. Environ. Res. Public Health 2020, 17, 7375; doi:10.3390/ijerph17207375        www.mdpi.com/journal/ijerph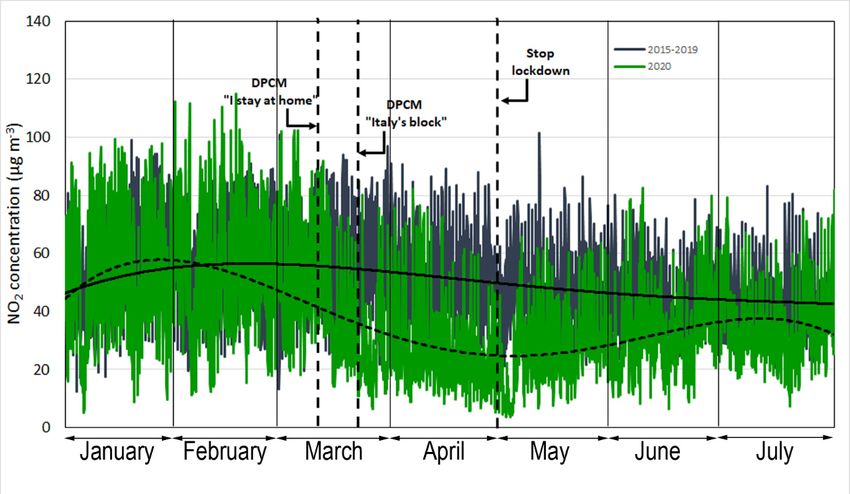
Int. J. Environ. Res. Public Health 2020, 17, 7375                                                  2 of 12

      Is lockdown a factor influencing air pollution?
      Reducing air pollution could be considered part of an integrated approach for the protection of
human health and the prevention of epidemic spread. The role of air pollution in contributing to the
high levels of SARS-CoV-2 lethality in northern Italy has been hypothesized [6,7].
      Exposure to air pollution is an important and persistent risk factor for death by different causes
and for a high incidence of respiratory diseases [8,9]. Deaths associated with air pollution include
aggravated asthma, bronchitis, emphysema, lung and heart disease, and respiratory allergies [8].
Among the atmospheric pollutants, the focus is mainly on nitrogen dioxide (NO2 ), particulate matter
(PM2.5 and PM10 ), and ozone (O3 ), which are frequently found at high concentrations in urban areas.
      Various studies have reported a direct relationship between the spreading and contagion capacity
of some viruses and the atmospheric levels and mobility of atmospheric pollutants [10,11]. The results
provided by Zhu et al. [12] indicated that a significant relationship exists between air pollution
and COVID-19 infection, which could partially explain the effect of the national block and provide
implications for the control and prevention of this new disease.
      A decline in anthropogenic air pollution has been observed in countries that have responded to
the COVID-19 pandemic with a total closure of all activities. Satellite data recorded by the NASA Earth
Observatory showed that NO2 concentrations in eastern and central China from the beginning of 2020
were 10–30% lower than those in comparable periods in 2019 [13]. In particular, in Hubei province
(China), strict social distancing measures that affected the main economic activities of the region were
implemented from December 2019; power plants and industrial structures stopped production, and the
use of vehicles decreased considerably [14]. This led to a drastic reduction in the levels of NO2 and fine
atmospheric particulate matter [15,16]. The European Environment Agency found a similar decrease
in air pollution in European cities [17]. Air pollution drastically reduced as major industries and other
regular businesses came to a halt, leading to a sharp reduction in NO2 concentrations in countries
such as France, Germany, Italy, and Spain [14,18,19]. From 16 to 22 March 2020, Bergamo (Italy) and
Barcelona (Spain) showed decreases in NO2 of 47% and 55% compared to the same dates in 2019,
respectively. The impact of the COVID-19 pandemic on air pollution measured by the United States
using the federal air monitoring network showed strong reductions in fine particulate matter (PM2.5 )
and NO2 , corresponding to reduced traffic and mandatory company closures [20].
      In our investigation, we explored the impact of COVID-19-relatd restrictions on the main air
pollutant concentrations, CO, NO2 , O3 , and PM10 , measured in the city of Palermo (Italy) using the
municipal air-monitoring network. We used statistical and quantitative analyses of the relationships
between air pollution, human mobility, and travel restrictions to infer the effects on air quality.
      The objectives of this study were: (1) to compare the concentrations of the main atmospheric
pollutants determined in the city of Palermo (Italy) during the pre-lockdown, lockdown,
and post-lockdown periods; (2) compare the collected data with those of the same time window in the
previous five years (2015–2019); and (3) evaluate the usefulness of the block as an alternative strategy
for reducing the level of atmospheric pollution in the city of Palermo.

2. Materials and Methods

Description of the Area and Sampling Sites
      With about 680,000 inhabitants, Palermo is the largest urban area of Sicily, and its metropolitan
area is populated by more than one million people. The city is situated on the north-western coast of
the island, facing the Tyrrhenian Sea on the northeast and surrounded by mountains (Monti di Palermo)
reaching 500–1000 m above sea level. The climate is typically Mediterranean, with warm dry summers
and moderately rainy winters. The prevailing wind directions are from the east and west. The city of
Palermo is periodically affected by frequent warm winds coming from the south-east (Sirocco winds)
and the southwest (Libeccio winds), carrying dust raised from the Sahara Desert region throughout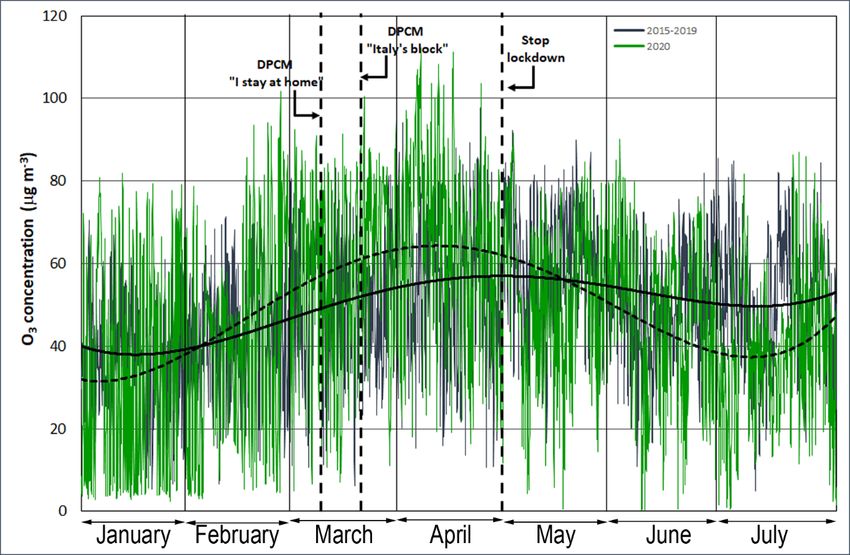
Int. J. Environ. Res. Public Health 2020, 17, 7375                                                       3 of 12

the Mediterranean basin, which considerably influences the concentration of PM10 . Potential local
pollutants are limited to emissions from traffic, domestic heating, and small manufacturing industries.
     We decided to compare the data collected from monitoring stations during the period from
1 January 2020 to 31 July 2020 with the averages for the same period calculated for the five-year period
of 2015–2019.
     The CO, NO2 , and O3 values were recorded hourly, whereas the PM10 values were recorded daily.
Each hourly or daily value for the five-year period is the result of the average calculated from all the
values recorded in the same hour or day in the considered five years. From the data of the five-year
period, the values due to abnormal and/or exceptional weather conditions and not attributable to
anthropogenic emissions were deleted.
     The comparison was performed using data on pollutants collected from monitoring stations,
shown in Table 1. In total, 213 days were analyzed for CO, NO2 , O3 , and PM10 in urban stations.
The selected urban stations are close to roads with different densities of vehicles, urban buses,
and extra-urban buses.

                   Table 1. Sampling site location for CO, NO2 , O3 , and particulate matter (PM)10.

                Pollutant                                 Monitoring Station
                                       Di Blasi            DB            Urban (Hight density traffic)
                    CO              Giulio Cesare          GC            Urban (Heavy density traffic)
                                    Indipendenza          IND             Urban (Lower traffic flow)
                                     Castelnuovo           CS            Urban (Heavy density traffic)
                   NO2                 Di Blasi            DB            Urban (Hight density traffic)
                                     Giulio Cesare         GC            Urban (Heavy density traffic)
                    O3               Castelnuovo           CS            Urban (Heavy density traffic)
                                     Castelnuovo           CS            Urban (Heavy density traffic)
                                       Di Blasi            DB            Urban (Hight density traffic)
                   PM10
                                    Giulio Cesare          GC            Urban (Heavy density traffic)
                                    Indipendenza          IND             Urban (Lower traffic flow)

     Gas analyses were performed using the municipal air quality monitoring network managed by
Risorse Ambiente Palermo (RAP). Ambient CO concentration measurements were recorded according
to European standard EN 14626; NO2 concentration was analyzed according to European standard
EN 14211 [21]. Ambient O3 concentration measurements were recorded according to European
standard EN 14625 via ultraviolet photometry. PM10 was sampled with a beta gauge analyzer
(Environnement S.A. MP101M, ENVEA, Italy), certified as equivalent to the reference method in
accordance with EN12341 [22] (stations: Di Blasi and Giulio Cesare) and another beta gauge analyzer
(OPSIS SM200, OPSIS, Sweden) for the Castelnuovo and Indipendenza stations.

3. Results and Discussion

3.1. Gaseous Air Pollutants, CO, NO2 , and O3
      The average concentrations of the gaseous air pollutants carbon monoxide (CO) and nitrogen
dioxide (NO2 ) were used to verify the impact on pollution of the closure of all activities in a city.
      The main sources of CO emissions are linked to incomplete combustion processes of natural
gas, diesel, or gasoline from engines and household heating [23]. In recent years, the levels of CO in
Palermo city were below the limit of 10 mg m−3 (maximum daily eight-hour mean) fixed by Directive
2008/50/EC [24]. Figure 1 shows the temporal trend in the hourly average concentration of carbon
monoxide in the atmosphere, detected for the period from 1 January 2020 to 31 July 2020 for the urban
stations compared to the trend of the hourly average concentration resulting from the processing of the
data of the five-year period of 2015–2019 for the same months.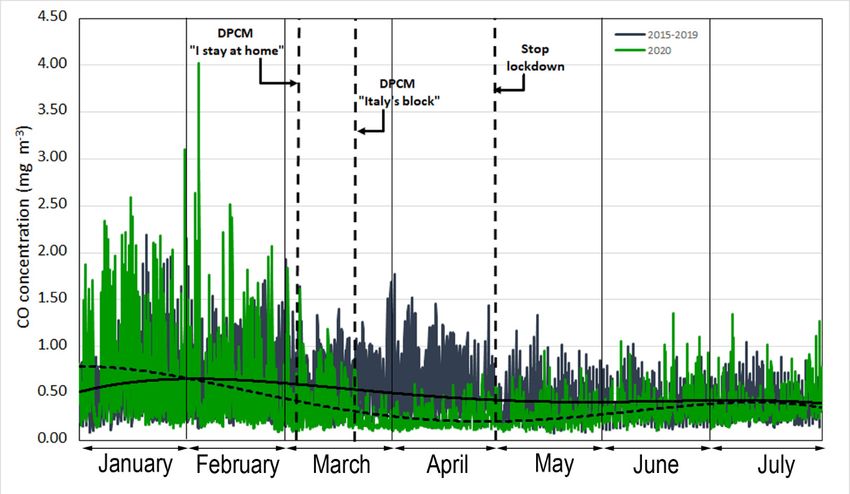
From 10 March (DPCM 9 March, 2020 [4], “I stay at home”) and even more evident from 22
March (DPCM 21 March, 2020 [5] “Italy’s block”), which defined the total lockdown, CO
concentrations were lower than the corresponding values of the five-year (2015–2019) period,
confirming that the main source of CO was heavy vehicular traffic. After the end of the lockdown,
we J.observed
Int. that
Environ. Res. COHealth
Public concentrations
2020, 17, 7375tended to slowly increase until they reached very similar values
4 of 12
to those of the month of July of the 2015−2019 period.
Int. J. Environ. Res. Public Health 2020, 17, x 4 of 12
From 10 March (DPCM 9 March, 2020 [4], “I stay at home”) and even more evident from 22
March (DPCM 21 March, 2020 [5] “Italy’s block”), which defined the total lockdown, CO
concentrations were lower than the corresponding values of the five-year (2015–2019) period,
confirming that the main source of CO was heavy vehicular traffic. After the end of the lockdown,
we observed that CO concentrations tended to slowly increase until they reached very similar values
to those of the month of July of the 2015−2019 period.
Figure 1.
Figure 1. Time
Timeseries
seriesofofhourly
hourlyCOCO(mg(mgm−3m)−3
concentrations measured
) concentrations fromfrom
measured 1 January to 31to
1 January July. The
31 July.
dotted
The dotted andand solid
solid regression
regression lineslines indicate
indicate the the
20202020
andand 2015-2019
2015-2019 trends,
trends, respectively.
respectively.
The trend 2a,
In Figure for we
thereport
hourlytheconcentrations in the cityofoftwo
frequency distribution Palermo showed
temporal a drop
trends, wherein the
the sharp
week
preceding
reduction the Prime Minister’s
observed during thedecree
lockdownof 9 March
period 2020. Following
is more the detection
evident. Figure 2bofplots
COVID-19 cases
the deciles
since 20 February, the closure of all schools and grades had already been implemented.
calculated for the two trends, showing that D5 was 0.2 mg m for the 2020 distribution and 0.47 mg
−3
From
m−3 for the 10 March (DPCM
2015−2019 9 March
distribution, 2020 [4], “I astay
representing at home”)
reduction of and even more evident from 22 March
−56%.
(DPCM 21 March 2020 [5] “Italy’s block”), which defined the total lockdown, CO concentrations were
lower than the corresponding values of the five-year (2015–2019) period, confirming that the main
source of CO was heavy vehicular traffic. After the end of the lockdown, we observed that CO
Figure 1. Time series of hourly CO (mg m−3) concentrations measured from 1 January to 31 July. The
concentrations tended
dotted to slowly
and solid increase
regression linesuntil they
indicate thereached
2020 andvery similartrends,
2015-2019 values to those of the month
respectively.
of July of the 2015−2019 period.
In
In Figure
Figure 2a,
2a, we
we report
report the
the frequency
frequency distribution
distribution of of two
two temporal
temporal trends, where the
trends, where the sharp
sharp
reduction observed during the lockdown period is more evident. Figure
reduction observed during the lockdown period is more evident. Figure 2b plots the deciles2b plots the deciles calculated
for the twofor
calculated trends, showing
the two that
trends, D5 wasthat
showing 0.2 mg m−3 0.2
D5 was for mg
the 2020
m−3 fordistribution and 0.47 mgand
the 2020 distribution m−30.47
for mg
the
2015−2019
m−3 for the distribution, representing
2015−2019 distribution, a reductionaof
representing −56%. of −56%.
reduction
Figure 2. (a) Frequency distribution and (b) deciles of two temporal trends, from 1 March to 30 April,
of CO concentrations (mg m−3).
A similar trend was observed for nitrogen dioxide (Figure 3). The average NO2 concentrations
at the urban stations did not exceed the legal limit of 200 µg m−3 (in one hour) but exceeded the annual
mean of 40 µg m−3, imposed by Directive 2008/50/EC [24] in the 2015–2019 period.
Figure 2.
Figure 2. (a)
(a) Frequency
Frequency distribution
distribution and
and (b)
(b) deciles
deciles of
of two
two temporal
temporal trends,
trends, from
from 11 March
March to
to 30
30 April,
April,
of CO concentrations (mg m
of CO concentrations (mg m ).
−3).
−3
A similar
similar trend
trend waswasobserved
observedfor
fornitrogen
nitrogendioxide
dioxide(Figure
(Figure 3).3).
The average
The NO
average 2 concentrations
NO at
2 concentrations
the urban stations did not exceed the legal limit of 200 −3−3(in one hour) but exceeded the annual
at the urban stations did not exceed the legal limit of 200 µg m (in one hour) but
µg·m
µg m−3
mean of 40 µg·m −3, ,imposed
imposedbybyDirective
Directive2008/50/EC
2008/50/EC [24]
[24] in
in the
the 2015–2019
2015–2019 period.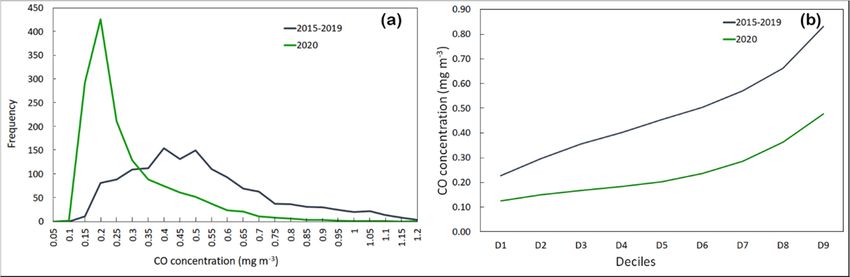
Int. J. Environ. Res. Public Health 2020, 17, 7375 5 of 12
Int. J. Environ. Res. Public Health 2020, 17, x 5 of 12
Int. J. Environ. Res. Public Health 2020, 17, x 5 of 12
Figure 3.
3. Time series
Timeseries ofofhourly
seriesof NO
hourlyNO
NO 2 (µg m−3)−3concentrations measured from 1 January to 31 July. The
Figure
Figure 3. Time hourly 2 (µg·m
2 (µg
) concentrations
m−3) concentrations measured
measured fromfrom 1 January
1 January to 31to 31 July.
July. The
dotted
The dotted and
andand solid
solid regression
regression lineslines indicate
indicate the
the the 2020
20202020 and
andand 2015-2019
2015-2019 trends,
trends, respectively.
respectively.
dotted solid regression lines indicate 2015-2019 trends, respectively.
From 1 January
From to 10 March, 2020, the trend in the hourly concentration of NO2 can be
From 11January
January to 10
to March 2020, the
10 March, trend
2020, theintrend
the hourly
in theconcentration of NO2 can be
hourly concentration ofsuperimposed
NO2 can be
superimposed
on that observed on that observed in the prior five-years. Since the DPCM of 9 March, 2020, a drastic
superimposed on in
thatthe prior five-years.
observed in the prior Since the DPCM
five-years. Sinceofthe 9 March
DPCM 2020, a drastic
of 9 March, decrease
2020, in
a drastic
decrease
the hourly in concentration
the hourly concentration
of NO 2 wasof observed.
NO2 was observed.
Nitrogen Nitrogen
dioxide dioxide
in the in the atmosphere
atmosphere is a is a
highly
decrease in the hourly concentration of NO2 was observed. Nitrogen dioxide in the atmosphere is a
highly reactive
reactive pollutant pollutant
emitted fromemitted from burning
burning fossil fuels (diesel, gasoline, and coal) [25,26]. This
highly reactive pollutant emitted from fossil
burningfuelsfossil
(diesel,
fuelsgasoline,
(diesel,and coal) [25,26].
gasoline, This[25,26].
and coal) pollutantThisis
pollutant is considered
considered a good indicator of air pollution in urban areas, as its concentration is heavily
pollutant is aconsidered
good indicatora good of indicator
air pollution
of airinpollution
urban areas, as its areas,
in urban concentration is heavily influenced
as its concentration is heavily
influenced
by transport byand
transport
mobility andofmobility
citizens. ofAt
citizens.
the end Atofthe
theend of the lockdown,
lockdown, some some economic
economic activities activities
did not
influenced by transport and mobility of citizens. At the end of the lockdown, some economic activities
did not
resume, resume,
schools andschools and
universities universities remained
remainedremained
closed, and closed,
smartandand smart
working working was maintained. This
did not resume, schools and universities closed, smartwas maintained.
working This reopening
was maintained. This
reopening
period period coincided
coincided with the partial emptying of the city for the summer holidays. The
reopening periodwith the partial
coincided withemptying of the
the partial city for the
emptying of thesummer holidays.
city for The density
the summer of motor
holidays. The
density of
vehicles motor vehicles
decreased because decreased
of the use because
of of the
bicycles and use of bicycles and scooters.
scooters.
density of motor vehicles decreased because of the use of bicycles and scooters.
Figure 4 shows the
Figure the frequency distribution
distribution and deciles
deciles of two two temporaltrends.trends. The trend
trend in NONO2
Figure 4 shows
shows the frequency
frequency distribution and and deciles of of two temporal
temporal trends. The The trend in in NO22
concentration observed is similar for the two periods, but with a strong strong concentration reduction in
concentration observed is similar for the two periods, but with a strong concentration concentration reduction in
2020. The
2020. Theconcentrations
concentrations decreased
decreased significantly
significantly during during
the the lockdown
lockdown due to due to the stoppage
the stoppage of transportof
2020. The concentrations decreased significantly during the lockdown due to the stoppage of
transport
and and
low mobilitylow mobility [27,28].
transport and low[27,28].
mobility [27,28].
Figure 4. (a) Frequency distribution and (b) deciles of two temporal trends of NO2 concentrations (μg
Figure 4.4. (a)
(a)Frequency
Frequency distribution
distributionand
and(b) deciles
(b) ofof
deciles two temporal
two trends
temporal of NO
trends 2 concentrations (μg
of NO
Figure
m−3
−3) from 1 March to 30 April. 2 concentrations
m ) from
−3 1 March to 30 April.
(µg·m ) from 1 March to 30 April.
Table 2 reports the average values for CO and NO2 pollutants at the individual monitoring
Table 22reports
Table reportsthe
the average
average values
values for and
for CO CO NOand2 pollutants
NO2 pollutants at the individual
at the individual monitoring
monitoring stations.
stations. The measured values showed that the link between improved air quality and traffic density
stations.
The The measured
measured valuesthat
values showed showed thatbetween
the link the linkimproved
between improved
air qualityair
andquality
trafficand traffic
density wasdensity
more
was more visible in the DB and GC monitoring stations, with variations during the lockdown
was more visible in the DB and GC monitoring stations, with variations during the lockdown
between −58% and −43% for CO and −37% and −54 % for NO2.
between −58% and −43% for CO and −37% and −54 % for NO2.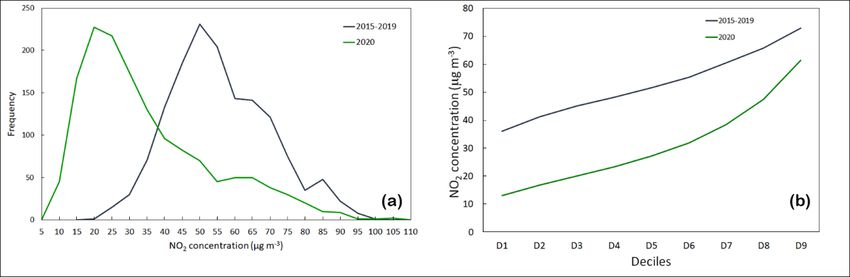
Int. J. Environ. Res. Public Health 2020, 17, 7375                                                                                 6 of 12

visible in the DB and GC monitoring stations, with variations during the lockdown between −58% and
−43% for CO and −37% and −54 % for NO2 .

                  Table 2. Average concentrations of CO and NO2 at individual monitoring stations.

                                 2015–2019                     2020                       % Change                    t-Test
                          IND    GC     CS     DB     IND    GC      CS    DB     IND    GC    CS    DB     IND    GC      CS      DB
           01/01–/02/29   0.49   0.76          0.64   0.48   0.81          0.70   −2      7           9     0.5           −2.8     −2.9
   CO      03/01–04/30    0.41   0.63          0.49   0.24   0.26          0.28   −41    −58         −43    17.5          43.6     18.9
           05/01–07/31    0.33   0.51          0.40   0.26   0.32          0.39   −21    −38         −3     9.9           36.0     1.7
           01/01–/02/29           59    50     52            58       41   65            −1    −19    25           0.7    13.6     −15.8
  NO2      03/01–04/30            56    46     58            29       21   36            −48   −54   −37           42.1   37.2     30.2
           05/01–07/31            45    39     53            31       24   40            −31   −38   −23           33.3   36.2     25.7
           01/01–/02/29                 40                            39                       −4                          1.8
   O3      03/01–04/30                  54                            63                       18                         −14.9
           05/01–07/31                  53                            53                       −1                         15.1
        Data are expressed in mg·m−3 for CO and µg·m−3 for NO2 and O3 ). Parametric t-test at p < 0.05. The italics indicates
        a not significant t test.

     The statistical descriptions for CO and NO2 considering the period 1 March–30 April, the period
after the first DPCM (10 March–30 April), and that after the second DPCM (22 March−30 April) are
provided in Table 3. The calculated percentage changes show a strong decrease in carbon monoxide
and nitrogen dioxide between the periods considered. The two-tailed paired t-test showed that the
observed differences among the three groups were statistically significant at p < 0.05.

           Table 3. Main statistical parameters of CO and NO2 ; results of the parametric t-test at p < 0.05.

                                                              2015–2019                 2020         % Change             t-Test
                                             Median                 0.46                0.20              −56
                             CO               Mean                  0.51                0.26              −48             15.36
        1 March–30                           St. Dev.               0.25                0.09
           April
                                             Median                 51.4                26.8              −48
                             NO2              Mean                  53.4                32.4              −39             12.04
                                             St. Dev.               14.2                18.3
                                             Median                 0.45                0.19              −58
                             CO               Mean                  0.50                0.25              −51             15.63
      10 March–30                            St. Dev.               0.08                0.09
         April
                                             Median                 51.4                24.5              −52
                             NO2              Mean                  53.3                26.8              −50             15.72
                                             St. Dev.               5.2                  9.9
                                             Median                 0.44                0.18              −60
                             CO               Mean                  0.49                0.22              −56             16.62
      22 March–30                            St. Dev.               0.08                0.06
         April
                                             Median                 50.4                21.8              −57
                             NO2              Mean                  51.9                25.5              −51             20.99
                                             St. Dev.               4.9                  6.3

     Ozone levels have increased as a result of human activities. Photochemical processes influenced
by anthropogenic emissions of ozone precursors (NO2 and volatile organic compounds (VOCs))
have caused the current tropospheric ozone levels to be substantially higher compared to the natural
background levels [29]. The critical aspect of ozone is related to its complex photochemistry, as the
rates of ozone formation and accumulation are non-linear functions of the mixture of VOCs and NOx
in the atmosphere [30]. Under certain conditions, NOx reduction can lead to higher ambient ozone
levels [31]. Motor vehicles are the main source of NOx emissions in an urban area; the increase in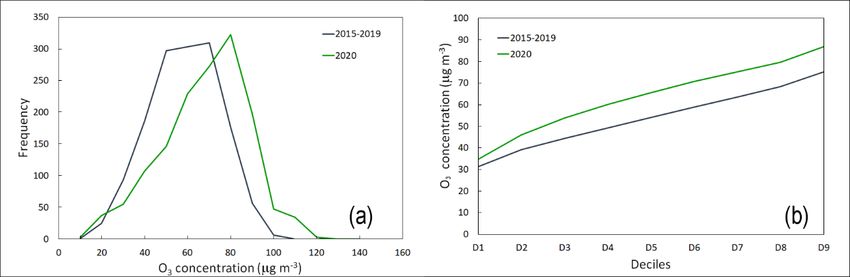
Int. J. Environ. Res. Public Health 2020, 17, 7375 7 of 12
ozone production has been linked to the reduction in vehicular traffic [32,33]. The increase in ozone
concentration that occurred during the lockdown is highlighted in Figures 5 and 6.
Int. J. Environ. Res. Public Health 2020, 17, x 7 of 12
Int. J. Environ. Res. Public Health 2020, 17, x 7 of 12
Figure 5. Time series of hourly O3 (µg m−3 )−3concentrations measured from 1 January to 31 July at the
Timeseries
Figure 5. Time seriesof
ofhourly
hourlyOO33 (µg·m
(µg ) concentrations
m−3) concentrations measured
measured from
from 1 January
1 January to July
to 31 31 July at
at the
CS
the monitoring
CS station.
monitoring The
station. dotted
The and
dotted solid
and regression
solid lines indicate
regression lines the 2020
indicate and
the 2015-2019
2020 and trends,
2015–2019
CS monitoring station. The dotted and solid regression lines indicate the 2020 and 2015-2019 trends,
respectively.
trends, respectively.
respectively.
Figure 6. (a) Frequency distribution and (b) deciles of two temporal trends from 1 March to 30 April
Figure 6. (a) Frequency distribution and (b) deciles of two temporal trends from 1 March to 30 April
Figure
of 6. (a) Frequency
O3 concentrations (μgdistribution
m−3 ) from 1and (b) to
March deciles of two temporal trends from 1 March to 30 April of
30 April.
of O3 concentrations (μg −3
m−3) from 1 March to 30 April.
O3 concentrations (µg·m ) from 1 March to 30 April.
3.2. Particulate Matter PM10
3.2. Particulate
The temporal Matter PM10
analysis of the O3 level showed an opposite behavior during the block (63 µg·m−3 )
Particulate
compared to thematter
averagein values
urban areas NOis mainly
µg·mcomposed of mineral
−3 ) at the same dust, metals,
station. metalloids,
An increasesea
Particulate matter in urban of areas 2 (21
is mainly composed monitoring
of mineral dust, metals, metalloids, in
sea
salts,
O is ammonium
usual during nitrate
spring andandsulfate,
summer organic
due compounds,
to the higher and
solarelemental
radiation carbon
(in [37].
terms Anthropogenic
of intensity and
salts,
3 ammonium nitrate and sulfate, organic compounds, and elemental carbon [37]. Anthropogenic
airborne
daily particulate
duration), whichmatter
promotescomes thefrom a variety
photolysis of of
NO sources, including
2 [34,35].including
traffic,
The increase industry,
in ozone commerce,
concentrations
airborne particulate matter comes from a variety of sources, traffic, industry, commerce,
and domestic
registered in heating
Palermo [23].
during the lockdown is linked to two factors: the decrease in NO 2 and the
and domestic heating [23].
The daily
increased solar variation
radiation in[36].
PM10 from 1 January to 31 July for the average values of 2015–2019 and for
The daily variation in PM10 from 1 January to 31 July for the average values of 2015–2019 and for
2020 is shown in Figure 7. The mean concentration of particulate matter from 1 March to 30 April was
2020 is shown in Figure 7. The mean−3concentration of particulate matter from 1 March to 30 April was
3.2. Particulate
higher Matter PM10
during 2015–2019 (35 µg m −3) than in 2020 (20 µg m−3 ), representing a change of −43%. The
higher during 2015–2019 (35 µg m ) than in 2020 (20 µg m ), representing a change of −43%. The
−3
effect of movement restrictions imposed by the authorities from 9 March and subsequently from 21
effectParticulate
of movementmatter in urban areas
restrictions imposedis mainly
by thecomposed
authoritiesof from
mineral dust, metals,
9 March metalloids, sea
and subsequently salts,
from 21
March marked a further overall decrease in PM10 of 45–48% compared to the same period in 2015–
ammonium nitrate and sulfate, organic compounds, and elemental carbon
March marked a further overall decrease in PM10 of 45–48% compared to the same period in 2015– [37]. Anthropogenic
2019. The average values measured from 9 March to 30 April were 36 µg m−3 (2015–2019) and 20 µg
2019. The average values measured from 9 March to 30 April were 36 µg m−3 (2015–2019) and 20 µg
m −3 (2020); from 21 March to 30 April, the mean measured concentrations were 37 µg m−3
−3 (2015–2019)
m (2020); from 21 March to 30 April, the mean measured concentrations were 37 µg m−3 (2015–2019)
and 19 µg m−3 (2020). For the period following the end of the lockdown (1 May to 31 July), the average
and 19 µg m−3 (2020). For the period following the end of the lockdown (1 May to 31 July), the average
measured values were 29 μg m −3 (2015–2019) and 18 μg m −3 (2020), which is a change of −60%. Figure
−3 −3
measured values were 29 μg m (2015–2019) and 18 μg m (2020), which is a change of −60%. Figure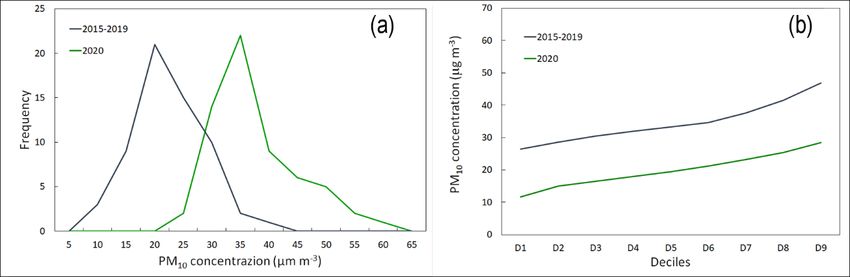
Int. J. Environ. Res. Public Health 2020, 17, 7375 8 of 12
airborne particulate matter comes from a variety of sources, including traffic, industry, commerce,
and domestic heating [23].
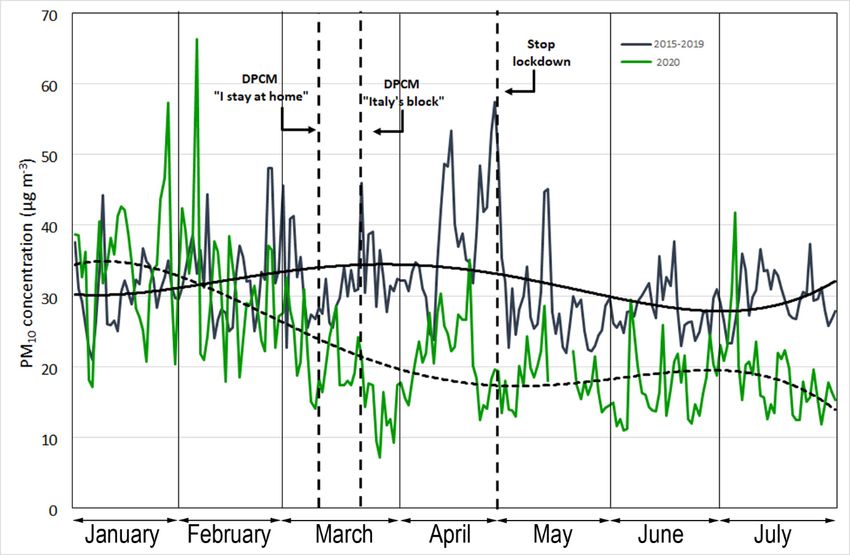
The daily variation in PM10 from 1 January to 31 July for the average values of 2015–2019 and
for 2020 is shown in Figure 7. The mean concentration of particulate matter from 1 March to 30 April
was higher during 2015–2019 (35 µg·m−3 ) than in 2020 (20 µg·m−3 ), representing a change of −43%.
The effect of movement restrictions imposed by the authorities from 9 March and subsequently from
Int.
21 J.March
Environ.marked
Res. PublicaHealth
further 2020,overall
17, x decrease in PM10 of 45–48% compared to the same period 8 of 12
in
2015–2019. The average values measured from 9 March to 30 April were 36 µg·m (2015–2019) and −3
820shows
µg·mthe significant
−3 (2020); fromdifference
21 Marchbetween the two
to 30 April, thefrequency distributions.
mean measured In particular,
concentrations werethe
37 median
µg·m−3
values report concentrations −3 of 35 μg m−3 (2015−2019) and 19.4 μg m−3 (2020).
(2015–2019) and 19 µg·m (2020). For the period following the end of the lockdown (1 May to 31 July),
the average measured values were 29 µg·m−3 (2015–2019) and 18 µg·m−3 (2020), which 8isof a12 change of
Int. J. Environ. Res. Public Health 2020, 17, x
−60%. Figure 8 shows the significant difference between the two frequency distributions. In particular,
the median8 shows
values thereport
significant difference between
concentrations of 35theµg·m −3 (2015−2019)
two frequency distributions.
and In µg·m−3
particular,
19.4 the(2020).
median
values report concentrations of 35 μg m−3 (2015−2019) and 19.4 μg m−3 (2020).
Figure 7. The daily values of ambient concentrations of PM10 (µg m ) measured
−3 from 1 January to 31
Figure 7.
Figure The
7. The dailyvalues
daily valuesof ofambient
ambientconcentrations
concentrationsofofPM PM (µg
1010 m−3)−3
(µg·m ) measured
measured fromfrom 1 January
1 January to
to 31
July. The dotted and solid regression lines indicate the 2020 and 2015-2019 trends, respectively.
31 July.
July. TheThe dotted
dotted andand solid
solid regression
regression lines
lines indicate
indicate thethe
20202020
andand 2015-2019
2015-2019 trends,
trends, respectively.
respectively.
Figure 8. (a) Frequency distribution and (b) deciles of two temporal trends of PM10 concentrations (μg
m−3) from 1 March to 30 April.
The 24 h average daily values of ambient concentrations of PM10, measured at each of the four
Figuresampling
8. (a) Frequency distribution
sites during and (b)are
the study period, deciles of two
reported temporal
in two
Table 4. The trends of and
GC,trends
IND, PM10DBconcentrations
sites showed (μg
Figure 8. (a) Frequency distribution and (b) deciles of temporal of PM10 concentrations
m higher
−3) from 1 percentage
March to changes
30 April. of −43%, −44%, and −53%, respectively, between 1 March and 30 April.
(µg·m−3 ) from 1 March to 30 April.
The
The 24
24 hh average
average daily
daily values
values of
of ambient
ambient concentrations
concentrations of
of PM
PM10 , measured at each of the four
10 , measured at each of the four
sampling
sampling sites during the study period, are reported in Table 4. The GC, IND,
sites during the study period, are reported in Table 4. The GC, IND, and
and DB
DB sites
sites showed
showed
higher
higher percentage changes of −43%, −44%, and −53%, respectively, between 1 March and30
percentage changes of −43%, −44%, and −53%, respectively, between 1 March and 30April.
April.Int. J. Environ. Res. Public Health 2020, 17, 7375 9 of 12
Table 4. Average concentrations of PM10 at individual monitoring stations. Data are expressed in
µg·m−3 . Parametric t-test at p < 0.05. The italics indicates not-significant t-test.
2015–2019 2020 % Change t-Test
IND GC CS DB IND GC CS DB IND GC CS DB IND GC CS DB
01/01–/02/29 29 32 31 35 31 32 36 31 6 1 19 −13 −1.3 −0.2 −3.3 3.4
PM10 03/01–04/30 33 34 34 39 19 19 24 18 −44 −43 −30 −53 10.3 12.9 6.2 16.0
05/01–07/31 27 29 27 33 17 17 18 20 −35 −42 −34 −38 11.7 13.8 9.5 14.7
These results can be attributed to the reduction in vehicular traffic as a consequence of the closure
of all schools and universities and the decrease in workers’ movements. This hypothesis is confirmed
by several previous studies conducted in the same area, in which the background value for PM10
was estimated to be around 23 µg·m−3 on the basis of a linear correlation between PM10 and CO and
NO2 [38,39]. Thus, the constant presence of a fraction of PM10 , not strictly related to vehicle emissions,
could result from soil and road dust particle resuspension. Dongarra et al. [39] confirmed that about
50% of particulate matter is produced by road traffic.
The reported data highlight the changes in air quality during the lockdown period. Strict
alternative measures could be envisaged, such as short-term blocks, for pollution reduction in urban
air. Table 5 shows that the decreases in CO, NO2 , and PM10 concentrations can be evaluated starting
from the first six days of block. A statistical evaluation was conducted, which highlighted percentage
changes of concentrations between 31% and 66% for CO, between 30% and 52% for NO2 , and between
24% and 59% for PM10 . The t-test confirmed that the variations observed CO, NO2 , and PM10 between
the lockdown period and the previous five years were statistically significant (2015–2019; p < 0.05).
Table 5. Changes in CO (mg·m−3 ), NO2 (µg·m−3 ), and PM10 (µg·m−3 ) concentrations, assessed in short
periods (6 days) from the start of the lockdown.
2015–2019 2020 % Change t-Test
Median 0.46 0.32 −31
CO 5.054
Mean 0.50 0.37 −27
11 March–16 Median 54 38 −30
NO2 6.648
March Mean 56 43 −23
Median 29.1 22.1 −24
PM10 2.99
Mean 29.4 22.3 −24
Median 0.52 0.22 −58
CO 11.5
Mean 0.58 0.30 −49
17 March–22 Median 57 28 −52
NO2 17.462
March Mean 59 31 −48
Median 27.1 18.6 −31
PM10 5.014
Mean 33.6 19.1 −43
Median 0.48 0.16 −66
CO 15.86
Mean 0.50 0.20 −61
23 March–28 Median 53 25 −52
NO2 15
March Mean 54 29 −47
Median 34.6 14.1 −59
PM10 7.49
Mean 33.8 13.3 −61
Results of the parametric t-test at p < 0.05.
3.3. Pre-Lockdown
To verify the findings of the analysis of this study and the reliability and representativeness of
the 2015–2019 database, a statistical analysis was also conducted to check the percentage changes for
each pollutant from 1 January to 29 February 2020. During this period, the city of Palermo was not
affected by any restrictions related to the COVID-19 pandemic. The results obtained showed that inInt. J. Environ. Res. Public Health 2020, 17, 7375 10 of 12
the period considered, the differences between the average and the median between the two data
series were practically negligible, and the variations were all less than 6% in absolute value for the
arithmetic means and 10% for the medians, as shown in Table 6. The data obtained confirmed, despite
the many variables involved, the reliability and representativeness of the 2015–2019 database used for
the comparison.
Table 6. Statistical description of the data from 1 January to 29 February.
1 January–29 February
2015–2019 2020 % Change
Median 0.56 0.50 −11
CO Mean 0.63 0.66 6
St. Dev. 0.34 0.50
Median 52 51 −3
NO2 Mean 54 54 0
St. Dev. 6 11
Median 31 32 3
PM10 Mean 32 33 2
St. Dev. 6 9
CO data expressed in mg·m−3 , NO2 data expressed in µg·m−3 , PM10 data expressed in µg·m−3 .
4. Conclusions
Air pollution studies should be considered as part of an integrated approach for sustainable
development and the protection of human health. The national lockdown during the COVID-19
pandemic provided an opportunity to work on improving air quality. The results of this study
demonstrate that anthropogenic activities strongly influence air quality. The lockdown period
produced a sharp reduction in all pollutants that are closely linked to vehicular traffic. In the urban
area of Palermo (Italy) from 10 March to 30 April, the concentrations of CO, NO2 , and PM10 decreased
to about 51%, 50%, and 45%, respectively. The period of forced block produced decreases in the
concentrations of CO, NO2 , and PM10 from the first six days of lockdown. The lack of a decrease of
tropospheric ozone during the block due to non-linear chemical effects showed that these reductions
will remain challenging, even with effective policies to reduce primary pollutants.
The findings reported here are a useful indication for competent authorities to rethink existing
regulatory plans and provide assurance for the implementation of rigorous alternative measures such
as short-term blocks to produce a real improvement in air quality.
Author Contributions: Conceptualization, M.V., D.V., and M.G.A.; Methodology, M.V.; Data curation, M.V.;
Formal analysis, M.V., M.G.A., and D.V.; Writing—original draft, M.V., D.V., and M.G.A. All authors have read
and agreed to the published version of the manuscript.
Funding: This research did not receive any specific grant from funding agencies in the public, commercial,
or not-for-profit sectors.
Acknowledgments: We would like to thank the Risorse Ambiente Palermo (RAP) (http://www.rapspa.it/site/)
for providing us with the PM10 data and the gaseous pollutants information. In particular, our sincere gratitude
is due to Michela Cirrito and Nicoletta Marramaldo (RAP Laboratory staff) for data collection during the
COVID-19 lockdown.
Conflicts of Interest: The authors declare no conflict of interest.
References
1. Mahato, S.; Pal, S.; Ghosh, K.G. Effect of lockdown amid COVID-19 pandemic on air quality of the megacity
Delhi, India. Sci. Total Environ. 2020, 730, 1–23. [CrossRef] [PubMed]Int. J. Environ. Res. Public Health 2020, 17, 7375 11 of 12
2. WHO. 2020. Available online: https://www.who.int/emergencies/diseases/novel-coronavirus-2019 (accessed
on 4 October 2020).
3. Dutheil, F.; Baker, J.S.; Navel, V. COVID-19 as a factor influencing air pollution? Environ. Pollut. 2020, 263,
114466. [CrossRef] [PubMed]
4. DPCM 9 Marzo 2020, n. DPCM 9 Marzo 2020, n. 14. Ulteriori disposizioni attuative del decreto-legge
23 febbraio 2020, n. 6, recante misure urgenti in materia di contenimento e gestione dell’emergenza
epidemiologica da COVID-19, applicabili sull’intero territorio nazionale. (20A01558) (GU Serie Generale n.62
del 09-03-2020). Available online: https://www.gazzettaufficiale.it/eli/id/2020/03/09/20A01558/sg (accessed on
10 March 2020).
5. DPCM 21 Marzo 2020. Ulteriori misure urgenti in materia di contenimento e gestione dell’emergenza
epidemiologica da COVID-19, applicabili sull’intero territorio nazionale. (GU Serie Generale n.75 del
22-03-2020). Available online: https://www.gazzettaufficiale.it/eli/id/2020/03/22/20A01806/sg (accessed on 22
March 2020).
6. Conticini, E.; Frediani, B.; Caro, D. Can atmospheric pollution be considered a co-factor in extremely high
level of SARS-CoV-2 lethality in Northern Italy? Environ. Pollut. 2020, 114465. [CrossRef] [PubMed]
7. Fattorini, D.; Regoli, F. Role of the chronic air pollution levels in the Covid-19 outbreak risk in Italy.
Environ. Pollut. 2020, 264, 114732. [CrossRef] [PubMed]
8. Brauer, M. How much, how long, what, and where: Air pollution exposure assessment for epidemiologic
studies of respiratory disease. Proc. Am. Thorac. Soc. 2010, 7, 111–115. [CrossRef]
9. Burnett, R.; Chen, H.; Szyszkowicz, M.; Fann, N.; Hubbell, B.; Pope, C.A.; Apte, J.S.; Brauer, M.; Cohen, A.;
Weichenthal, S.; et al. Global estimates of mortality associated with long-term exposure to outdoor fine
particulate matter. Proc. Natl. Acad. Sci. USA 2018, 115, 9592–9597. [CrossRef]
10. Ciencewicki, J.; Jaspers, I. Air pollution and respiratory viral infection. Inhal. Toxicol. 2007, 19, 1135–1146.
[CrossRef]
11. Sedlmaier, N.; Hoppenheidt, K.; Krist, H.; Lehmann, S.; Lang, H.; Büttner, M. Generation of avian influenza
virus (AIV) contaminated fecal fine particulate matter (PM2.5 ): Genome and infectivity detection and
calculation of immission. Vet. Microbiol. 2009, 139, 156–164. [CrossRef]
12. Zhu, Y.; Xie, J.; Huang, F.; Cao, L. Association between short-term exposure to air pollution and COVID-19
infection: Evidence from China. Sci. Total Environ. 2020, 727. [CrossRef]
13. Patel, K. 2020 Airborne Nitrogen Dioxide Plummets over China. Available online: https://www.
earthobservatory.nasa.gov/images/146362/airborne-nitrogen-dioxide-plummets-over-china (accessed on 4
October 2020).
14. Zambrano-Monserrate, M.A.; Alejandra Ruano, M.; Sanchez-Alcalde, L. Indirect effects of COVID-19 on the
environment. Sci. Total Environ. 2020, 728, 138813. [CrossRef]
15. ESA. 2020. Available online: https://www.esa.int/Applications/Observing_the_Earth/Copernicus/Sentinel-
5P/COVID-19_nitrogen_dioxide_over_China (accessed on 4 April 2020).
16. CAMS. 2020. Available online: https://atmosphere.copernicus.eu/amid-coronavirus-outbreak-copernicus-
monitors-reduction-particulate-matter-pm25-over-china (accessed on 4 April 2020).
17. European Environmental Agency. Air Pollution Goes down as Europe Takes Hard Measures to Combat
Coronavirus. European Environment Agency. 2020. Available online: https://www.eea.europa.eu/highlights/
air-pollution-goes-down-as (accessed on 4 October 2020).
18. ESA. 2020. Available online: https://www.esa.int/Applications/Observing_the_Earth/Copernicus/Sentinel-
5P/Coronavirus_lockdown_leading_to_drop_in_pollution_across_Europe (accessed on 4 October 2020).
19. Sharma, P.; Dhar, A. Effect of hydrogen supplementation on engine performance and emissions. Int. J.
Hydrog. Energy 2018, 43, 7570–7580. [CrossRef]
20. Berman, J.D.; Ebisu, K. Changes in U.S. air pollution during the COVID-19 pandemic. Sci. Total Environ.
2020, 739. [CrossRef] [PubMed]
21. CEN. Ambient Air Quality. Standard Method for the Measurement of the Concentration of Nitrogen
Dioxide and Nitrogen Monoxide by Chem-Iluminescence, EN 14211 41. 2005. Available online: https:
//standards.iteh.ai/catalog/standards/cen/181f3d8d-a64c-46fb-b90a-7affd10c7c0b/en-14211-2005 (accessed on
11 June 2008).Int. J. Environ. Res. Public Health 2020, 17, 7375 12 of 12
22. CEN. Air Quality-Determination of the PM10 Fraction of Suspended Particulate Matter-Reference Method
and Field Test Procedure to Demonstrate Reference Equivalence of Measurement Methods, EN123. 1998.
Available online: https://ec.europa.eu/environment/air/pdf/finalwgreporten (accessed on 18 November 1998).
23. Han, X.; Luke, P.N. A review of traffic-related air pollution exposure assessment studies in the developing
world. Environ. Int. 2006, 32, 106–120. [CrossRef]
24. EU-Commission. Directive 2008/50/EC of the European Parliament and of the Council of 21 May 2008 on
Ambient Air Quality and Cleaner Air for Europe. 2008. Available online: https://eur-lex.europa.eu/legal-
content/en/TXT/?uri=CELEX%3A32008L0050 (accessed on 11 June 2008).
25. He, L.; Zhang, S.; Hu, J.; Li, Z.; Zheng, X.; Cao, Y.; Xu, G.; Yan, M.; Wu, Y. On-road emission measurements
of reactive nitrogen compounds from heavy-duty diesel trucks in China. Environ. Pollut. 2020, 114280.
[CrossRef] [PubMed]
26. He, M.Z.; Kinney, P.L.; Li, T.; Chen, C.; Sun, Q.; Ban, J.; Wang, J.; Liu, S.; Goldsmith, J.; Kioumourtzoglou, M.A.
Short- and intermediate-term exposure to NO2 and mortality: A multi-county analysis in China. Environ.
Pollut. 2020, 114165. [CrossRef] [PubMed]
27. ESA. 2020. Available online: https://www.esa.int/Applications/Observing_the_Earth/Co-pernicus/Sentinel-
5P (accessed on 27 March 2020).
28. Muhammad, S.; Long, X.; Muhammad, S. COVID-19 pandemic and environmental pollution: A blessing in
disguise? Sci. Total Environ. 2020, 728, 138813. [CrossRef]
29. Zoran, M.A.; Savastru, R.S.; Savastru, D.M.; Tautan, M.N. Assessing the relationship between ground levels
of ozone (O3 ) and nitrogen dioxide (NO2 ) with coronavirus (COVID-19) in Milan, Italy. Sci. Total Environ.
2020, 740, 14005. [CrossRef] [PubMed]
30. Stockwell, W.R.; Lawson, C.V.; Saunders, E.; Goliff, W.S. A review of tropospheric atmospheric chemistry
and gas-phase chemical mechanisms for air quality modeling. Atmosphere 2012, 3, 1–32. [CrossRef]
31. Finlayson-Pitts, B.J.; Pitts, J.N. Chemistry of Upper and Lower Atmosphere; Academic Press: San Diego, CA,
USA, 2000.
32. Fujita, E.M.; Campbell, D.E.; Stockwell, W.R.; Lawson, D.R. Past and future ozone trends in California’s South
Coast Air Basin: Reconciliation of ambient measurements with past and projected emission inventories.
J. Air Waste Manag. Assoc. 2013, 63, 54–69. [CrossRef]
33. Fujita, E.M.; Stockwell, W.R.; Campbell, D.E.; Keislar, R.E.; Lawson, D.R. Evolution of the magnitude and
spatial extent of the weekend ozone effect in California’s South Coast Air Basin, 1981–2000. J. Air Waste
Manag. Assoc. 2003, 53, 802–815. [CrossRef]
34. Escudero, M.; Segers, A.; Kranenburg, R.; Querol, X.; Alastuey, A.; Borge, R.; de la Paz, D.; Gangoiti, G.;
Schaap, M. Analysis of summer O3 in the Madrid air basin with the LOTOS-EUROS chemical transport
model. Atmos. Chem. Phys. 2019, 19, 14211–14232. [CrossRef]
35. Wang, P.; Qiao, X.; Zhang, H. Modeling PM2.5 and O3 with aerosol feedbacks using WRF/Chem over the
Sichuan Basin, southwestern China. Chemosphere 2020, 254, 126735. [CrossRef]
36. Sharma, S.; Zhang, M.; Anshika, G.J.; Zhang, H.; Kota, S.H. Effect of restricted emissions during COVID-19
on air quality in India. Sci. Total Environ. 2020, 138, 138878. [CrossRef] [PubMed]
37. Varrica, D.; Tamburo, E.; Vultaggio, M.; Di Carlo, I. ATR–FTIR Spectral Analysis and Soluble Components
of PM10 And PM2.5 Particulate Matter over the Urban Area of Palermo (Italy) during Normal Days and
Saharan Events. Int. J. Environ. Res. Public Health 2019, 16, 2507. [CrossRef] [PubMed]
38. Dongarrà, G.; Manno, E.; Varrica, D. Possible markers of traffic-related emissions. Environ. Monit. Assess.
2009, 154, 17–125. [CrossRef]
39. Dongarrà, G.; Manno, E.; Varrica, D.; Lombardo, M.; Vultaggio, M. Study on ambient concentrations of PM10 ,
PM10–2.5 , PM2.5 and gaseous pollutants. Trace elements and chemical speciation of atmospheric particulates.
Atmos. Environ. 2010, 44, 5244–5257. [CrossRef]
© 2020 by the authors. Licensee MDPI, Basel, Switzerland. This article is an open access
article distributed under the terms and conditions of the Creative Commons Attribution
(CC BY) license (http://creativecommons.org/licenses/by/4.0/).You can also read