Use of Enterra Natural Fertilizer (Black Soldier Fly Larvae Digestate) As a Soil Amendment
←
→
Page content transcription
If your browser does not render page correctly, please read the page content below
Use of Enterra Natural Fertilizer
    (Black Soldier Fly Larvae Digestate)
           As a Soil Amendment

Wayne D. Temple, Reed Radley1, Jay Baker-French2, Foster Richardson2
             1
                 Enterra Feed Corp., corresponding author 2The Birds and the Beans

                                              November 2013

     134 – 887 Great Northern Way, Vancouver, British Columbia, Canada, V5T 4T5 604.639.1628 info@enterrafeed.com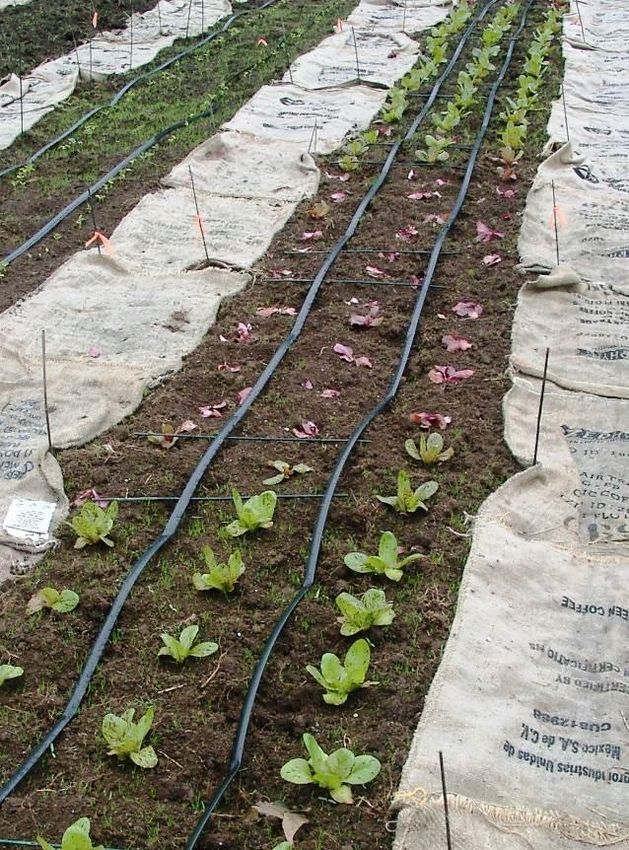
134 – 887 Great Northern Way, Vancouver, British Columbia, Canada, V5T 4T5 604.639.1628 info@enterrafeed.com
Acknowledgements
Funding for this project has been provided by: Agriculture and Agri-Food Canada through the
Canadian Agricultural Adaptation Program (CAAP). In British Columbia, this program is delivered by
the Investment Agriculture Foundation of BC.

We would like to thank all the people who contributed significant time, effort and thought to this
project. At Amara Farm, Neil Turner, Arzeena Hamir, and John Turner; from The Birds and the Beans,
Natasha Tymo and Kelsey Knoll; Art Bomke; Todd Kabuluk (AAFC); Rob Mielcarski; Enterra Feed Corp.;
Bev Herman and the staff at PSAI; National Fungal Identification Service (AAFC)

        134 – 887 Great Northern Way, Vancouver, British Columbia, Canada, V5T 4T5 604.639.1628 info@enterrafeed.com
                                                             iii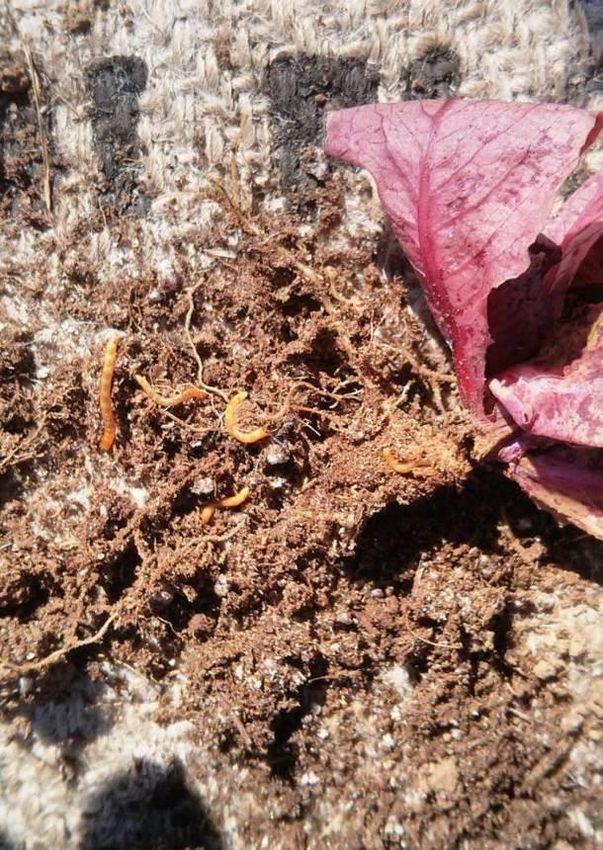
134 – 887 Great Northern Way, Vancouver, British Columbia, Canada, V5T 4T5 604.639.1628 info@enterrafeed.com
                                                     iv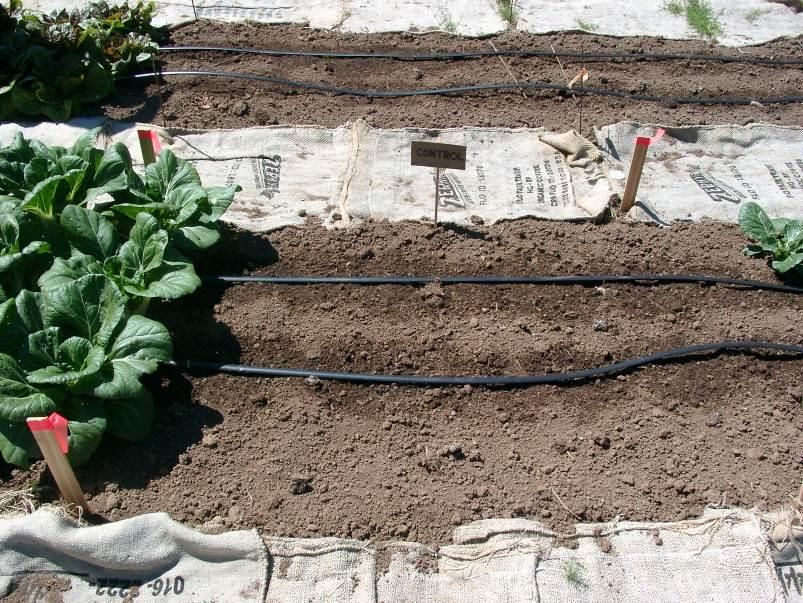
Table of Contents
Acknowledgements...................................................................................................................................... iii
Table of Contents .......................................................................................................................................... v
Executive Summary..................................................................................................................................... vii
Introduction .................................................................................................................................................. 1
Methods ........................................................................................................................................................ 3
   Incubation Trial ......................................................................................................................................... 3
   Field Trial ................................................................................................................................................... 4
   Starter Trial ............................................................................................................................................... 6
   Statistical Analysis ..................................................................................................................................... 6
Incubation Trial ............................................................................................................................................. 6
   Results ....................................................................................................................................................... 7
   Discussion................................................................................................................................................ 11
Field Trial ..................................................................................................................................................... 11
   Results ..................................................................................................................................................... 12
       1st Planting Results .............................................................................................................................. 13
       2nd Planting Results ............................................................................................................................. 20
   Discussion................................................................................................................................................ 23
Starter Trial ................................................................................................................................................. 24
   Results ..................................................................................................................................................... 24
   Discussion................................................................................................................................................ 26
Conclusions and Recommendations ........................................................................................................... 26

             134 – 887 Great Northern Way, Vancouver, British Columbia, Canada, V5T 4T5 604.639.1628 info@enterrafeed.com
                                                                                 v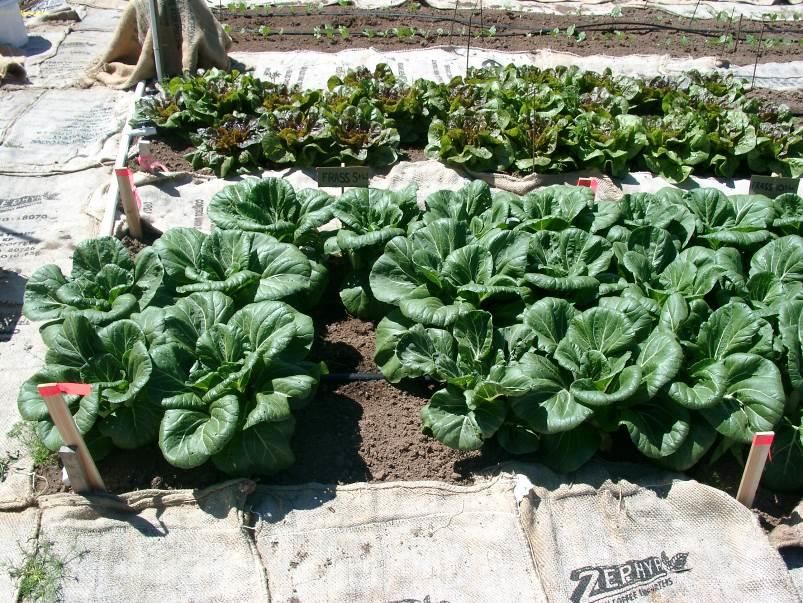
134 – 887 Great Northern Way, Vancouver, British Columbia, Canada, V5T 4T5 604.639.1628 info@enterrafeed.com
                                                     vi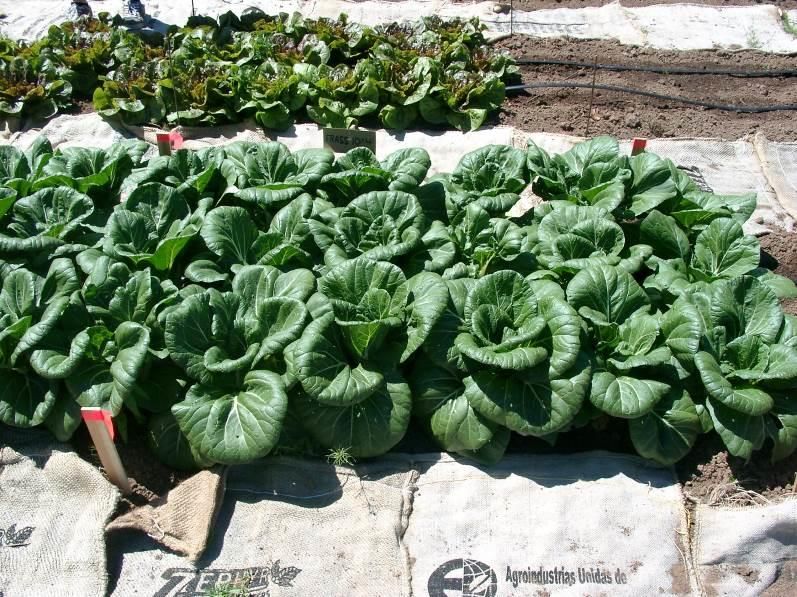
Executive Summary

Certified Organic produce growers face a constant challenge in procuring reliable, sustainable sources of
soil nutrients for intensive crop production. Enterra Feed Corp has developed a bioconversion process
using the larvae of black soldier fly (BSF, Hermetia illucens) to convert food waste into a high-value
animal feed. A co-product of the bioconversion process is Enterra Natural Fertilizer (ENF), the digestate
of the larvae. This project, comprising three trials, evaluated plant nutritional value to establish
recommendations for use of ENF in field and containerized applications.

Incubation Trial: To establish the soil nutrient and mineralization profiles of ENF compared to
commercially available organic fertilizers like composted poultry litter (CPL) and worm castings (WC).

                                  Fertilizer NPK Analysis (%) DW Basis                             % Available of Total
 Fertilizer                      Total         Available       Soluble                    Total       Available       Soluble
   Type                            N             P2O5            K2O                       N            P2O5            K2O
   ENF                           4.66            2.40            3.00                      34             85            100
   CPL                           4.19            1.80            2.90                      30             43            100
    WC                           2.81            0.05            0.05                       4             16             17

The ENF incubation results demonstrate high concentrations of N, P and K relative to other organic
fertilizer sources. The rapid mineralization and early availability of nutrients of ENF are indicative of its
favorable C:N ratio. Relative to the control, each t/ha of ENF raised soil EC by 0.2 dS/m, whereas the
increase in EC associated with the composted poultry litter was 0.1 dS/m.

Field Trial: To establish the efficacy of ENF in supporting commercial yields of four crops in the field at
low, medium and high application levels.
                                                                           ENF increased crop yields for
                            Field Trial Crop Yields                        bok choi, lettuce and potatoes.
                     Lettuce Bok Choi Potatoes Beans                       Fertilizer effects on yield were
     80
                                                                           confounded by mortality;
     70
                                                                           however, surviving plants at the
  Fresh Weight (t/ha)

     60
                                                                           5 and 10 t/ha application rates
     50                                                                    showed increased yields.
     40                                                                    Differences between the 5 and
     30                                                                    10 t/ha rates were minimal.
     20                                                                    Although there were no
     10                                                                    significant differences in
       0                                                                   wireworm populations among
                    0                     5               10               treated plots, ENF may have
                              Application Rate (t/ha)                      provided wireworm protection
                                                                           (under further investigation).

                        134 – 887 Great Northern Way, Vancouver, British Columbia, Canada, V5T 4T5 604.639.1628 info@enterrafeed.com
                                                                            vii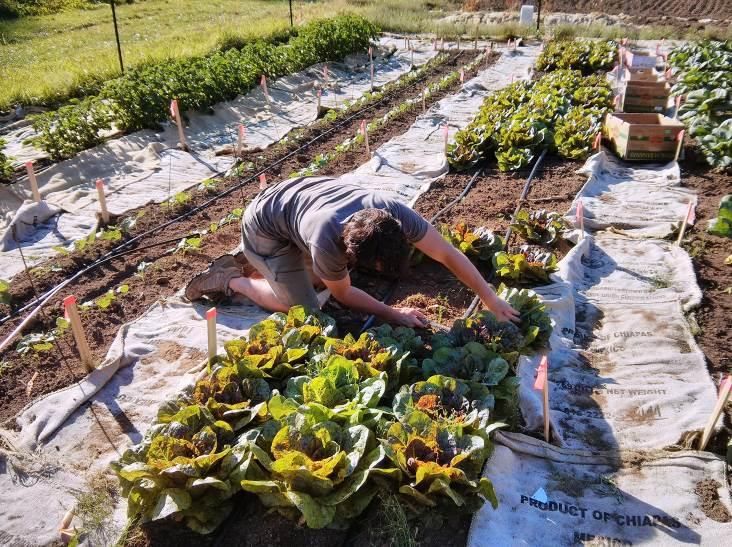
Starter Trial: To establish the optimal ENF application rate for production of starters of six commercial
vegetable crops and compare with worm castings, and to characterize toxicity, if any, at high application
levels.

                                                                     ENF produced larger and healthier/greener crops
                                                                     than worm castings applied at the same rates. The
                                                                     optimal ENF application for biomass yield for
                                                                     lettuce and squash was 5.3% DW/DW (10 t/ha),
                                                                     while 8% (15 t/ha) was optimal for bok choi,
                                                                     tomato, bean, and onion. EC increased with
                                                                     greater ENF applications but remained below
                                                                     critical levels. The cause of declining biomass at
 Lettuce Starters: ENF on right, WC on left, control in centre.      ENF pplications above 10 t/ha is unknown.
Conclusions and Recommendations
Enterra Natural Fertilizer is a well balanced fertilizer comparable to composted poultry litter, but with
higher available N and exchangeable K and a narrow C/N ratio that promotes rapid mineralization when
applied to soil. In the relatively low fertility soil at the test site, field application rates of 5 t/ha supports
                                                                         commercial yields of, bok choi, lettuce
                                                                         and potatoes. It also may have the
                                                                         potential to protect against wireworm.
                                                                         However more research is needed to
                                                                         establish a direct effect and investigate
                                                                         possible mechanisms. Inclusion of
                                                                         Enterra Natural Fertilizer at 5 to 8%
                                                                         DW/DW in peat/perlite starter plant
                                                                         media supports plant growth superior to
                                                                         that of worm castings applied at similar
                                                                         rates. More trials are required to
                                                                         determine optimum use and application
                                                                          method, rate and timing for specific
2013 UFV Field-to-Fork event, Chilliwack, BC.                             crops and soil conditions.

          134 – 887 Great Northern Way, Vancouver, British Columbia, Canada, V5T 4T5 604.639.1628 info@enterrafeed.com
                                                                  viii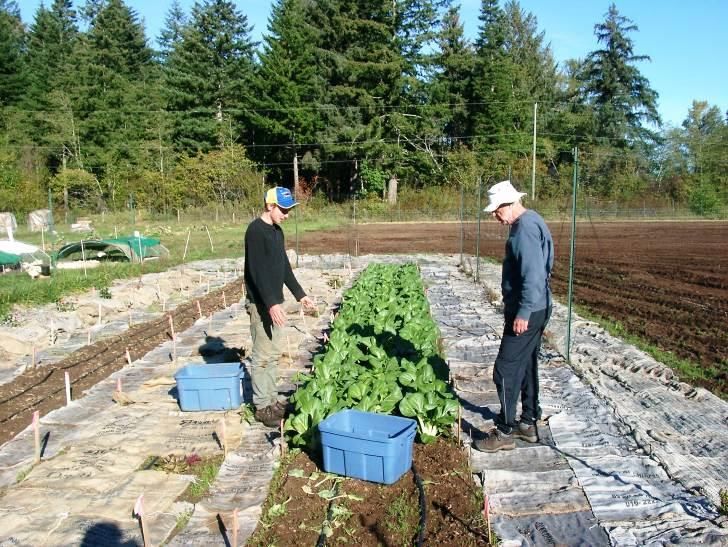
Introduction
Enterra Feed Corporation (formerly Industrious Nature) received an OSDP grant to partially fund
nutritional studies of Enterra Natural Fertilizer (ENF) produced from Black Soldier Fly larvae digestate.
The goal of the project was to collect information to aid in fertilizer registration and formulation of
recommendations for the use of this novel fertilizer in organic agriculture.

Three interlocking studies were designed to examine nutrient dynamics in relatively low fertility soil at a
test site on Vancouver Island. The centrepiece of the project was an incubation trial – detailed
documentation of nutrient release and mineralization over time that compared ENF to two commonly
used organic fertilizers, composted poultry litter (CPL) and worm castings (WC). A field trial tested yield
responses to two application rates of ENF on 4 crops planted in field plots. A third study – the starter
trial – compared ENF and worm castings at increasing rates as fertilizers in the production of starter
plants.

The product analysis of ENF positions it well in comparison to the two other organic fertilizer sources
(Table 1). The most evident attribute is its high nitrogen content: approximately 60% more nitrogen than
either the composted poultry litter or worm castings. In the organic agriculture industry, nitrogen
availability is often a significant limiting factor to production.

Phosphorus and potassium concentrations are also high in Enterra Natural Fertilizer (Table 1), making it
a great source of the three most commonly limiting nutrients. Lower concentrations of calcium and
magnesium are not significant drawbacks as they are infrequently limiting, and easily met with other
sources. The only potentially limiting attribute is the moderately high EC and sodium content.

From a physical perspective, the higher density of the ENF as compared to composted poultry litter
provides an advantage in handling, transportation and ease of application.

    Table 1: Macronutrients, micronutrients, and selected physical and chemical characteristics of the fertilizers used.

 Fertilizer Inputs                                                         Total (%)
                                       C          N            S            P           K         Ca          Mg         Na
 Enterra Natural Fertilizer           42.9       4.54         0.49         1.23        2.44      0.64         0.13      1.67

 Worm Castings                        38.8       2.57         1.78         0.14        0.25      3.45         0.30      0.09

 Composted Poultry Litter             40.7       2.80         0.65         1.81        2.24      3.69         0.66      0.40
             Standard Error            0.6       0.04         0.02          0.03       0.02       0.15        0.01      0.01

 Fertilizer Inputs                                      Total (mg/kg)
                                       Cu         Zn          Fe            Mn          B
 Enterra Natural Fertilizer            11         49           471          13          7

 Worm Castings                         22         42         15231          520        22

 Composted Poultry Litter              91        669          1775          718        31
             Standard Error            0.7         3           204           7         0.6

                                                              1
         134 – 887 Great Northern Way, Vancouver, British Columbia, Canada, V5T 4T5 604.639.1628 info@enterrafeed.com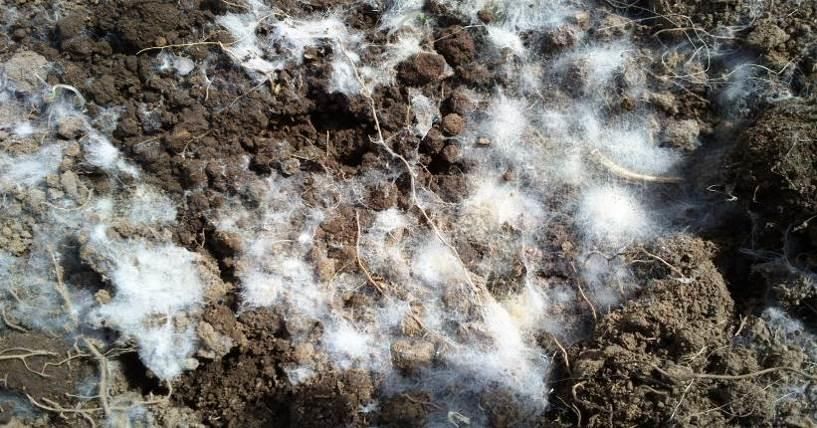
Bulk
                                  Density       LOI      Saturated        EC         C/N      Available (mg/kg)
Fertilizer Inputs
                                           3
                                  (g/cm )       (%)          pH         (dS/m)      Ratio      NH4-N       NO3-N
Enterra Natural Fertilizer          0.49         88          5.5          44         9         9675         538

Worm Castings                       0.50        74           5.0           7         15        1485         1097

Composted Poultry Litter            0.23        79           7.3           11        15        2600         182
            Standard Error          0.01         2           0.04           1        0.5        197          22

                                                             2
        134 – 887 Great Northern Way, Vancouver, British Columbia, Canada, V5T 4T5 604.639.1628 info@enterrafeed.com
Methods
Incubation Trial
Experimental Design:
Three fertilizers were selected for comparison, all at a rate equivalent to 10 t/ha by dry weight, as well
as a control (no fertilizer) and ammonium nitrate applied at 100 kg/ha equivalent to act as an analytical
and performance standard:
1. Control: no fertilizer
2. Enterra Natural Fertilizer (ENF; Enterra Feed Corp.)
3. Worm Castings (WC; Nurturing Nature Brand Vermicompost)
4. Composted Poultry Litter (CPL; Thomas Reid Farms, Langley)
5. Ammonium Nitrate (Sigma)
Plastic tubs (500 ml) with lids were used as incubation containers. Each had four 6 mm holes punched at
intervals just below the rim to provide ventilation. Soil from the field trial site was limed with CaCO3 to
pH 6.5 using the buffered pH lime requirement, then sieved through a 5 mm screen. Prior to application
of treatments, soil was allowed to equilibrate for a period of 2 weeks. Each tub received 300 g of soil
mixed separately with the appropriate amendment prior to loading to minimize variability among the 20
replicates per treatment. Soils were compressed to a bulk density of 1 g/ml after loading in the tubs.
Ammonium nitrate was added in 10 ml aliquots, so 10 ml of water was also added to all other
treatments. Tubs were then randomized and placed into insulated totes and kept between 18 and 20 OC
for the duration of the experiment. Four randomly selected replicate tubs of each treatment were taken
for analysis at the following intervals:
1. T7: sampled 7 days after incorporation of fertilizers
2. T14: sampled 14 days after incorporation of fertilizers
3. T28: sampled 28 days after incorporation of fertilizers
4. T56: sampled 56 days after incorporation of fertilizers
Soil from tubs removed from incubation at each date were air dried for one week before they were
ground, bagged and sent to Pacific Soil Analysis Inc. (PSAI, Richmond, BC) for analysis (for example, Table
2).
Table 2: Characteristics of limed soil used in the incubation trial prior to treatment application (T0). (n=4).
bulk density Leco 2:1 Sat. EC Available N kg/ha Bray P1Exchangeable kg/ha Ca:Mg K:Mg CEC
Soil Use g/cm3 %C %N %S pH dS/m NH4-N NO3-N TAN kg/ha Na K Ca Mg Ratio Ratio meq/100g
Incubation Trial Mean 0.96 4.84 0.32 0.043 5.3 0.68 28 66 94 28 83 101 1913 103 19 0.98 29.7
(Loam) SD 0.02 0.10 0.01 0.002 0.0 0.04 2 1 2 4 12 9 256 3 3 0.06 0.7
The soil used in the incubation trial was a loam. Its CEC value was high but its base saturation was low at
25% (data not shown). Organic matter (%C) was high; available N, pH and salinity levels were low;
available P and exchangeable bases (K, Ca, Mg) were also low, indicating that fertilizer inputs to sustain
intensive vegetable crop production were necessary. The Ca:Mg and K:Mg ratios both suggest that Mg
fertilizer inputs are required.
3
134 – 887 Great Northern Way, Vancouver, British Columbia, Canada, V5T 4T5 604.639.1628 info@enterrafeed.comField Trial
Site
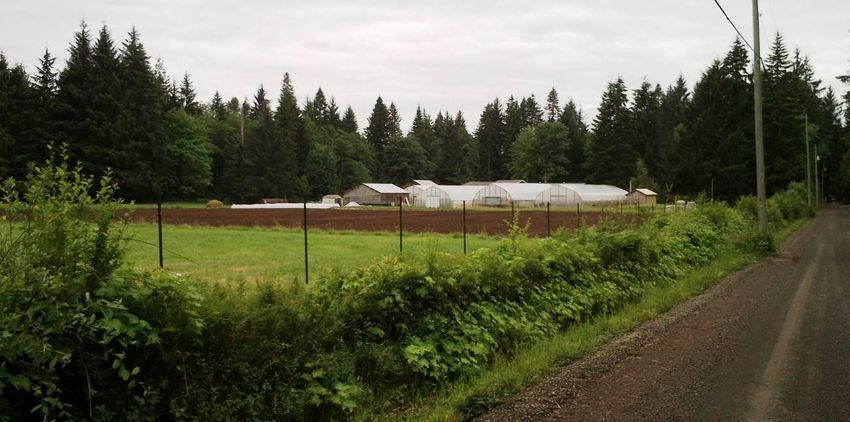
The field trial was sited at Amara Farm in Courtenay, Comox Valley, BC. The soil is valley bottom, fine
textured and semi-poorly drained with a high water holding capacity; and is classified as a Humic
Gleysol. The site, which had been in pasture, was plowed in March. Lime (CaCO3) requirement was
calculated to raise the soil pH to 6.5 and was applied at 10 t/ha.
Experimental Design
For the first planting, three levels of ENF were applied: control (0 t/ha), low (5 t/ha), and high (10 t/ha).
All applications were made on a dry weight basis. A complete randomized block design (n=4) was used
for each crop (Figure 1). For the second planting, lettuce and bok choi plots were split in half with one
half of each plot receiving a 5 t/ha application of ENF and the other receiving no reapplication of ENF.
Amara Farm Frass
Armana ENF Trial Plot Plan - May, 2013 N
BLOCK A BLOCK B BLOCK C BLOCK D
> 1.5m <
1.2 m 2 1 3 3 1 2 3 2 1 1 3 2 BOK
BOKCHOI
CHOY
2 1 3 3 1 2 3 2 1 1 3 2 LETTUCE
6m
2 1 3 3 1 2 3 2 1 1 3 2 BEANS
0.4 m
2 1 3 3 1 2 3 2 1 1 3 2 POTATO
18 m
Treatment #
1 Control
2 ENF
Frass applied at 5 t/ha (dry weight basis)
ENF applied at 10 t/ha (dry weight basis)
3 Frass
Figure 1: Field Trial plot plan for planting 1.
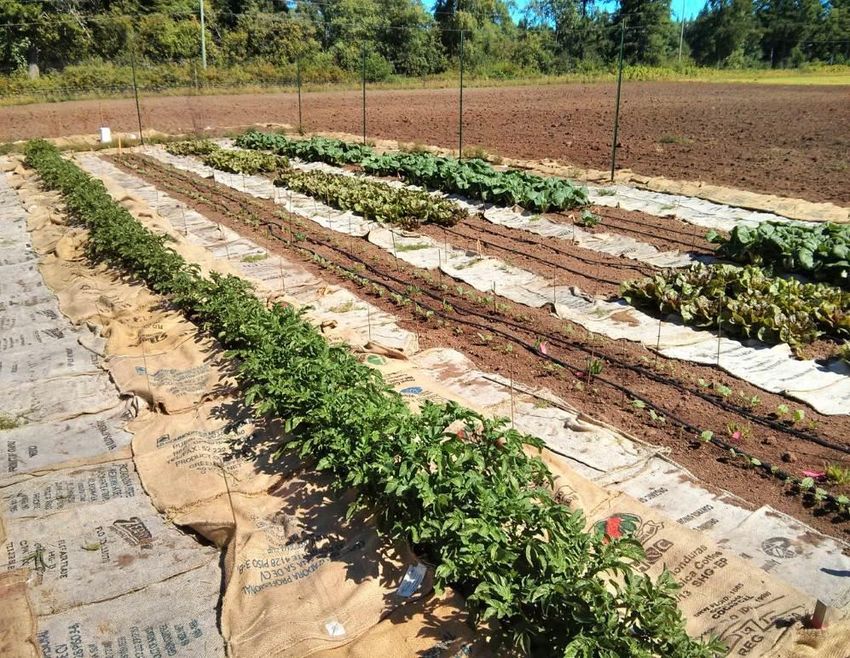
The treatments for planting 1 were applied on June 5th and incorporated to a depth of 15 cm. Plots were
then leveled with rakes, covered with jute coffee sacks and left for 2 weeks. After the 2 week period the
sacks were removed in preparation for planting.
Crops were planted as detailed In Table 3. Lettuce and Bok choi seedlings were started in a peat/perlite
potting medium enriched with alfalfa meal, bone meal, and greensand. Plots were hand weeded
throughout the course of the experiments. Irrigation was applied when water tension readings
exceeded 25 cbar and drip irrigated until the soil water potential reached 10 cbars.
4
134 – 887 Great Northern Way, Vancouver, British Columbia, Canada, V5T 4T5 604.639.1628 info@enterrafeed.comTable 3: Field Trial crop planting log
Crop Date Planted Planting Characteristics
20 cm deep
Potatoes
June 19th Single row down middle
cv. Warba
30 cm between tubers
Beans 4 cm deep
cv. Venture Blue July 11th 2 rows 40 cm apart
Lake 7.5 cm between seeds
Transplanted
Lettuce, planting 1
June 19th 3 rows 30 cm apart
cv. Flashy Trout Back
30 cm between plants
Transplanted
Bok choi, planting 1
June 26th 3 rows 30 cm apart
cv. Joi Choi
40 cm between plants
Each plot split in 2 across row; 9
Lettuce, planting 2
August 21st plants per sub-plot in a 3x3
cv. Flashy Trout Back
square w/ ~20 cm between plants
Bok Choi, planting 2 Same as Lettuce, planting 2
August 21st
cv. Joi Choi
Sampling and Analysis
Data were collected from the field plots in several categories: plant growth and development
(marketable yield, stand characteristics, plant health), plant tissue analysis (nutrient concentrations and
uptakes), and soil analysis (basic soil fertility characteristics).
Growth and Development
Marketable yield and/or above ground biomass of bok choi, lettuce, and beans was determined by
harvesting and weighing plant biomass in each plot, then calculating yield per unit area. Potato
marketable yield was nil for all plots due to excessive wireworm damage, however total tuber biomass
was recorded.
Dry weight yields for bok choi, lettuce, and beans were estimated from moisture contents derived from
grab samples of the marketable harvest. Samples were dried at 70 oC for 72 h.
For lettuce and bok choi, mortality was recorded at intervals from planting through harvest.
Diagnostic Tissue Testing
Bok choi: diagnostic samples were taken according to the Nova Scotia Agriculture worksheet “Vegetable
Crop Tissue Sampling Guide” (Nova Scotia Agriculture, 2010) for cabbage because no bok choi diagnostic
sampling guidelines were available. In addition, a whole-plant sample was taken at harvest to determine
crop nutrient uptake for use in a nutrient budget.
Lettuce, beans, and potatoes: diagnostic samples were taken according to the Nova Scotia Agriculture
worksheet “Vegetable Crop Tissue Sampling Guide” (Nova Scotia Agriculture, 2010). Sample values were
compared to the diagnostic values provided in the worksheet.
5
134 – 887 Great Northern Way, Vancouver, British Columbia, Canada, V5T 4T5 604.639.1628 info@enterrafeed.comSoil Analysis
Plot soils were sampled (0 – 15 cm depth) at planting and at harvest to determine available and residual
soil nutrients. Table 4 presents the soil characteristics analyzed for the field trial prior to planting.
Table 4: Site soil characteristics before lime or fertilizer addition (2 weeks prior to first planting). (n=4).
bulk density Leco 2:1 Sat. EC Available N kg/ha Bray P1Exchangeable kg/ha Ca:Mg K:Mg CEC
Soil Use g/cm3 %C %N %S pH dS/m NH4-N NO3-N TAN kg/ha Na K Ca Mg Ratio Ratio meq/100g
Field Trial Mean 0.78 4.99 0.36 0.049 5.4 0.55 45 29 73 38 71 162 2456 144 17 1.13 35.3
(Loam) SD 0.02 0.25 0.02 0.005 0.1 0.07 4 5 7 5 4 9 72 12 2 0.04 3.2
Starter Trial
Six crops in four replicates for each treatment level were planted to assess the effect of the fertilizers on
a wide variety of crops. A peat and perlite (3:1 by dry weight) starting medium (Table 5) was made and
mixed with ENF or worm castings at 5 different application rates: 0, 5, 10, 15, and 20 t/ha equivalent.
Fertilizer was mixed individually into each replicate at each treatment level to reduce variability among
replicates. Bok choi (var. “Joi Choi”, West Coast Seeds), lettuce (var. “Flashy Trout Back”, Johnny’s
Selected Seeds), snap beans (var. “Venture Blue Lake”, West Coast Seeds), tomatoes (var. “Gardener’s
Delight”, West Coast Seeds), squash (var. “Delicata”, West Coast Seeds) and green onions (var. Kimcho,
West Coast Seeds) were planted in 4 inch pots according to seed packet directions and maintained at
just below field capacity for the duration of the study.
Table 5: Characteristics of the potting medium used in the starter trial. (n=4).
bulk density 2:1 Sat. EC Available N kg/ha Bray P1 Exchangeable kg/ha Ca:Mg K:Mg
Soil Use g/cm3 %N %S pH dS/m NH4-N NO3-N TAN kg/ha Na K Ca Mg Ratio Ratio
Starter Trial Mean 0.16 0.64 0.16 4.2 0.28 264 6 270 14 135 228 5393 968 5.6 0.24
(Peat) SD 0.003 0.07 0.01 0.0 0.03 10 6 14 6 4 25 187 45 0.2 0.02
Statistical Analysis
All data were subjected to analysis of variance (ANOVA). Significance was set at pIn order to determine appropriate application rates of organic fertilizers, it is necessary to determine the
rates at which nutrients become available, the forms in which they are present, as well as the total
available. This allows recommendations for fertilizer use that effectively meet the changing nutrient
demands of a crop over the growing season, thereby economizing on fertilizer use and nutrient losses.
Results
ENF provided the nearly twice the level of available soil nitrogen across the time span of the incubation
trial compared with composted poultry litter. The release of nitrogen from ENF was rapid with much of
it becoming available by day 14. By day 56 available nitrogen level from ENF was still increasing, whereas
the nitrogen levels of the other fertilizers had leveled off (Figure 2). The percentage of total N that was
available by day 56 for the ENF, composted poultry litter, and worm castings was 34%, 30%, and 4%,
respectively (see Table 6). Worm castings provided very little available nitrogen.
Kg of Soil Available N per Tonne of Product
WC ENF CPL
18
16
14
Available N (kg/t)
12
10
8
6
4
2
0
7 14 28 56
Day
Figure 2: Kg soil available N per tonne of product applied over time.
7
134 – 887 Great Northern Way, Vancouver, British Columbia, Canada, V5T 4T5 604.639.1628 info@enterrafeed.comENF provided the second largest amount of phosphorous over the study period after composted poultry
litter which had a higher initial P analysis (Figure 3). All treatments exhibited a reduction in available P
over time as it became immobilized in the soil.
Kg of Soil Available Bray P1 per Tonne of Product
WC ENF CPL
2.5
Available Bray P1 (kg/t)
2.0
1.5
1.0
0.5
0.0
7 14 28 56
Day
Figure 3: Total Soil Available Bray P1 phosphorous over time. Error bars represent standard error.
ENF contributed the most potassium to the soil of the fertilizers studied, although the amount narrowed
to within the range of the composted poultry litter by day 56 (Figure 4). These results suggest that the
exchangeable K becomes available soon after application.
Kg of Soil Exchangeable K per Tonne of Product
WC ENF CPL
30
25
Exchangeable K (kg/t)
20
15
10
5
0
7 14 28 56
Day
Figure 4: Soil exchangeable potassium over time. Error bars represent standard error.
8
134 – 887 Great Northern Way, Vancouver, British Columbia, Canada, V5T 4T5 604.639.1628 info@enterrafeed.comENF has a relatively high EC, reflecting higher salt content than the other fertilizers. ENF produced EC
levels twice those of composted poultry litter (Figure 5). Relative to the control, one t/ha of ENF raised
soil EC by 0.2 dS/m, whereas the increase in EC associated with the composted poultry litter was 0.1
dS/m; that of the worm castings was negligible.
Soil Salinity Levels for Fertilizer Inputs
WC ENF CPL AN Control
3.00
2.50
Saturated EC (dS/m)
2.00
1.50
1.00
0.50
0.00 7 14 28 56
Day
Figure 5: Soil salinity (electrical conductivity) resulting from the various fertilizers over time. Error bars represent standard
error
ENF contributed substantially more sodium to the soil than the other fertilizers (Figure 6). The higher
salinity levels associated with ENF appear to be related to its high sodium content. Sodium levels in ENF
fertilizer may be reduced by reducing high-sodium inputs in the production process.
There appears to have been some sodium immobilization over time, as was observed with other
exchangeable ions and phosphorous.
9
134 – 887 Great Northern Way, Vancouver, British Columbia, Canada, V5T 4T5 604.639.1628 info@enterrafeed.comKg of Soil Exchangeable Na per Tonne of Product
WC ENF CPL
16
Exchangeable Na (kg/t) 14
12
10
8
6
4
2
0
7 14 28 56
Day
Figure 6: Soil exchangeable sodium per tonne of product applied over time. Error bars represent standard error.
By Day 14, soil pH decreased initially under both ENF and composted poultry litter, then increased by
day 28 and subsequently decreased by day 56 (Figure 7). The worm castings treatment followed a
similar trend. The differences in fluctuations among the fertilizers are probably related to soil
nitrification, mineralization and/or salinity-related processes. The high pH of the control by day 56 is
probably a reflection of lime inputs in the absence of fertilizers which acidify, such as the ENF and CPL.
Soil pH Levels for Fertilizer Inputs
WC ENF CPL AN Control
5.5
5.5
5.4
5.4
5.3
pH
5.3
5.2
5.2
5.1
5.1
5.0
7 14 28 56
Day
Figure 7: Soil pH levels resulting from the various fertilizers over time. Error bars represent standard error.
10
134 – 887 Great Northern Way, Vancouver, British Columbia, Canada, V5T 4T5 604.639.1628 info@enterrafeed.comDiscussion
The ENF incubation results demonstrate high concentrations of N, P and K relative to other organic
fertilizer sources (see Table 6). Analysis numbers summing to 10% is unusually rich for an organic
fertilizer. ENF is comparable to composted poultry litter (CPL) in its N, P and K content, however, a
higher proportion of the N and P in the ENF was available. Worm castings (WC) had very low levels of
available N, P and K. The rapid mineralization and early availability of nutrients of ENF are indicative of
its favorable C:N ratio. It is possible that with repeated applications of ENF, accumulated salts could be
problematic in soils already high in salts. In the field study reported below, EC levels remained within the
normally acceptable range for most crops.
Table 6: NPK Analysis of Enterra Natural Fertilizer. Certified analysis provided by SGS Agrifood Laboratories, Guelph, ON.
Fertilizer NPK Analysis (%) DW Basis
Fertilizer Total Available Soluble
Type N P2O5 K2O
ENF 4.66 2.40 3.00
CPL 4.19 1.80 2.90
WC 2.81 0.05 0.05
% Available of Total*
ENF 34 85 100
CPL 30 43 100
WC 4 16 17
*% Available N calculated based on day 56 incubation trial results
Field Trial
The field trial was designed to assess the effect of ENF on a wide variety of crop types ( lettuce, leafy;
Bok Choi, cruciferous; bean, leguminous; potato, tuber) and the impact on soil fertility under field
conditions. Lettuce was included because of its potential susceptibility to wireworm attack.
The site at Amara Farm was selected due to its relatively low N, P, and K levels which should allow for
observation of crop nutritional and soil fertility effects (see Table 4). The site, converted from pasture to
cultivation for this study, was known to have wireworms, however at the time disease pressure was not
deemed sufficient to compromise the nutritional study.
11
134 – 887 Great Northern Way, Vancouver, British Columbia, Canada, V5T 4T5 604.639.1628 info@enterrafeed.comResults
Upon removal of the jute sacks covering the soil – two weeks after ENF application and soil
incorporation - in preparation for planting, a dense network of fungal growth was observed on the ENF-
treated plots but not the controls (Picture 1 and Picture 2). This fungus has been identified as Mucor
circinelloides f. griseocyanus and Mucor circinelloides f. circinelloides (ID provided by National Fungal
Identification Service, Agriculture and Agri-Food Canada). Members of the genus Mucor are ubiquitous
and found in soil, on plant surfaces and decaying vegetable matter, and in the digestive tracts of many
animals.
Picture 1: Fungal networks were present only in the plots Picture 2: Close-up of fungal network.
receiving ENF.
12
134 – 887 Great Northern Way, Vancouver, British Columbia, Canada, V5T 4T5 604.639.1628 info@enterrafeed.com1st Planting Results
Soil Analysis – 1st Planting
Total Available Nitrogen (TAN = NH4-N plus NO3-N), exchangeable K, Na and salinity (EC) all showed
significant and proportional responses to 0, 5 and 10 t/ha ENF applications (Table 7).
For available Bray P1 only the plots designated for Bok Choi showed significant differences with
increasing ENF application rate. Plots designated for the other crops failed to show this trend for
unknown reasons. Correspondingly, Bok Choi was the only crop to demonstrate significantly increased
tissue P concentrations with increasing ENF (see Table 8; Plant Tissue Analysis section below).
The amount of TAN provided by ENF applications closely matched the amount observed in the
incubation trial (approximately 12-14 kg/t; see Figure 2). This validated the predictive value of the
incubation study. Residual TAN maintained its positive response to ENF application. Values remained
below the high risk level suggested to avoid nitrogen pollution (http://www.agf.gov.bc.ca/resmgmt/
EnviroFarmPlanning/FV_SoilNutrientStudy/_FVSNS-CombinedReport_Feb28_2007_for_Release.pdf).
At the 10 t/ha rate, EC levels were still within the range generally regarded as safe for crop production (<
2 dS/m). By harvest, salinity levels had dropped substantially for all crops. This was probably related to
crop uptake, and possibly leaching associated with heavy rain events during the growing period. (see
relevant sections below).
st
Table 7: 1 Planting Field Crop Soil Fertility Results with Respect to ENF Applications. Numbers in bold are statistically
significant at the 5% significance level.
1st Planting Field Crop Soil Fertility Results with Respect to ENF Applications
ENF At Planting Residual At Planting At Harvest
Field Applications Available (kg/ha) TAN Saturated Paste Saturated Paste
Crop (t/ha) TAN Bray P Exch. K Exch. Na (kg/ha) pH EC (dS/m) pH EC (dS/m)
0 108 61 136 108 55 5.3 1.03 5.8 0.76
5 177 65 230 145 68 5.3 1.33 5.7 0.97
Bean
10 267 68 332 232 93 5.3 1.78 5.7 1.08
SE 9 2 18 17 8 0.1 0.11 0.1 0.06
0 110 58 163 87 63 5.5 0.85 5.2 0.72
5 158 60 253 154 78 5.4 1.53 5.2 0.91
Potato
10 221 69 280 185 161 5.5 1.83 5.1 1.15
SE 3 5 14 8 8 0.1 0.20 0.1 0.10
0 135 46 136 108 62 5.2 1.02 5.3 0.50
5 209 60 230 146 75 5.3 1.40 5.3 0.54
Lettuce
10 280 57 332 232 105 5.3 1.50 5.1 0.87
SE 12 4 18 17 7 0.1 0.12 0.1 0.06
0 143 51 136 85 48 5.2 0.98 5.3 0.47
5 201 58 203 143 55 5.3 1.16 5.4 0.50
Bok Choi
10 263 68 294 201 92 5.3 1.61 5.2 0.70
SE 16 4 14 8 7 0.1 0.07 0.1 0.07
Plant Tissue Analysis – 1st Planting
Table 8 shows results of diagnostic tissue analyses. Despite, vigorous growth and healthy appearance
that supported good yields, P and K deficiencies were recorded from diagnostic tissue analyses for
lettuce and beans. No nitrogen deficiencies were detected in any of the tissue samples. Potato tissue
13
134 – 887 Great Northern Way, Vancouver, British Columbia, Canada, V5T 4T5 604.639.1628 info@enterrafeed.comnitrogen levels showed a statistically significant increase with increasing ENF application rate. Lettuce
showed excessive N concentrations in the 5 and 10 t/ha treatments.
Lettuce and bean tissue analysis showed P deficiencies in all treatments on this P-deficient soil, and,
along with potatoes, showed no P response to ENF applications. This corresponds to P availability in the
soil analyses, which also failed to show increased P levels with increasing fertilization. P may be
immobilized in this low pH soil rich in Al and Fe which tend to form insoluble complexes with
phosphorus. However, in the bok choi plots where ENF raised soil P levels, this increase was reflected in
the tissue analyses.
On this low K soil, all crops exhibited a positive K response to ENF applications: lettuce was only
deficient in the control treatment, while beans had K deficiencies in the control and 5 t/ha treatments
with adequate levels achieved in the 10 t/ha treatment. Bok choi had excessive consumption K levels
associated with ENF applications of 5 and 10 t/ha.
Lettuce exhibited Ca deficiency despite ENF application. This was probably induced by the large amounts
of K added to the soil by the ENF in the absence of adequate inherent soil Ca and Mg levels. The soil
Ca:Mg and K:Mg ratios were greater than 8 and 2, respectively (data not shown). To alleviate these Ca
and Mg imbalances, these soils would benefit from the use of dolomite lime or Sul-Po-Mag fertilizers.
Table 8: Diagnostic tissue analysis results. Diagnostic values taken from http://novascotia.ca/agri/documents/lab-
services/analytical-lab-vegecroptissue.pdf. Values in bold are statistically significant at to 5% significance level.
Deficient Excessive
Field ENF Applications Total %
Crop (kg/ha) N P K Ca Mg
0 3.87 0.26 1.09 1.66 0.32
5 4.07 0.24 1.76 1.79 0.27
Bean
10 3.98 0.26 2.02 1.67 0.27
SE 0.11 0.01 0.08 0.07 0.02
0 3.96 0.27 2.02 2.12 0.66
5 4.12 0.29 3.07 2.57 0.69
Potato
10 4.44 0.29 3.20 2.33 0.61
SE 0.11 0.01 0.25 0.16 0.07
0 3.26 0.22 1.92 1.35 0.52
5 3.49 0.17 3.82 1.20 0.37
Lettuce
10 3.73 0.20 4.33 1.18 0.37
SE 0.13 0.01 0.25 0.08 0.04
0 4.15 0.32 2.95 4.06 0.37
5 4.50 0.50 4.95 3.79 0.28
Bok Choi
10 4.62 0.47 5.64 3.51 0.26
SE 0.13 0.04 0.30 0.21 0.01
14
134 – 887 Great Northern Way, Vancouver, British Columbia, Canada, V5T 4T5 604.639.1628 info@enterrafeed.comGrowth, Development, and Yields – 1st Planting
First planting marketable yields of lettuce and bok choi were greatly affected by ENF application, with
virtually no yield from the control plots (Figure 8). This effect was probably due to high mortality caused
by wireworm (Figure 9, Picture 3) in the control plots; ENF may have provided wireworm protection to
lettuce and bok choi plants in the first planting. Given that there was no statistically significant
difference in the low mortality rates between the 5 and 10 t /ha bok choi plots, the statistically
significant yield difference observed can be attributed to fertilization. For lettuce, there were no
differences between 5 and 10 t/ha treatments either in mortality or yield, however both had higher than
expected mortality of about 30%.
Field Trial Lettuce and Bok Choi Marketable Yields
Lettuce Bok Choi
80
70
Fresh Weight (t/ha)
60
50
40
30
20
10
0
0 5 10
Application Rate (t/ha)
Figure 8: Marketable yields of bok choi and lettuce from the first planting. Error bars represent standard error.
Field Trial Lettuce & Bok Choi Mortality
Lettuce Bok Choi
100
90
80
Mortality (%)
70
60
50
40
30
20
10
0
0 5 10
Application Rate (t/ha)
Figure 9: Mortality of lettuce and bok choi for the first planting.
15
134 – 887 Great Northern Way, Vancouver, British Columbia, Canada, V5T 4T5 604.639.1628 info@enterrafeed.comPicture 4: Lettuce mortality was near 100% in plots not receiving ENF. Green plants are in the plots where the ENF/frass was
applied at either 5 or 10 t/ha, whereas the red wilted plants are in plots which received no ENF and have died.
There were no statistically significant ENF treatment effects on wireworm counts (Table 9), and lettuce
mortality did not correlate with the number of wireworms present (data not shown); the possible
wireworm inhibition effect of ENF may not be associated with a lower wireworm population. The
observed number of dead wireworms was also very low. Note: the wireworm population present in the
field trial soil was far above levels considered critical for economic damage (> 4 wireworms per trap).
Such high wireworm populations are not uncommon in fields recently converted from pasture to
cultivated crops, as was this field.
Table 9: Average wireworm trap counts in the field trial site. Both samples were taken at least 2 weeks after ENF was
incorporated into the soil.
0 t/ha 5 t/ha 10 t/ha
Lettuce (w/ plants) 25 15 19
Beans (no plants) 12 18 17
16
134 – 887 Great Northern Way, Vancouver, British Columbia, Canada, V5T 4T5 604.639.1628 info@enterrafeed.comA B
C
D
Picture 5: Nearly all bok choi plants in controls in planting 1 were dead (A), whereas those in ENF treated plots were partially
protected (B). Even healthy bok choi plants (those growing in ENF treated plots; C) often had wireworms feeding at their bases
(D).
17
134 – 887 Great Northern Way, Vancouver, British Columbia, Canada, V5T 4T5 604.639.1628 info@enterrafeed.comMarketable yield of beans tended to decrease with increasing ENF applications while leaf and stem
weights increased (Figure 10). The heavier vegetative growth observed in the 5 and 10 t/ha treatments
were probably associated with delayed senescence induced by higher soil nitrogen levels. In addition,
the late planting of the beans necessitated an early harvest due to weather conditions. There were no
differences in mortality amongst the treatments, although wireworm damage to the cotyledons was
present in all plots. ENF applicationwas not associated with lowered mortality or higher yield.
Bean Yields
Marketable Beans & Leaf and Stem Weights
Beans Leaf & Stem
70
60
Fresh Weight (t/ha)
50
40
30
20
10
0
0 5 10
Application Rate (t/ha)
Figure 10: Bean yields across fertilizer treatment levels. Error bars represent standard error.
There was a statistically significant difference in potato tuber yield (weight) between the control and
both the 5 and 10 t/ha treatment, but no further yield increase was obtained by applying 10 t/ha (Figure
11). The same results were obtained for above ground biomass (data not shown). There did not appear
to be mortality differences among treatments; however, wireworm damage to tubers reduced
marketable yield to zero across treatments. ENF was not associated with reduced tuber damage.
18
134 – 887 Great Northern Way, Vancouver, British Columbia, Canada, V5T 4T5 604.639.1628 info@enterrafeed.comPotato Tuber Yield by Weight Size Class
100 g
40
35
Fresh Yield (t/ha)
30
25
20
15
10
5
0
0 5 10
Application Rate (t/ha)
Figure 11: Potato tuber yields partitioned into size classes across fertilizer treatment levels. Error bars represent the standard
error of the total tuber yields for each treatment.
Nutrient Budgeting/Uptakes –Bok Choi 1st Planting
Additional analyses to allow description of a nutrient budget were undertaken for the bok choi crop.
Total available nitrogen (TAN) at planting for the 5 and 10 t/ha ENF applications were 200 and 250 t/ha,
respectively (Figure 12). Crop removal (crop N uptake) plus residual soil N at harvest approximately
equaled the amount available at planting. The values for the control treatments lacked significant N
uptake due to high mortality. The low levels of residual TAN in the controls may be related to a number
of factors but is most likely the result of leaching.
1st Planting Bok Choi N-Budget
TAN @ planting N uptake TAN Residual
300
N (kg/ha)
250
200
150
100
50
0
0 5 10
Application Rate (t/ha)
Figure 12: Bok Choi N budget. Error bars represent standard error.
19
134 – 887 Great Northern Way, Vancouver, British Columbia, Canada, V5T 4T5 604.639.1628 info@enterrafeed.comBok choi NPK uptakes closely followed crop yields (Figure 13; Figure 8 ). The negligible uptake observed
by the controls was due to poor plant survival at the site. There was little difference in NPK uptakes
between the 5 and 10 t/ha applications of ENF. For both 5 and 10 t/ha applications, the NPK uptakes
were approximately 140, 20, and 130 kg/ha, respectively. This indicates that a 5 t/ha application of ENF
is probably sufficient for commercial yields of bok choi.
1st Planting Bok Choi NPK Crop Uptake
N uptake P uptake K uptake
180
Crop Uptake (kg/ha)
160
140
120
100
80
60
40
20
0
0 5 10
Application Rate (t/ha)
st
Figure 13: 1 Planting Bok Choi NPK Crop Uptake values. Error bars represent standard error.
2nd Planting Results
Upon removal of sacks one week after the second application of ENF, the fungus depicted in picture 1
and 2 (see above), was again evident only in the plots which had received the second application of ENF.
Soil Analysis – 2nd Planting
With reapplication of ENF at 5 t/ha, significant increases in TAN and exchangeable K were observed and
these increases were proportional to the original 0, 5 and 10 t/ha applications of ENF (Figure 14). As
observed for the first application, no such trends were evident for Bray P1.
20
134 – 887 Great Northern Way, Vancouver, British Columbia, Canada, V5T 4T5 604.639.1628 info@enterrafeed.com2nd Planting Bok Choi
Soil Available NPK at Planting
TAN Bray P Exch. K
300
Soil Available (kg/ha)
250
200
150
100
50
0
0 5 10 0 5 10
With 5 t/ha ENF reapplication No ENF reapplication
Application Rate (t/ha)
Figure 14: 2nd Planting Bok Choi Soil Available NPK at Planting. Error bars represent standard error.
Growth, Development, and Yields – 2nd Planting
Unlike the first planting, bok choi control plants demonstrated higher survivorship than lettuce, with
high survival rates despite the wireworm infestation present at the site (Figure 15). Wireworms were
observed feeding at the base of most bok choi plants, but they did not appear to cause mortality. Other
unknown factors were at play that minimized the impact of wireworms on this Bok choi crop. Lettuce,
on the other hand, demonstrated more acute mortality, even in ENF-treated plots, than was observed
with the first crop planting. Initially, the reapplication of ENF did reduce mortality in the lettuce, but the
effect was short lived. Mortality for lettuce with and without ENF reapplication was approximately 80
and 100%, respectively by 17 September. These contrasting results in the second planting when
compared to the first planting are unexplained. In terms of differing methods, the field soil incubation
period of the ENF prior to planting was two weeks for the 1st planting and one week for the 2nd planting.
21
134 – 887 Great Northern Way, Vancouver, British Columbia, Canada, V5T 4T5 604.639.1628 info@enterrafeed.com2nd Planting Bok Choi and Lettuce Mortality over Time
Lettuce - no ENF reapplication Lettuce - ENF reapplication
Bok Choi - no ENF reapplication Bok Choi - ENF reapplication
100
80
Mortality (%)
60
40
20
0
Date
Figure 15: Mortality of lettuce and bok choi for the second planting. Error bars represent standard error.
Bok choi yields were significantly higher in plots receiving a second application of ENF at 5 t/ha (Figure
16). This application replaced nutrients taken up by the first crop or lost to leaching.
Bok 2nd Planting Marketable Yield
With 5 t/ha frass reapplication No reapplication
60
50
Marketable Yield (t/ha)
40
30
20
10
0
0 5 10
First Planting Application Rate (t/ha)
Figure 16: Marketable yields of bok choi from the second planting. Error bars represent standard error.
22
134 – 887 Great Northern Way, Vancouver, British Columbia, Canada, V5T 4T5 604.639.1628 info@enterrafeed.comNutrient Budgeting/Uptakes – 2nd Planting
Bok choi NPK uptakes were reflective of both the soil nutrient and crop yield responses discussed above
(Figure 14, Figure 16). N and K uptakes were significantly higher in plots receiving a second application
of ENF at 5 t/ha. Significant NPK uptake response to the initial 0, 5, and 10 t/ha ENF applications were
also restricted to the plots receiving a second 5 t/ha application. Plots receiving a second application of
ENF had N uptakes ranging between 80 and 90 kg/ha, whereas plots without a second ENF application
had N uptakes of only approximately 60 kg/ha. For K, plots receiving a second application of ENF took up
between 60 and 90 kg/ha, whereas plots not receiving a second application took up approximately 40
kg/ha. As with soil available P, P uptakes appear to be unaffected by a second application of ENF across
treatments.
2nd Planting Bok Choi
NPK Crop Uptake
N P K
120
Crop Uptake (kg/ha)
100
80
60
40
20
0
0 5 10 0 5 10
With 5 t/ha ENF reapplication No ENF reapplication
Application Rate (t/ha)
nd
Figure 17: 2 Planting Bok Choi NPK Crop Uptake values. Error bars represent standard error.
Discussion
Soil nutrient concentrations in the field trials are consistent with the availability predicted by the
incubation study. Nitrogen levels are significantly elevated in the treated plots, with NH4-N representing
the largest increase. Soil analyses next spring would be useful to assess the residual levels of available
nitrogen and phosphorus from these applications.
The marketable yield of the bok choi and lettuce plantings indicates a significant increase in yield in the
treated plots compared to the control plots which experienced high mortality. Fertilizer effects were
thus confounded, however differences between 5 and 10 t/ha application rates, with similar mortality,
may be attributable to nutritional differences.
In 2 of the 6 plantings in this field experiment, ENF was associated with reduced crop damage. The high
mortality in control plots was associated with wireworms, although conflicting wireworm trap counts
show no evidence of reduced wireworm populations in treated plots. The mechanism through which
ENF appeared to decrease mortality in first planting lettuce and bok choi is unknown. Increased vigour
23
134 – 887 Great Northern Way, Vancouver, British Columbia, Canada, V5T 4T5 604.639.1628 info@enterrafeed.comof the crops may have allowed them to withstand wireworm feeding until well established.
Alternatively, ENF may have somehow reduced wireworm activity. The trap and core samples taken
from the plots provided little evidence of dead wireworms. ENF may have acted as a deterrent.
Uniformly damaged potato tubers and bean cotyledons across all treatments suggest that the
wireworms were neither repelled nor deterred. The Mucor fungus that became so evident shortly after
ENF application or some other fungus associated with ENF applications may be having some effect.
Insect frass has long been claimed to exhibit pest control properties, anecdotally and in product
advertising. The claimed effects are usually ascribed to the presumed chitin content of shed insect
integument that remains in the insect digestate (frass). However, the biological chitin, chitosan and/or
chitinases activity and its potential effects as a biological control agent for ENF is unknown. To the
authors’ knowledge, there have been no known variations, discoveries and/or documented results that
have definatively demonstrated the practical or potential use of BSF frass/soil fertilizer as a biological
control to wireworm in pest management. The potential biological control of wireworm using ENF
observed at Amara Farm was subsequently disclosed to Todd Kabaluk (wireworm specialist; Pacific Agri-
Food Research Center, Agassiz, BC); he is conducting further research into the potential biological
control mechanisms of wireworm. A protective effect of ENF product could be an important
development for an industry currently lacking any effective means to counter one of our region’s most
prevalent pests.
Starter Trial
The starter trial was intended to test the effect of ENF as a component of an organic seedling growing
medium. The organic industry lacks a diversity of approved products available for growing media and in
the absence of information many growers formulate their own mixes. An organic product capable of
meeting the nutritional needs of seedlings in such a medium would be of value to many producers.
Worm castings are a common component of organic soil media and were chosen as a comparison in this
study. A wide range of application rates was selected to provide a response curve.
Results
Seedlings showed a positive yield response to increasing applications of ENF (Figure 18). Yield responses
to ENF were much greater than those observed with similar rates of worm castings. Applications of ENF
in excess of 15 t/ha (for bok choi, onions, beans, and tomatoes) or 10 t/ha (for lettuce and squash)
resulted in decreased above ground biomass.
24
134 – 887 Great Northern Way, Vancouver, British Columbia, Canada, V5T 4T5 604.639.1628 info@enterrafeed.comFigure 18: Starter trial biomass yields and related photos. In photos, ENF treated starts are on left, worm castings on right;
control is center column. Error bars represent standard error.
A Bok Choi Starter Yields
B Onion Starter Yields
WC ENF WC ENF
1.20 0.20
Dry Yields (g/pot)
1.00
Dry Yield (g/pot)
0.15
0.80
0.60 0.10
0.40
0.05
0.20
0.00 0.00
Application Rate (t/ha) Application Rate (t/ha)
C Bean Starter Yields
D Tomato Starter Yields
WC ENF WC ENF
1.40 0.70
1.20 0.60
Dry Yields (g/pot)
Dry Yield (g/pot)
1.00 0.50
0.80 0.40
0.60 0.30
0.40 0.20
0.20 0.10
0.00 0.00
Application Rate (t/ha) Application Rate (t/ha)
E Lettuce Starter Yields
F Squash Starter Yields
WC ENF WC ENF
0.90
0.80 0.25
Dry Yields (g/pot)
0.70
0.20
Dry Yield (g/pot)
0.60
0.50 0.15
0.40
0.30 0.10
0.20
0.10 0.05
0.00
0.00
Application Rate (t/ha)
Application Rate (t/ha)
25
134 – 887 Great Northern Way, Vancouver, British Columbia, Canada, V5T 4T5 604.639.1628 info@enterrafeed.comBean Soil Saturated Paste EC and pH
ENF EC WC EC
ENF pH WC pH
1.50 4.8
1.25
4.6
1.00
4.4
EC (dS/m)
pH
0.75
4.2
0.50
4.0
0.25
0.00 3.8
0 5 10 15 20
Application Rate (t/ha)
Figure 19: pH and salinity of the bean starter potting medium under ENF and worm castings across fertilizer application rates.
Error bars represent standard error.
The pH and salinity of the ENF-treated bean starter potting medium increased markedly with increasing
applications of ENF, while no major differences were observed in the worm castings-treated medium.
The increased pH probably reflects increasing levels of NH4-N mineralization processes while increased
salinity is probably related to higher levels of sodium at higher application levels. The EC levels observed
at the high end of ENF application in this trial were below known toxicity levels; the reasons for plant
toxicity associated with ENF applications of 15 - 20 t/ha (Figure 18) are unclear at this time,but may
relate to NH4-N toxicity.
Discussion
Inclusion of Enterra Natural Fertilizer at 5 to 8% DW/DW (equivalent to 10 to 15 t/ha) in peat/perlite
starter plant media supports plant growth superior to that of worm castings applied at similar rates.
Many producers currently use worm castings as a component of their starter mixes. Relative to worm
castings, the most beneficial results achieved by ENF at lower application exemplified ENF as a useful
soil or potting growth media amendment.
Conclusions and Recommendations
ENF is a well balanced fertilizer comparable to composted poultry litter, but with higher available N and
exchangeable K and a narrow C:N ratio that promotes rapid mineralization when applied to soil. In the
relatively low fertility soil at the test site, field application rates of 5 t/ha supported commercial yields of
bok choi, lettuce and potatoes. Some evidence in this investigation suggests that ENF may, under some
circumstances, provide some wireworm protection. However these results were not confirmed by a
second ENF application. More research is needed to determine possible mechanisms. Inclusion of ENF
at 5 to 8% DW/DW in peat/perlite starter plant media supports plant growth superior to that of worm
castings applied at similar rates. More trials are required to determine optimum use and application
method, rate and timing for specific crops and soil conditions.
26
134 – 887 Great Northern Way, Vancouver, British Columbia, Canada, V5T 4T5 604.639.1628 info@enterrafeed.comYou can also read