THE AUTUMNAL LOCKDOWN WAS NOT THE MAIN INITIATOR OF THE DECREASE IN SARS-COV-2 CIRCULATION IN FRANCE
←
→
Page content transcription
If your browser does not render page correctly, please read the page content below
ARTICLE
                  https://doi.org/10.1038/s43856-021-00002-6               OPEN

                  The autumnal lockdown was not the main initiator
                  of the decrease in SARS-CoV-2 circulation
                  in France
                  Veronica Pereda-Loth             1,2,
                                                      Aldair Martínez Pineda1, Lenka Tisseyre1,2, Monique Courtade-Saidi 2,
                  Christophe Bousquet             3, Camille Ferdenzi3, Thierry Letellier1, Moustafa Bensafi 3 & Denis Pierron                               1✉

                  Abstract                                                                                                     Plain Language Summary
                  Background In response to the SARS-CoV-2 pandemic, governments have taken drastically                        Non-pharmaceutical measures to
1234567890():,;

                                                                                                                               control the SARS-CoV-2 pandemic
                  restrictive public health measures with significant collateral effects. It is important to
                                                                                                                               and prevent the saturation of health-
                  understand the impact of these measures on SARS-CoV-2 circulation. However, pandemic
                                                                                                                               care systems have a negative impact
                  indicators lag behind the actual level of viral circulation and these delays are an obstacle to              on physical and mental health as well
                  assessing the effectiveness of policy decisions. Here, we propose one way to solve this                      as on the economy. Therefore, it is
                  problem by synchronizing the indicators with viral circulation in a country (France) based on                important to better understand how
                  a landmark event.                                                                                            each measure influences the circula-
                                                                                                                               tion of the virus. In this paper, we
                  Methods Based on a first lockdown, we measured the time lag between the peak of gov-
                                                                                                                               analyze governmental and non-
                  ernmental and non-governmental surveillance indicators and the highest level of virus cir-
                                                                                                                               governmental data and show that
                  culation. This allowed alignment of all surveillance indicators with viral circulation during the            the level of circulation of SARS-CoV-
                  second period of the epidemic, overlaid with the type of public health measures implemented.                 2 in France decreased in autumn
                  Results We show that the second peak in viral circulation in France happened ~21 October                     2020 after the implementation of the
                  2020, during the public health state of emergency but before the lockdown (31 October).                      state of emergency measures and
                  Indicators also suggest that viral circulation decreased earlier in locations where curfews                  curfews but before the implementa-
                                                                                                                               tion of the lockdown. We also show
                  were implemented. Indicators did, however, begin to rise once the autumnal lockdown was
                                                                                                                               that locations where a curfew was
                  lifted and the state of emergency resumed.                                                                   implemented experienced an earlier
                  Conclusions Overall, these results suggest that in France, the 2020 autumnal lockdown was                    decrease in viral circulation. How-
                  not the main initiator of the decrease in SARS-CoV-2 circulation and curfews were important                  ever, circulation of the virus has
                  in achieving control of the transmission. Less-restrictive measures may need to be balanced                  increased following release of the
                  with more-stringent measures to achieve desirable public health outcomes over time.                          lockdown and return to state of
                                                                                                                               emergency measures. This shows
                                                                                                                               that less stringent measures may be
                                                                                                                               sufficient to trigger a decrease in viral
                                                                                                                               circulation, but more restrictive
                                                                                                                               measures may be needed to maintain
                                                                                                                               suppression over time.

                  1 Équipe de Médecine Evolutive, URU EVOLSAN, Faculté de Chirurgie Dentaire, Université Toulouse III, Toulouse, France. 2 GSBMS, faculté de médecine

                  Rangueil, Université Toulouse III, Toulouse, France. 3 Lyon Neuroscience Research Center, CNRS UMR5292, INSERM U1028, Université Claude Bernard Lyon
                  1, Bron, France. ✉email: denis.pierron@univ-tlse3.fr

                  COMMUNICATIONS MEDICINE | (2021)1:7 | https://doi.org/10.1038/s43856-021-00002-6 | www.nature.com/commsmed                                         1
ARTICLE                                                             COMMUNICATIONS MEDICINE | https://doi.org/10.1038/s43856-021-00002-6

D
         uring the past year, SARS-CoV-2 has spread across the              consultations at the ER in hospitals. A number of detected new
         world, resulting in a tremendous loss of human lives and           viral infections (positive and negative) based on nucleic acid are
         overburdened healthcare systems1. In response, many                also downloaded from the French Public Health website. We
governments have taken measures (state of emergency, curfew,                report the raw number as well as the rate of a daily positive
and lockdown) drastically restricting the freedom of their citizens         diagnosis.
to prevent overloading hospitals. The measures with the highest                An online survey was conducted in the French population
degree of restriction have the heaviest societal and economic costs         between 8 April and 10 January 2021 and aimed at characterizing
and also have a negative impact on general health and well-                 chemosensory disorders in people with and without COVID-19,
being2. For instance, lockdowns cost more than an overnight                 as well as their consequences on quality of life. In all, 4628
curfew or a state of emergency3. Therefore, in order to minimize            responses were analyzed (Supplementary Data 2). This survey
these collateral effects on health and society, it is of vital              was approved by the CNRS ethics committee. Data collection was
importance to better understand the impact of these measures on             strictly anonymous. The protocol complies with the revised
the circulation of SARS-CoV-2. From October to December 2020,               Declaration of Helsinki and the study was approved by the ethics
France gradually implemented measures starting with a state of              committee of the Institute of Biological Sciences of the CNRS on
emergency, which is the least restrictive, followed by a curfew and         the 3rd of April 2020 (DPO #TRRECH-467). All individuals
finally a lockdown (see Supplementary Data 1). This provided the             provided informed consent when participating in the survey.
opportunity to verify whether virus diffusion was altered after the            The study of online queries was downloaded from Google
beginning of the most restrictive measures (lockdown), or if it             Trends (https://trends.google.com/), using the R library gtrendsR.
had already been checked by less-restrictive measures such as the           We looked separately for the popularity of the terms: loss of smell
state of emergency and/or the curfew.                                       (perte odorat) and loss of taste (perte goût), using default
   To track the changes in SARS-CoV-2 viral circulation in                  selection of All categories and Web search), within the timeframe
France, several epidemic surveillance indicators are currently              of 1 March 2020 to 10 January 2021. Google Trends do not
used. These include the ratio of consultations for suspected cases          provide the actual numbers of searches but rather a relative score
of COVID-19 to general consultations at the emergency room                  from 0 to 100 (100 correspondings to the day with the greatest
(ER), the number of hospitalizations, the number of admissions              number of searches during the specified time period).
to critical care resuscitation units (CCRU), and the number of
deaths per day caused by COVID-19. However, all of these
indicators lag behind the actual level of viral circulation. For            Statistics. Phasing study: data were analyzed using R software
example, several weeks elapse between the death of an individual            (4.0) and its standard packages (maps, ggplot, etc.). In order to
and the initial viral infection4. These delays are an obstacle to           account for weekend reporting effects and random fluctuation, we
assessing the level of viral circulation in a given territory on a          computed a rolling average over 7 days, for each indicator. Each
daily basis and to relating it to specific events or policy-making           indicator displaying its annual maximum during the spring
decisions.                                                                  lockdown, we computed the number of days between the day
   One way to solve this problem is to synchronize these indi-              before the start of this first lockdown (17th march) and the
cators with viral circulation based on a landmark event. The case           annual maximum of the indicator (its peak). We considered
of the French population provides a useful framework to address             the number of days computed as the delay between the peak of
this issue, indeed in 2020 two periods of heavy SARS-CoV-2                  the indicator and the peak of circulation of the virus. Then, we
circulation have been reported based on the number of deaths                phased all indicators (i.e., 1–google loss of smell; 2–google loss of
and cases (Supplementary Figure 1). In spring, the epidemic was             taste; 3–report of change in smell; ER consultation, hospitaliza-
characterized in France by a sudden increase and decrease in viral          tion, CCRU admission, COVID deaths) to represent virus cir-
circulation. The first lockdown prevented the virus from circu-              culation on specific days (Fig. 1). We also define a composite
lation at its highest level on 17th March1,5–7. Based on this event,        indicator by computing the mean of all indicators and compute
we measured the time lag between the peak of each surveillance              its rolling slope on 7 days. All indicators were weighted equally.
indicator and the highest level of virus circulation. Hence, we             Virologic tests based on PCR were not available nationally during
were able to synchronize and timely phase all surveillance indi-            the first lockdown; we did not include them in this first analysis.
cators with the actual level of virus circulation. This allowed us to          Local study: pandemic indicator data at the departmental level
monitor the circulation of the SARS-CoV-2 virus during the                  were downloaded from the French public health database
second period of the epidemic in France and overlay the gov-                (Supplementary Data 2). For each indicator, we computed a
ernmental response (from a state of emergency to curfew and                 rolling average over 7 days at the department level. For each
then to lockdown). We show that the second peak in viral cir-               indicator, we report the date of the maximal value from 1 October
culation in France happened ~21 October 2020, during the public             to 28 November. Curfew dates by the department were found on
health state of emergency but before the autumnal lockdown.                 the official government website https://www.gouvernement.fr/
Indicators also suggest that viral circulation decreased earlier in         info-coronavirus. Curfew was declared on the whole Paris region
locations where curfews were implemented and began to rise once             (Ile-de-France) and major metropolises and later on specific
the autumnal lockdown was lifted.                                           departments. Metropolises represent a cluster of cities merged
                                                                            together, for example, Toulouse metropolis regroups 37 cities and
Methods                                                                     750 000 inhabitants. Metropolises and departments are two
Data set. Governmental indicators regarding the healthcare sys-             distinct french administrative entities since a department includes
tem in France (ER consultation, hospitalizations, CCRU admis-               metropolises as well as less populated countryside regions.
sion and deaths, PCR) were downloaded on 25 February 2021                   Epidemiologic data being available at the department scale, we
from the French Public Health website https://www.data.gouv.fr/             assimilated metropolises and department. This is a reasonable
fr/pages/donnees-coronavirus. Hospitalization, CCRU admission,              extension since the metropolises not only regroup most of the
and death indicators correspond to the new number of cases by               inhabitants, it also regroups most of the night activity as well as
day. ER consultation ratio corresponds to the ratio of consulta-            the population impacted by curfew such as students. Moreover,
tion with a medical diagnosis of COVID-19 over the general                  considering the results (importance of the early curfew), this is a

2                       COMMUNICATIONS MEDICINE | (2021)1:7 | https://doi.org/10.1038/s43856-021-00002-6 | www.nature.com/commsmed
COMMUNICATIONS MEDICINE | https://doi.org/10.1038/s43856-021-00002-6 ARTICLE
Fig. 1 Estimation of the level of SARS-CoV-2 circulation in France in 2020. All the trends have been shifted by their respective number of days to get the
peaks to align for the first period of maximal virus circulation. a Phased governmental indicators: number of CCRU admissions, hospital admissions, number
of daily deaths related to COVID, and ER ratio of consultations for suspected cases of COVID-19. b Population-based indicators: (1) level of online request
for taste loss (perte gout), (2) smell loss (perte odorat), (3) day of first notice of smell change on the crowd-sourced survey. c Progression of the slope of
the composite indicator (representing the mean of all indicators). CCRU adm critical care resuscitation unit admission, ER consultation emergency room
consultation, Hospital adm hospital admission, SoE State of Emergency.
conservative approach since we grouped under curfew location the distribution of delay compute a standard deviation and get an
where curfew was actually not implemented. estimation of the variability. We obtained a standard deviation of
5 days for ER ratio, 6 days for CCRU admission and hospitali-
zation, the largest variation is for the death SD = 8 days. The
Reporting summary. Further information on research design is
computation of the standard errors reveals values under 1 day for
available in the Nature Research Reporting Summary linked to
all indicators (ranging from 0.5 to 0.8) demonstrating a relatively
this article.
low level of uncertainty. These results are consistent with the
chronology of pathological symptomatology4 (see discussion).
Results Based on these numbers, we, therefore, phased all the indicators
To monitor the circulation of the SARS-CoV-2, we collected using a unique reference time point, namely the first peak in viral
surveillance indicator data from independent sources: (1) gov- circulation (Fig. 1a and b). Furthermore, we computed the slope
ernmental statistics (https://geodes.santepubliquefrance.fr) of a composite indicator based on the mean value of all the
healthcare system data compiled by the French health ministry: indicators (Fig. 1c).
ER ratio of consultation for COVID-19, daily number of hospi- The results show that a second peak in viral circulation in
talization for COVID-19, daily number of admission in CCRU for France was around the 21st of October based on the composite
COVID-19, daily number of deaths for COVID-19, and (2) indicator. Five of the seven indicators converge to a peak within a
population-based tools that monitor chemosensory changes 5-day period between Monday, 19th October and Saturday, 24th
(smell and taste change linked to COVID-19 were followed by October. The crowd-sourced survey suggests a peak as early as
one crowd-sourced survey (https://project.crnl.fr/odorat-info/) October 16th. Contrary to the other indicators, the indicator
and independently by following the search requests of French based on death count shows a plateau -instead of a peak - with a
residents compiled by Google trends loss of taste (perte gout); loss maximal incidence the October 28th.
of smell (perte odorat) https://trends.google.com/). Besides the indicator based on death, most of the indicators
For each indicator, we computed the delay between the day of suggest that the viral circulation reaches a stable low level 2 weeks
the highest value (date of the peak) and the maximum level of after the beginning of the lockdown. An increase is observable on
SARS-CoV-2 circulation in France (17th March1,5–7). The longest the governmental indicators between the 25th December and 1st
delay was 19 days for the indicator based on death caused by January 2021 in France, which coincides with the Christmas and
COVID-19. The shortest delay concerned chemosensory changes: holiday season and the release of the lockdown in December. It is
4 days for the first report of change in the sense of smell by survey notable that all indicators converge to a maximal SARS-CoV-2
participants, 6 days for the peak of online queries for smell and viral circulation during the state of emergency. Therefore, the
taste loss. The delay between the peak of viral circulation and the decrease started before the lockdown (October 31st). An analysis
peak of COVID-19 diagnosis in the ER was 11 days and 14 days of the slope of the composite indicator shows that the increase
for admission to the CCRU. For governmental indicators, their and decrease in viral circulation were less than during the first
granularity (availability at a local level) allows computing the peak in the spring. Notably, the slope became negative after 21
delays for each statistic over all French departments, and based on October, suggesting that in France, the level of virus circulation
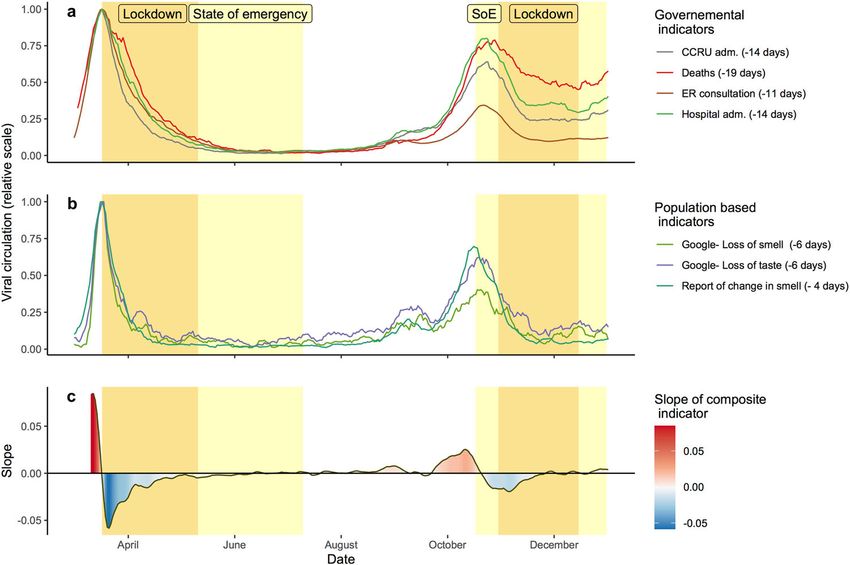
COMMUNICATIONS MEDICINE | (2021)1:7 | https://doi.org/10.1038/s43856-021-00002-6 | www.nature.com/commsmed 3ARTICLE COMMUNICATIONS MEDICINE | https://doi.org/10.1038/s43856-021-00002-6 Fig. 2 Impact of the overnight curfew. French departments were assigned a red (n = 16), blue (n = 37), or green (n = 43) label reflecting the date of implementation of overnight curfew enforcement. a Geographic positions of the departments. b Date of the maximum value (peak) of seven epidemic indicators used to monitor SARS-CoV-2 circulation (unphased) in the departments according to the date of overnight curfew implementation. Hospital admission post ER represents the number of admissions to the hospital after ER consultation. Box plots follow standard Tukey representations. The lower and upper hinges correspond to the 1st and 3rd quartiles. The upper whisker extends from the hinge to the largest value no further than 1.5 * IQR from the hinge (where IQR is the inter-quartile range between the 1st and 3rd quartiles). The lower whisker extends from the hinge to the smallest value at most 1.5 * IQR of the hinge. Data beyond the end of the whiskers (outlying points) are plotted individually. positive PCRs positive Polymerase Chain Reaction, ER emergency room, adm admission, CCRU adm critical care resuscitation unit admission. Map: © OpenStreetMap contributors, open database license www. openstreetmap.org/copyright. begins to decrease during the public health state of emergency was applied homogeneously across the location (Supplementary before the autumnal lockdown. Figure 3). It is important to note that temporally the state of emergency was not implemented homogeneously across all French terri- tories. An overnight curfew was enforced at the start of the state Discussion of emergency (October 17th) in eight zones (including the entire Overall, these results suggest that in France, the 2020 autumnal Paris region). Later on, a curfew was implemented on October state of emergency and curfews were the initial triggers of the 24th in 38 other zones (Fig. 2). For governmental data, it is decrease of the viral circulation (Supplementary Data 1). How- possible to estimate at the local scale the level of SARS-CoV-2 ever, state of emergency measures was not sufficient to maintain circulation in France in 2020 (Supplementary Figure 2). We suppression once the subsequent lockdown was released for the computed the dates with the highest value (peak) for six epidemic holiday’s season, suggesting the need for additional measures to indicators available at the local level (96 departments). All the limit the viral circulation. indicators suggest that viral circulation decreased earlier in each These results are in keeping with previous results which suggest location where curfew was implemented. All the indicators show that night bars, full-service restaurants, as well as music-related significant differences between locations with an overnight curfew events and gymnasiums play an important role in viral implemented at the beginning of the state of emergency and circulation8,9. It is important to note that these results were locations without curfew before the lockdown (t test, p value
COMMUNICATIONS MEDICINE | https://doi.org/10.1038/s43856-021-00002-6                                                                ARTICLE

symptoms, or death) to infer SARS-CoV-2 circulation history; is               of the virus circulation. When we applied the same rationale as
not original, see, for example, He et al.12,13. But one specificity of         our main analysis, we found a delay of 22 days between the peak
our approach, computing the delay at a population level is only               of viral circulation level and the peak of CCRU occupancy level
possible due to the extraordinary events which have happened                  (Supplementary Figure 4). This analysis suggests that the state of
during spring 2020 in France: (1) the rapid spread of a new virus             emergency allowed to reach a plateau phase lower than in spring
and (2) the highly stringent lockdown drastically decreasing the              and a beginning of diminution of the hospital load, which con-
virus circulation and allowing to observe sharp peak and esti-                tinued during the lockdown period (Supplementary Figure 3).
mating such delay at a national scale level. This population-based            When case burden is high, even incremental changes in trans-
approach is particularly adapted to the comparison between two                mission can have significant effects on public health outcomes
periods of heavy SARS-CoV-2 circulation, separated by only a                  such as hospitalizations and deaths, and that while the state of
few months in the same population living in metropolitan France.              emergency may have triggered a decline in transmission, the later
With such a within-population comparison, the difference in                   lockdown might have been important to achieve the outcomes.
terms of delay should therefore be limited. Moreover, the esti-                  Our results show that an extended state of emergency could
mation of the delay is consistent with the chronology of the                  slow virus dissemination but it is logically less effective than a
pathological symptomatology4,5,14–17. All indicators may not be               highly stringent lockdown (as implemented in March), which
addressed in literature but there are time estimates of the first              could reduce more dramatically the transmission rates down after
symptoms of the illness onset to dyspnea, ICU admission, and                  reopening safely the country but at a high societal cost. The
death or discharge. The first symptoms, such as fever, appear on               implementation of a lockdown requires important efforts on the
average 1 day after infection4. Taste and smell appear around                 part of inhabitants, even compared to a public health state of
3 days after the first symptoms5. The delay from illness onset time            emergency associated with a curfew (the differences are detailed
to ARDS (acute respiratory distress syndrome) is 12 days, which               in Supplementary Data 1). One of the characteristics of the
might correspond to our estimation of the time of hospitalization.            lockdown is the stay-at-home order forbidding non-essential
Depending on the study ICU admission range from 12 to 15 days.                movement outside individual homes. Except for essential activ-
And finally, the time from illness onset to death ranges from 17 to            ities (work, shopping for necessities, medical exams, etc.), inha-
21 days depending on countries and studies4,17. Therefore, we                 bitants were limited to one outing per day for a maximum of one
observed consistency between these clinical observations and our              hour, within a radius of 1 km. A travel waiver certificate was
own estimations based on population statistics.                               mandatory in order to leave home which enabled police enfor-
   However, we acknowledge that differences between the                       cement. Social activity such as collective sports or visits to friends
spring lockdown and the autumnal lockdown in terms of                         and family were forbidden. On 31 October, stores such as
medical treatment, medical policy, and the availability of                    bookstores, clothing stores, and full-service restaurants were
adapted materials in hospitals might have affected the temporal               closed and this had important socio-economic consequences. The
dynamics of some of the indicators that were analyzed. For                    economical and psychological long-term effects of the lockdown
example, we hypothesize that medical progress and the avail-                  compared with curfew are yet to be known. Therefore, further
ability of new equipment, which have increased patient survival,              studies are necessary to compare the efficiency/utility of short
could explain the plateau observed for the death-based indi-                  lockdowns vs longer state of emergency on the global population
cator. However, all the indicators suggest a decrease in viral                health, i.e., not only the virus circulation.
circulation before the lockdown. It is unlikely that medical                     Although we show that the level of virus circulation decreased
progress has the same effect on all the indicators. Like health               during the period of emergency of state and curfew. It is
system indicators, present population-based indicators present                important to point out that we do not know the key factors of this
also limitations. For example, the crowd-sourced survey might                 decrease and that the same measure might not have the same
be impacted by a sampling bias and recall bias due to media                   impact on a population depending on the timing. For example,
coverage (see ref. 5 for discussion). For example, a participation            one could suggest that school holidays in October have impacted
bias toward urban regions with early curfew might explain the                 the decrease of the circulation level, but it is unlikely to be the
early maximum. Nevertheless, considering all phased indicators                main factor of decrease since holidays were homogeneously
and the raw data (without phasing), the indicators based on                   implemented in France at the difference of curfew. Also, prior
viral nucleic-acid detection (positive ratio and raw number)                  experience with the pandemic and better preparedness may also
confirm a decrease in viral circulation in France before the                   have resulted in more appropriate changes in individual’s beha-
autumnal lockdown.                                                            vior when cases were rising again. Therefore, it may be possible
   However, the decrease of the level of circulation of SARS-                 that less harsh restrictions are more effective in reducing trans-
COV2 during the autumnal state of emergency is slower com-                    mission than they would have been early in the epidemic. One
pared with the one observed in spring. Although the overall trend             other explanation might be that the implementation of a state of
shows the positive impact of measures such as curfew the rate of              emergency and curfews could also have indirect impacts on
change of these measures is also important. By being more                     people’s behavior in the virus circulation. The population may
restrictive, the lockdown will more efficiently stop the virus                 tend to relax health rules during long periods of a pandemic so
propagation and therefore might enable a more rapid decrease in               the implementation of a state of emergency could be an efficient
cases and deaths.                                                             reminder that the virus is still circulating. Also, people who have
   The aim of the implementation of the lockdown in France                    already experienced the prior spring lethal pandemic period,
being to reduce the pressure of overloading hospitals, one can ask            could retake the safe sanitary practices and implement appro-
whether the speed of reduction of viral circulation in France was             priate behavior when recalling that covid-19 cases are rising
fast enough during the state of emergency to reduce such pres-                again. Inversely, the removal of lockdown limitations just before
sure. The pressure can be measured by the number of patients in               the period of family and friend celebration (Christmas and new
CCRUs. At its maximum, 9640 were occupied beds in France at                   year) might be an indirect signal of relaxation to the population
the autumnal peak while it was 40% higher in spring (13,885).                 despite the official continuation of the state of emergency.
This number depends on the admission rate but also on the time                Therefore, following people’s adherence to covid-safe practices
of the outcome (amelioration of the patient state or death), which            (through surveys for example) before or in parallel to imple-
can vary. It is a reliable indicator of the hospital overload but not         menting harsher measures should be useful.

COMMUNICATIONS MEDICINE | (2021)1:7 | https://doi.org/10.1038/s43856-021-00002-6 | www.nature.com/commsmed                                        5
ARTICLE                                                                                 COMMUNICATIONS MEDICINE | https://doi.org/10.1038/s43856-021-00002-6

   In conclusion, although the effect of a strict lockdown on viral                              6.    Hoertel, N. et al. A stochastic agent-based model of the SARS-CoV-2 epidemic
circulation was demonstrated in spring in France, it was not the                                       in France. Nat. Med. 26, 1417–1421 (2020).
major factor that initiated the decrease in viral circulation in                                 7.    Cauchemez, S., Kiem, C. T., Paireau, J., Rolland, P. & Fontanet, A. Lockdown
                                                                                                       impact on COVID-19 epidemics in regions across metropolitan France.
autumn 2020. The decrease was initiated during the public health                                       Lancet 396, 1068–1069 (2020).
state of emergency associated with the curfew. From a public                                     8.    Chang, S. et al. Mobility network models of COVID-19 explain inequities and
health standpoint, it might be important to limit the cost of                                          inform reopening. Nature 589, 82–87 (2020).
measures to control viral circulation as much as possible. Indeed,                               9.    Furuse, Y. et al. Clusters of coronavirus disease in communities, Japan,
these measures have a direct (less exercise, postponement of                                           January–April 2020. Emerg. Infect. Dis. 26, 2176–2179 (2020).
                                                                                                 10.   Di Domenico, L., Pullano, G., Sabbatini, C. E., Boëlle, P.-Y. & Colizza, V.
medical treatment, mental health) and indirect (degradation of                                         Impact of lockdown on COVID-19 epidemic in Île-de-France and possible
economic status) effect on individual health.                                                          exit strategies. BMC Med. 18, 240 (2020).
   In contrast, an increase in virus circulation is observable at the                            11.   Roques, L., Klein, E. K., Papaïx, J., Sar, A. & Soubeyrand, S. Impact of
release of the lockdown for Christmas and holiday’s season,                                            lockdown on the epidemic dynamics of COVID-19 in France. Front. Med. 7,
suggesting that the efficiency of specific measures is dependent on                                      274 (2020).
                                                                                                 12.   He, X. et al. Temporal dynamics in viral shedding and transmissibility of
the country’s dynamics (seasons, new variants etc.). Therefore,                                        COVID-19. Nat. Med. 26, 672–675 (2020).
desirable public health outcomes might be obtained by balancing                                  13.   Wood, S. N. Did COVID-19 infections decline before UK lockdown?
measures with different levels of restrictiveness.                                                     arXiv:2005.02090 [q-bio, stat] (2020).
   At the time of writing this manuscript (27 April 2021), after                                 14.   Souris, M. & Gonzalez, J.-P. COVID-19: spatial analysis of hospital case-
several months of the state of emergency and curfew, we observed                                       fatality rate in France. PLoS ONE 15, e0243606 (2020).
                                                                                                 15.   Faes, C. et al. Time between symptom onset, hospitalisation and recovery or
a new rise of COVID-19 cases, leading to a heavy load on CCRU                                          death: statistical analysis of Belgian COVID-19 patients. IJERPH 17, 7560
in France. In consequence, a lockdown was enforced on 20th                                             (2020).
March 2021 for 16 departments including major cities: i.e., Paris                                16.   Linton, N. et al. Incubation period and other epidemiological characteristics of
and Nice. On the 3rd April, a lockdown was enforced on all other                                       2019 novel coronavirus infections with right truncation: a statistical analysis of
departments. Despite these measures as well as an increased                                            publicly available case. Data. JCM 9, 538 (2020).
                                                                                                 17.   Byrne, A. W. et al. Inferred duration of infectious period of SARS-CoV-2:
vaccination rate (21% of the French population is now vaccinated                                       rapid scoping review and analysis of available evidence for asymptomatic and
with a first dose, 60% of individuals over 65 years old), the load in                                   symptomatic COVID-19 cases. BMJ Open 10, e039856 (2020).
CCRU does not decrease strongly as observed during the previous
lockdowns. This suggests that the effect of public health measures
                                                                                                 Acknowledgements
varies in time and depends on numerous factors.                                                  This work was financed by EXTREM-O/Confinez 2.0 (CNRS, CNES) and the COR-
                                                                                                 ODORAT grant (IDEX-Lyon—Université de Lyon). We are grateful to the anonymous
Data availability                                                                                reviewers for their comments that helped us to improve this communication.
Online queries were downloaded from Google Trends (https://trends.google.com/), using
the R library gtrendsR. We searched separately for the popularity of the terms: loss of
                                                                                                 Author contributions
smell (perte odorat) and loss of taste (perte gout), using default selection of All categories
                                                                                                 Study conception and design: D.P.; writing the paper: D.P., V.P.L., and M.B.; data
and Web search, within the timeframe of 1 March 2020 to 10 January 2021. Data of the
                                                                                                 acquisition and curation: D.P., V.P.L., M.B., C.F., C.B., A.M.P., and analysis: D.P., V.P.L.,
online survey conducted in French population between 8 April and 10 January 2021 are
                                                                                                 T.L., M.B., and C.B. writing, edition, and approval of the final manuscript: V.P.L., A.M.P.,
available in the supplementary Data 2 (sheet: survey_QUALITYofLIFE). The
                                                                                                 L.T., M.C.S., C.B., C.F., T.L., M.B., D.P.
Governmental indicators regarding the healthcare system in France (ER consultation,
hospitalizations, CCRU admission and deaths, PCR) were downloaded on 25 February
2021 and are available on https://www.data.gouv.fr/fr/pages/donnees-coronavirus and              Competing interests
https://geodes.santepubliquefrance.fr. The authors confirm that all relevant data are             The authors declare no competing interests.
included in the article in Supplementary Data 2.
                                                                                                 Additional information
Code availability                                                                                Supplementary information The online version contains supplementary material
Code for data cleaning and analysis associated with this manuscript is available at:             available at https://doi.org/10.1038/s43856-021-00002-6.
https://github.com/DenisPierron/COVID-19/blob/main/codeCOM.zip.
                                                                                                 Correspondence and requests for materials should be addressed to D.P.
Received: 17 December 2020; Accepted: 29 April 2021;                                             Reprints and permission information is available at http://www.nature.com/reprints

                                                                                                 Publisher’s note Springer Nature remains neutral with regard to jurisdictional claims in
                                                                                                 published maps and institutional affiliations.

References                                                                                                         Open Access This article is licensed under a Creative Commons
1.   Salje, H. et al. Estimating the burden of SARS-CoV-2 in France. Science 369,                                  Attribution 4.0 International License, which permits use, sharing,
     208–211 (2020).                                                                             adaptation, distribution and reproduction in any medium or format, as long as you give
2.   Hamadani, J. D. et al. Immediate impact of stay-at-home orders to control                   appropriate credit to the original author(s) and the source, provide a link to the Creative
     COVID-19 transmission on socioeconomic conditions, food insecurity,                         Commons license, and indicate if changes were made. The images or other third party
     mental health, and intimate partner violence in Bangladeshi women and their                 material in this article are included in the article’s Creative Commons license, unless
     families: an interrupted time series. Lancet Glob. Health 8, e1380–e1389                    indicated otherwise in a credit line to the material. If material is not included in the
     (2020).
                                                                                                 article’s Creative Commons license and your intended use is not permitted by statutory
3.   Mandel, A. & Veetil, V. The economic cost of COVID lockdowns: an out-of-
                                                                                                 regulation or exceeds the permitted use, you will need to obtain permission directly from
     equilibrium. Analysis. EconDisCliCha 4, 431–451 (2020).
                                                                                                 the copyright holder. To view a copy of this license, visit http://creativecommons.org/
4.   Zhou, F. et al. Clinical course and risk factors for mortality of adult inpatients
                                                                                                 licenses/by/4.0/.
     with COVID-19 in Wuhan, China: a retrospective cohort study. Lancet 395,
     1054–1062 (2020).
5.   Pierron, D. et al. Smell and taste changes are early indicators of the COVID-19             © The Author(s) 2021
     pandemic and political decision effectiveness. Nat. Commun. 11, 5152 (2020).

6                                COMMUNICATIONS MEDICINE | (2021)1:7 | https://doi.org/10.1038/s43856-021-00002-6 | www.nature.com/commsmed
You can also read