Understanding the thermodynamic properties of insect swarms
←
→
Page content transcription
If your browser does not render page correctly, please read the page content below
www.nature.com/scientificreports
OPEN Understanding the thermodynamic
properties of insect swarms
Andy M. Reynolds
Sinhuber et al. (Sci Rep 11:3773, 2021) formulated an equation of state for laboratory swarms of
the non-biting midge Chironomus riparius that holds true when the swarms are driven through
thermodynamic cycles by the application external perturbations. The findings are significant because
they demonstrate the surprising efficacy of classical equilibrium thermodynamics for quantitatively
characterizing and predicting collective behaviour in biology. Nonetheless, the equation of
state obtained by Sinhuber et al. (2021) is anomalous, lacking a physical analogue, making its’
interpretation problematic. Moreover, the dynamical processes underlying the thermodynamic
cycling were not identified. Here I show that insect swarms are equally well represented as van der
Waals gases and I attribute the possibility of thermodynamic cycling to insect swarms consisting of
several overlapping sublayers. This brings about a profound change in the understanding of laboratory
swarms which until now have been regarded as consisting of non-interacting individuals and lacking
any internal structure. I show how the effective interactions can be attributed to the swarms’
internal structure, the external perturbations and to the presence of intrinsic noise. I thereby show
that intrinsic noise which is known to be crucial for the emergence of the macroscopic mechanical
properties of insect swarms is also crucial for the emergence of their thermodynamic properties as
encapsulated by their equation of state.
Collective behaviour in flocks, herds, crowds and swarms occurs throughout the biological world. Calling groups
‘collective’ suggests that the group is somehow more than, or at least different from, the sum of its individuals1.
That is, care must be exercised to distinguish between emergent properties of the group that have no meaning at
the individual level and aggregate properties that are simple averages over the participants. This is the approach
taken in material science and in thermodynamics where response functions like viscosity or elastic moduli and
state variables such as pressure and temperature can be defined and related to bulk materials without direct
appeal to a molecular description. Ouellette2,3 championed applying such ideas to collective behaviour in biol-
ogy. Previous studies have demonstrated that collective groups can have emergent material-like p roperties4–7 but
Sinhuber et al.8 were the first to demonstrate empirically that collective groups can be described thermodynami-
cally in terms of conventional state variables and their natural analogues. The most fundamental relationship for
achieving this is the equation of state, which links the state variables that describe the macroscopic properties of
the system and encodes how they co-vary in response to environmental changes. Sinhuber et al.8 formulated the
first such equation of state. They formulated an equation of state for laboratory swarms of the non-biting midge
Chironomus riparius and showed that this equation of state holds true when the swarms are driven through ther-
modynamic cycles in pressure–volume space via the application of a suitable sequence of external perturbations.
These findings of Sinhuber et al.8 demonstrate the efficacy of classical equilibrium thermodynamics for
quantitatively characterizing and predicting collective behaviour in biology. This efficacy is surprising given the
absence of conservation laws or well-described physical interactions and given the cognitive processing or agency
of individuals. The significance of this breakthrough was not lost on Sinhuber et al.8 who noted rightly that such
an “equation of state […] gives a new way both of illuminating the purpose of collective behaviour, given that it
encodes the nature of the collective state, and quantitatively distinguishing different kinds of animal groups that
may have similar movement patterns but different functions”.
Nonetheless, the equation of state obtained by Sinhuber et al.8 is anomalous, lacking a physical analogue, mak-
ing its’ interpretation problematic. Moreover, the dynamical processes underlying the thermodynamic cycling
were not identified. Here I address these problems, providing explanatory mechanisms for both the equation
of state and the thermodynamic cycling. I show that the standard equation of state for van der Waals gases is as
effective as Sinhuber et al.’s8 equation of state at encoding the thermodynamic properties of insect swarms. I also
show that the thermodynamic cycling can be attributed to swarms being stratified: consisting of overlapping
horizontal layers. Effective interactions and internal structure have until now escaped notice9,10. Finally, I suggest
that because of their affinity with van der Waals gases, insect swarms can undergo liquid–gas phase transitions.
Rothamsted Research, Harpenden, Hertfordshire AL5 2JQ, UK. email: andy.reynolds@rothamsted.ac.uk
Scientific Reports | (2021) 11:14979 | https://doi.org/10.1038/s41598-021-94582-x 1
Vol.:(0123456789)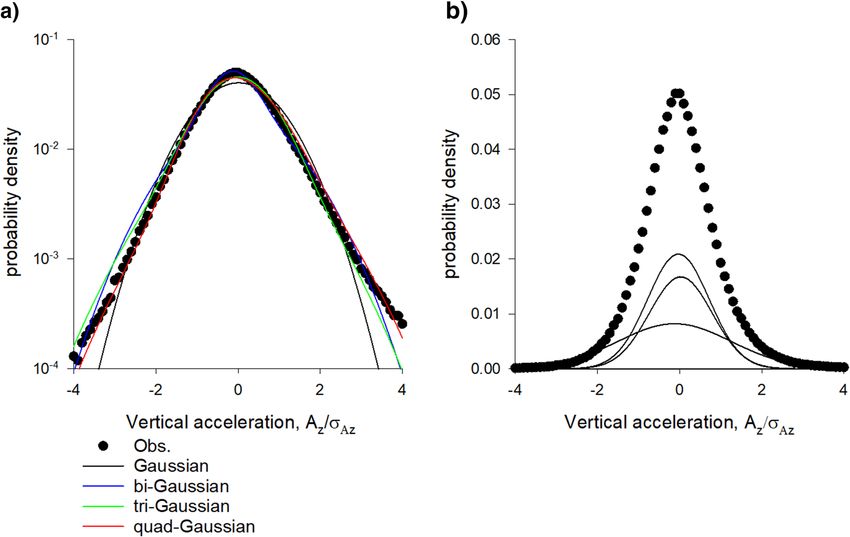
www.nature.com/scientificreports/
Main contributions.
• Provide the first evidence that swarms are stratified.
• Demonstrate that stratification together with the presence of intrinsic noise accounts for the thermodynamic
properties of swarms as observed in the laboratory.
• Demonstrate similitude with van der Waals gas-like behaviour.
• Link results to acoustic interactions which are known to occur in insect swarms.
In supplementary material.
• Provide strong evidence that individuals are on average very weakly coupled inside swarms. This is a precur-
sor for understanding the thermodynamic properties of swarms.
• Posit mechanisms for stratification.
• Demonstrate that swarms are critically damped and auxetic.
Results
No evidence for long‑range interactions in laboratory insect swarms. Puckett et al.10 reported
that acceleration measurements of laboratory swarms of the midge Chironomus riparius show a clear short-
range repulsion but no conclusive evidence of long-range interactions between individuals and their nearest
neighbours. In the Supplementary Material I I go beyond the pairwise analysis of Puckett et al.10 to examine
the statistical properties of tetrahedra with vertices located at the positions of individuals and their 3 nearest
neighbours. Tetrahedra are minimum characterizations of the spatial arrangement of individuals in 3 dimen-
sions (since 3 individuals will always lie in a plane). I show that the statistical properties of the tetrahedra mirror
expectations for Gaussian, independent individual positions, thereby bolstering the analysis of Puckett et al.10.
Confirming the absence of long-range interactions in laboratory swarms is crucial for appropriately interpret-
ing equations of state, which as shown later, are indicative of van der Waals gas-like behaviour. The apparent
discrepancy is resolved after noting that perturbations (i.e., thermodynamic cycling) can induce c orrelations11
and herein) and after noting that equations of state are not swarm models per se, in that they do not make any
detailed predictions about the dynamics of individuals. Rather, they give us a quantitative way of analysing and
interpreting swarm data at the macroscale.
‘Slab confinement’. Observations. In this section I present evidence for laboratory swarms of the midge
Chironomus riparius having internal structure. Evidence comes from 3 independent analyses that yield consist-
ent results. In the first analysis I show that the vertical density profiles are accurately represented by superposi-
tions of Gaussian density profiles, hereafter called ‘slabs’, and I show that the number of slabs in the fitted profiles
increases with the average population size. This is, of course, not conclusive because any density profile can be
represented by superpositions of Gaussian density profiles. Nonetheless, the decomposition into Gaussian den-
sity profiles is justifiable and physically plausible for insect swarms because they are a consequence of the gravi-
tational-like restorative forces that are known to operate within insect swarms9,12,13. Moreover, the increase in the
number of slabs with increasing population average population is indicative of a systematic change in the overall
of shape (i.e., internal structure) of the swarm rather than with an increase in the overall size of the swarm. In the
second analysis I show that mean acceleration profiles (i.e., mean restorative forces) are consistent with several
centres of attraction each of which is expected to result in a local Gaussian density profile. In the third analysis I
show that acceleration statistics can be accurately represented by superpositions of Gaussians. Further evidence
for the swarms having internal structure comes from an unpublished study [van der Vaart, Private Communica-
tions documented herein] and from supporting analysis that is presented in the Supplementary Material II. Later
it is shown that the identification of internal structure like the absence of correlations (documented above and in
Supplementary Material I) is a crucial precursor for correctly interpreting equations of state and for understand-
ing how the swarms can be driven through thermodynamic cycles by applying a suitable sequence of external
perturbations. I show that observations cannot be replicated by simulations of swarms lacking internal structure.
The analysis draws inspiration from the observations of van der Vaart [Private Communication] who reported
that smaller laboratory swarms are stratified: “They contain around 3 horizontal layers, with the lowest layer
being flatter than the others. For larger laboratory swarms, individuals tend to explore a sub-part of the swarm,
but the vertical centres of individual trajectories are distributed more homogeneously”. This internal structure
was determined by visual expectation of the spatial extent of long trajectories which because of tracking errors
are rarely recorded. Here in the first of 3 analyses slab confinement is determined objectively and directly from
density profiles computed from all recorded trajectories, using a standard, robust statistical method.
Multi-Gaussian density profiles,
N exp − (z−z
2σi2
i)
(1)
p(z) = wi √
i=1
2πσi
with W i=1 wi = 1 where fitted to observed vertical density profiles using maximum likelihood estimation meth-
ods and the best model profile was determined using the Akaike criterion. The Akaike weights, which range
between 0 and 1, are the weights of evidence in favour of the Nth-order multi-Gaussian being the best representa-
tion for the given data, out of the multi-Gaussians distributed considered. Here N = 1, 2, 3 and 4 are considered.
All 17 dusk time swarms in the dataset of Sinhuber et al.14 provide strong support for the presence of slabs. The
Scientific Reports | (2021) 11:14979 | https://doi.org/10.1038/s41598-021-94582-x 2
Vol:.(1234567890)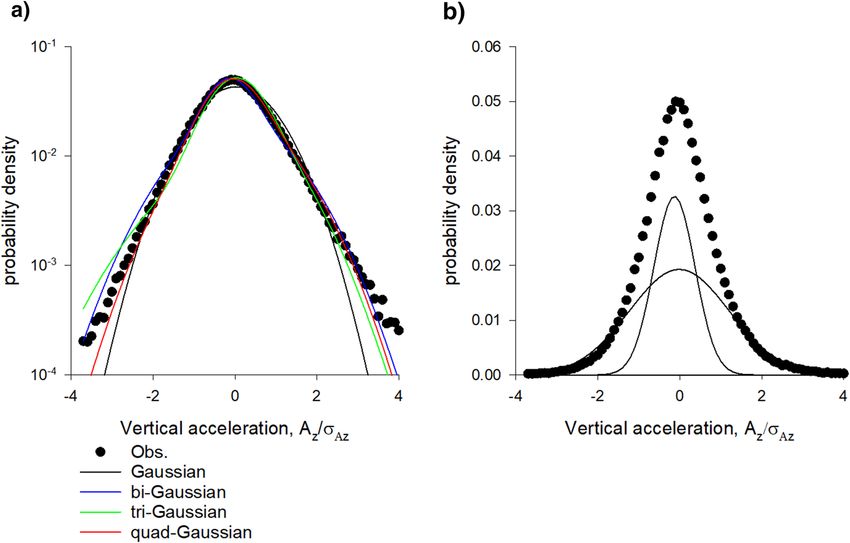
www.nature.com/scientificreports/
Figure 1. (a) Vertical density profiles of laboratory swarms are accurately represented by superpositions of
Gaussians. (b) Constituent Gaussians in the quad-Gaussian representation with centres at •. In accordance with
observations, the best superposition “contains around 3 horizontal layers, with the lowest layer being flattered
than the others” [van der Vaart, Private Communication]. The Akaike weights for the single-, bi-, tri- and quad-
Gaussian fits are 0.00, 0.00, 0.08 and 0.92 indicating strong support for the quad-Gaussian representation (albeit
with one weak ‘embryonic’ slab). Data are taken from Sinhuber et al.14: swarm Ob1 which contains on average
94 individuals. The swarm is centred on z = 0.
best fit distributions mirror the observations of van der Vaart (Figs. 1, 2). Comparable fits are obtained for the
1st and 2nd halves of the recordings, indicating that the slab structure does not change significantly over time.
Density profiles in the horizontal directions, on the hand other, are closely Gaussian.
The number of slabs tends to increase with increasing average population size (Fig. 3, also compare Figs. 1,
2). This remains the case when the swarms are sub-sampled so that the number of positional fixes in the analyses
remains constant irrespective of the average population size. The increase in the number of slabs with increas-
ing average population cannot therefore be attributed to it becoming statistically more favourable to include
more components but can instead to attributed to a systematic change in the overall shape of the swarm with
increasing average population, as swarm growth proceeds slab by slab (this is not true generally of arbitrarily
defined density profiles, Supplementary Material III). This suggests in accordance with observations that very
large swarms will be cylindrical15.
Stochastic models for the simulation of individual swarming insects are in close agreement with all available
data7,11,16–18. Such modelling indicates that individuals occasionally move between slabs, i.e., that the slabs are
coupled rather than decoupled. The modelling approach predicts that mean vertical accelerations of individual
insects are given by
(z−zi )
σw2 (z − zi ) exp − 2σi2
N
Az |z = − wi √ (2)
P(z)
i=1
σi2 2π σi
when the slabs are coupled and by
N
(z − zi )
Az |z = −σw2 wi (3)
i=1
σi2
when the slabs are decoupled, where σw2 is the velocity variance. The former unlike the latter provides a good
fit to data (Fig. 4). Nonetheless, nonmonotonicity of the mean accelerations predicted by this simple coupling
does not have experimental support. Better agreement with experiment may be obtained with a weaker form of
coupling that lies between Eq. (2) and the monotonic form given by Eq. (3).
This goodness of fit provides further evidence for slab confinement; slab confinement accounts for the depar-
tures from a linear force law (harmonic potential) that operates in the vertical direction but not in the horizontal
directions. This suggests that the mean acceleration (effective restorative force) depends on the probability
Scientific Reports | (2021) 11:14979 | https://doi.org/10.1038/s41598-021-94582-x 3
Vol.:(0123456789)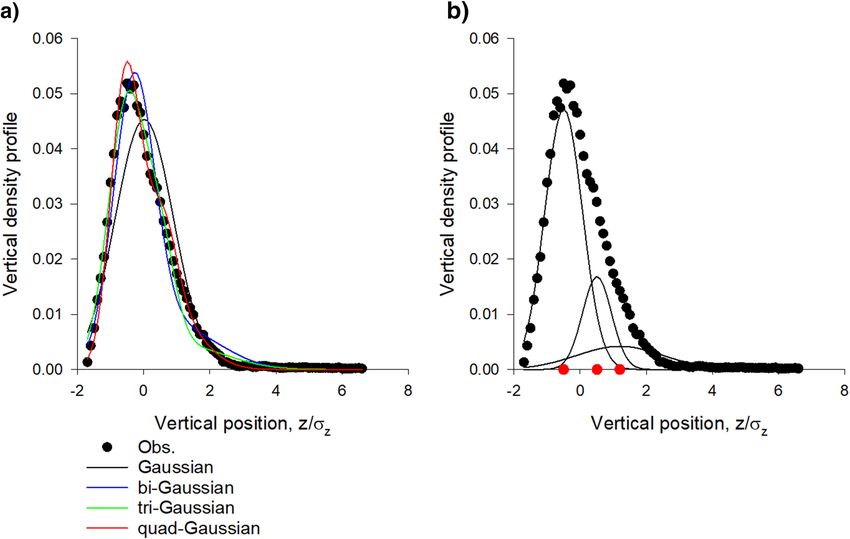
www.nature.com/scientificreports/
Figure 2. (a). Vertical density profiles of laboratory swarms are accurately represented by superpositions of
Gaussians. (b) Constituent Gaussians in the tri-Gaussian representation with centres at •. In accordance with
observations, the best superpositions “contains around 3 horizontal layers, with the lowest layer being flattered
than the others” [van der Vaart, Private Communication]. The Akaike weights for the single-, bi-, tri- and quad-
Gaussian fits are 0.00, 0.78, 0.21 and 0.01 indicating strong support for the bi and tri-Gaussian representations.
Data are taken from Sinhuber et al.14: swarm Ob5 which contains on average 22 individuals. The swarm is
centred on z = 0.
Figure 3. Average number of Gaussian slabs N = 4N=1 wN N tends to increase with increasing average
population size, n. w
N are the Akaike weights for best-fit profile containing N slabs. The least-squares linear
regression (solid line) is added to guide the eye ( R2 = 0.50). Data are taken from Sinhuber et al.14. All 17 daytime
swarms.
densities. In the outskirts of swarms, where densities are low, effective restorative forces are purely harmonic
(gravitational-like, Okubo13 Fig. 4). In the cores of swarms with overlapping sublayers, where densities are high,
the effective forces are reduced relative to expectations for slab-less swarms (Fig. 4). This is closely akin to so-
called ‘adaptive gravity’ models of insect s warms12. In these models, the strength of the interactions between
individuals is density dependent. This dependency is crucial for bringing adaptive gravity models into agreement
Scientific Reports | (2021) 11:14979 | https://doi.org/10.1038/s41598-021-94582-x 4
Vol:.(1234567890)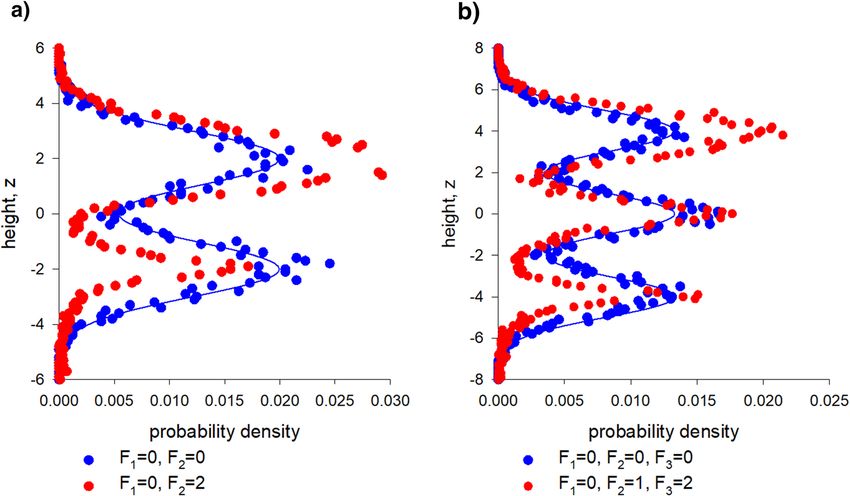
www.nature.com/scientificreports/
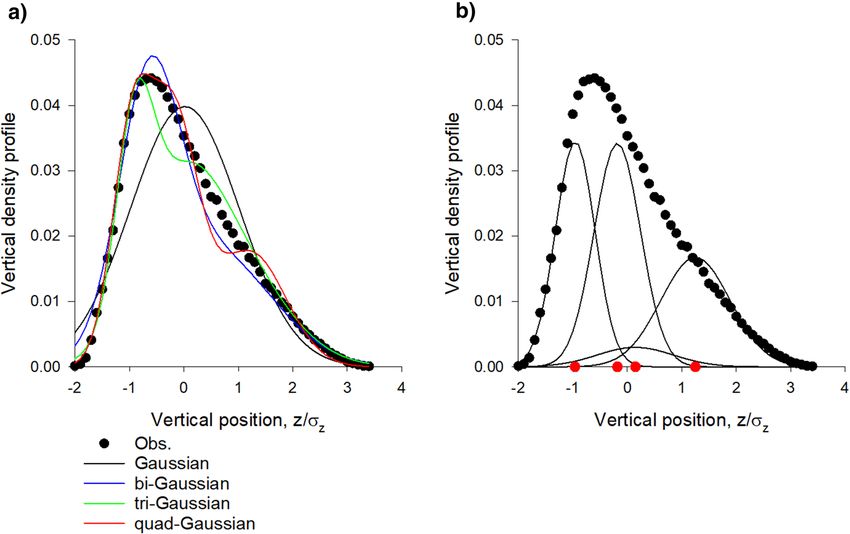
Figure 4. Mean accelerations are consistent with slabs being coupled. Data (•) are shown (a) for swarm (Ob1)
which contain on average 94 individuals and (b) for a swarm (Ob5) which contains on average 22 individuals.
Shown for comparison are model predictions for coupled slabs, Eq. (2) (red lines) and for decoupled slabs,
Eq. (3) (blue lines). Data are taken from Sinhuber et al.14.
with observations of both the average forces within the swarms and an analogue of the virial theorem based on
mass conservation.
Distributions of acceleration, like density profiles, can be accurately represented by multi-Gaussians (Figs. 5,
6). The number of Gaussians typically matches the number the Gaussian representations of the density profiles,
i.e., the number of slabs and the number of flight modes are typically the same. By way of contrast, velocities are
closely Gaussian, as noted by Kelley and Ouellette9.
Emergent mechanical‑like properties of slabs can be attributed to intrinsic noise. The vertical size of the slabs
tends to increase with height. This is consistent with the observations of slab confinement made by van der Kaart
[Private Communication] and with observations of Kelley and Ouellette9 who reported that laboratory swarms
tend to have diffuse tops. From an emergent mechanical-properties perspective, the lower slabs are being com-
pressed by the slabs above them. Here I show that this emergent property, like the emergence of tensile strength
(Reynolds 2020), can be attributed to the presence of intrinsic noise. [Note that in the absence of sublayers,
intrinsic (multiplicative) noise causes isolated swarms to expand (Reynolds 2020)]. In the Supplementary Mate-
rial IV I show how slab formation can be attributed to intrinsic noise and I suggest that swarms are poised at
the cusps of phase transitions (i.e., are close to spontaneously creating new slabs which will change a swarm’s
internal structure).
A simple random walk model for the vertical movements, z, of individuals within a swarm which in the
absence of intrinsic noise consists of two Gaussian sublayers centred on z1 and on z2 with unit variance is given by
√
√
√
dz = U1 dt + F1 2dξ1 + U2 dt + F2 2dξ2 + F3 2dξ3
(z − z1 )2
U1 = −(z − z1 )exp − (4)
2
2
(z − z2 )
U2 = −(z − z2 )exp −
2
as evidenced by the results of numerical simulations shown in Fig. 7; where dξi (t) are independent incremental
Wiener process with correlation property dξi (t)dξj (t + τ ) = δ(τ )δij dt and where the constants Fi set the noise
intensities (For details of model formulation see Supplementary Material V17,19. Noise in the lower sublayer results
in compression and suppression (i.e., partial de-population) of that sublayer, as individuals migrate to the upper
sublayer which expands and becomes more prominent. This could create strong feedback, as de-population is
likely to be accommodated by increased intrinsic noise in the lower slab (fluctuations arise in part from the
limited number of individuals in the sublayers). Note that intrinsic noise in the lower slabs could be relatively
large because of the presence of the ground which disrupts individual trajectories. Note also that the presence
of small multiplicative noise can dramatically shorten escape times from the potential wells13.
Scientific Reports | (2021) 11:14979 | https://doi.org/10.1038/s41598-021-94582-x 5
Vol.:(0123456789)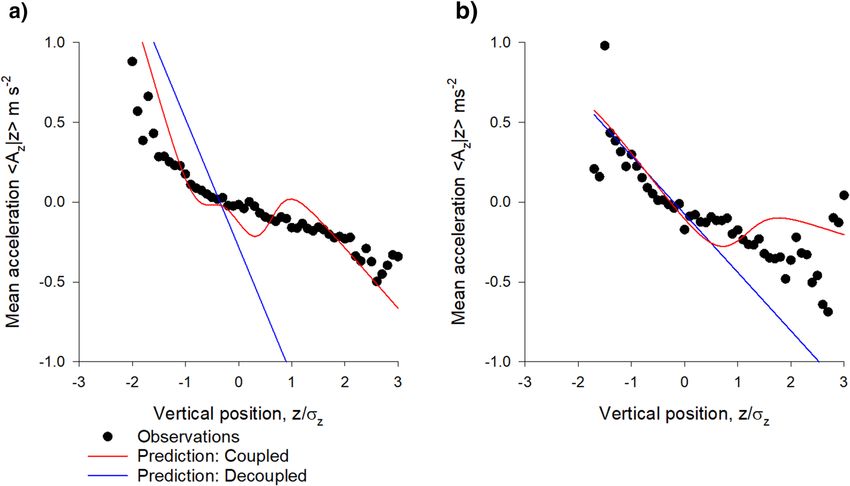
www.nature.com/scientificreports/

                                            Figure 5.  (a). Distributions of vertical accelerations are accurately represented by superpositions of Gaussians.
                                            (b) Constituent Gaussians in the tri-Gaussian representation with centres at •. The Akaike weights for the
                                            single-, bi-, tri- and quad-Gaussian fits are 0.00, 0.03, 0.89 and 0.09 indicating strong support for the tri-
                                            Gaussian representation. Data are taken from Sinhuber et al.14: swarm Ob1 which contains on average 94
                                            individuals.

                                            Figure 6.  (a). Distributions of vertical accelerations are accurately represented by superpositions of Gaussians.
                                            (b) Constituent Gaussians in the tri-Gaussian representation with centres at •. The Akaike weights for the
                                            single-, bi-, tri- and quad-Gaussian fits are 0.05, 0.79, 0.14 and 0.02 indicating strong support for the bi-Gaussian
                                            representation. Data are taken from Sinhuber et al.14: swarm Ob5 which contains on average 22 individuals.

          Scientific Reports |   (2021) 11:14979 |               https://doi.org/10.1038/s41598-021-94582-x                                                      6

Vol:.(1234567890)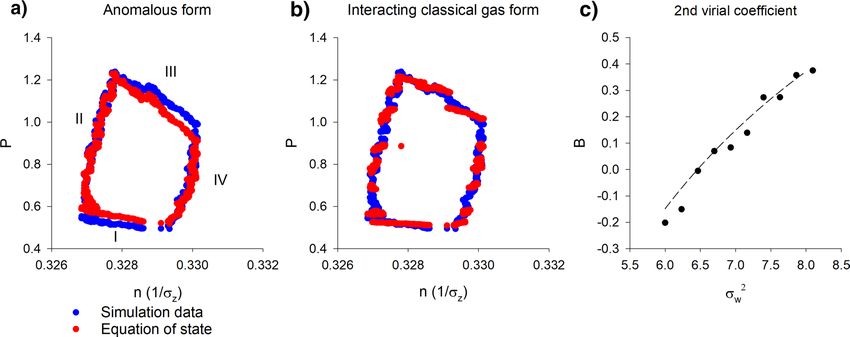
www.nature.com/scientificreports/

                                  Figure 7.  Intrinsic noise causes compression and de-population of lower sublayers. In the absence of intrinsic
                                  noise, distributions of simulated individuals (•) match theoretical expectations (solid line) for noiseless swarms.
                                  The presence of noise in the lower sub-layers reduces their size and causes partially de-populate. Predictions are
                                  shown for the stochastic model, Eq. (4) (a) and its generalization to 3 sublayers (b).

                                  Figure 8.  Swarms are predicted to compress in response to external dynamic perturbations. Predictions were
                                  obtained using the stochastic model, Eq. (4), for the bipartite swarm shown in Fig. 7a.

                                  Dynamic response to perturbations. A key open question for understanding the properties of collective sys-
                                  tems is how they respond to perturbations. Sinhuber et al.20 examined this with precisely controlled laboratory
                                  experiments. They considered the effect of a controlled variable light exposure on the swarming behaviours of
                                  the Chironomus riparius midge. They found that a swarm responds to these perturbations by compressing and
                                  simultaneously increasing the attraction of individual midges to its centre of mass. The compression can be
                                  understood using the above approach since parametric noise causes the slab structure to change (Fig. 7) thereby
                                  causing swarms to compress (Fig. 8). In this case the parametric noises, F1 and F2 have both intrinsic and exter-
                                  nal components. Compression of the swarm typically arises when the amplitude of the response to the external
                                  perturbation varies between slabs. This is reasonable given that slab formation was, here, linked to flight mode,
                                  i.e., to motor function (Figs. 5, 6). The reported increase in attraction appears to conflict with the model which
                                  predicts that the average restorative forces remain unchanged. Sinhuber et al.20 plotted the average restorative

Scientific Reports |   (2021) 11:14979 |               https://doi.org/10.1038/s41598-021-94582-x                                                   7

                                                                                                                                               Vol.:(0123456789)
www.nature.com/scientificreports/
forces as a function of (z − z)/σz rather than as a function of z. The model predicts that these plots will change
because both z and σz are noise dependent; giving the impression that the attractive force has increased.
Equations of state for insect swarms. Models. Sinhuber et al.8 demonstrated that insect swarms can
be described in a thermodynamic framework; as championed by O uellette2,3. Sinhuber et al.8 formulated an
equation of state that holds true when the swarms are driven through thermodynamic cycles by the applica-
tion visual and acoustic perturbations (light on, no noise; light on, noise; light off, noise, light off, noise off).
Here I show that a closely analogous equation of state characterizes simulated swarms and that it holds true
when through cycling through the strengths of noises (strong multiplicative noise, weak additive noise; strong
multiplicative noise, strong additive noise; weak multiplicative noise, strong additive noise; weak multiplicative
noise, weak additive noise). The predicted effects of the multiplicative noise are shown to resemble the observed
effects of the light on/off perturbation which move the state of the swarm along an i sotherm14 (see above) and the
predicted effects of the additive noise are shown to resemble the observed effects of the acoustic on/off perturba-
tion. The distinction arises because unlike additive noise, multiplicative noise can change the shape of a potential
well13, (Reynolds 2020) (Fig. 7).
Sinhuber et al.8 identified the state variables to be: the volume of the swarm,an analogue of temperature that is
proportional to the kinetic energy; pressure; and the number of individuals in the swarm. Here the state variables
are taken to be: the swarm size, σz (a proxy for volume); the velocity variance
σw (i.e., twice the kinetic energy,
2
a proxy for temperature); and, as with S inhuber8, pressure, P = σw2 + zA /σz where, z is the vertical position
relative to the swarm centre and A is the mean acceleration. The acceleration term is motivated by the fact that
insects in a swarm behave as if they are trapped in a harmonic potential well9,13, and captures the work by an
insect as it accelerates in the potential. Note that this global pressure is not representative of local pressures which
differ in the core and in the outskirts of the swarm1, Supplementary Material VI). The number of individuals is
not considered because it is constant in the simulated swarms. Following Sinhuber et al.8 an equation of state
was found by assuming the functional form
P = f (σz , σw ) = c1 σzc2 σwc3 (5)
and using non-linear regression where c1, c2 and c3 are constants. This procedure requires a stochastic model
for both the positions and velocities of individuals within a swarm, i.e., it requires that Eq. (4) be replaced by
√
√
√
dw = −wdt + U1 dt + F1 2dξ1 + U2 dt + F2 2dξ2 + 2dξ3
dz = wdt
(z − z1 )2
U1 = −(z − z1 )exp − (6)
2
(z − z2 )2
U2 = −(z − z2 )exp −
2
[For details of model formulation see Supplementary Material V17–19]. When the simulated swarm is driven
through a thermodynamic cycle (by cycling the additive and multiplicative noises), the equation of state,
Pσz1.6 = 0.003σw2.8 holds throughout (Fig. 9a). Sinhuber et al.8 reported that PV 1.7 ∝ NT 2. Observed and pre-
dicted collective behaviours are thus similar and surprisingly simple. Note, however, that the simulation data
(over the available ranges) for pressure is equally well represented by the first two terms in the virial-like expan-
σ2
sion, P ∝ σwz A + σ1z B σw2 + σ12 C σw2 . . . , for an interacting gas (Fig. 9b,c). The second-order virial coefficient
z
is well represented by B = a − σb2 (Fig. 9c) which corresponds to a van der Waals gas21. This does not indicate
w
that individuals are interacting—simulated individuals are not interacting –nonetheless they are behaving as if
they are interacting.
The apparent interactions can be attributed to the multiplicative noise, which is present, even in quiescent
swarms22. Consider for simplicity a swarm without slabs. Stochastic modelling predicts that the joint distribution
of positions and velocities is given by
− σw2 2Tc −1
w2
F 2σz F
(7)
P(z, w) = 1 + 2 z2 exp − 2 /Q
σw Tc 2σw
where F is the magnitude of the multiplicative noise, σz is the root-mean-square size of the swarm in the absence
of multiplicative noise, σw is the root-mean-square speed of the individuals, Tc is a velocity-autocorrelation
timescale and Q is a normalization factor, i.e., the canonical partition f unction22. In the absence of multiplicative
noise, positions and velocities are jointly Gaussian. In this case, the canonical partition function
1
1
ln 2πσw2 + ln 2πσz2 (8)
lnQ =
2 2
is directly analogous to that for a non-interacting gas,
1
lnQ = ln(2πkT) + ln(V )
2
Scientific Reports | (2021) 11:14979 | https://doi.org/10.1038/s41598-021-94582-x 8
Vol:.(1234567890)www.nature.com/scientificreports/
Figure 9. Simulated and predicted thermodynamic cycling. Simulation data were obtained using the simple
stochastic model, Eq. (4), for the bipartite swarm shown in Fig. 7a. Cycling the strengths of noises (strong
multiplicative noise, weak additive noise; strong multiplicative noise, strong additive noise; weak multiplicative
noise, strong additive noise; weak multiplicative noise, weak additive noise) drives the simulated swarm through
a ‘thermodynamic’ cycle that resembles o bservations8. (a) Predictions were obtained using the equation of state,
Eq. (5), with c1 = 0.001, c2 = 1.59, c3 = 2.69 and (b) with the virial-like expansion. (c) The second-order virial
coefficient was obtained from fits to the simulation data. The second-order virial coefficient is well represented
by B = a − σb2 (dashed-line) which corresponds to a van der Waals gas. Each phase has duration 0.25 (a.u.) and
w
F1 = 1 throughout. Phase I F 2 = 2, F3 = 1; Phase II F2 = 2, F3 = 2; Phase III F2 = 0, F3 = 2; Phase IV F2 = 0, F3 = 1.
But in the presence of multiplicative noise, the canonical partition function
1
1
F σz2
ln 2πσw2 + ln 2πσz2 − + O F2 (9)
lnQ = 2
2 2 4 σw
This is directly analogous to the canonical partition function for an interacting gas
1 1
lnQ = ln(2πkT) + ln(V ) − VB(T) (10)
2 2
where B(T) is second virial coefficient, if F = F0 /σz . The simple ansatz for F is reasonable because the magnitude
of the intrinsic noise is found to decrease as the size of the swarm increases22.
Intrinsic multiplicative noise may therefore account for both the mechanical properties of swarms—tensile
strength, yield strength—and their thermodynamic properties—equations of state.
Heuristic understanding of the effective correlations. In the absence of slabs, multiplicative noise causes swarms
to expand, as if the individuals are being repelled from one another, as indicated by B > 0. In the presence of slabs,
multiplicative noise causes swarms to contract (Figs. 7, 8), as if the individuals are being attracted to another, as
indicated by B < 0. This provides further evidence for the presence of slabs within insect swarms. Also note that
at high temperatures (above the Boyle temperature where B = 0), repulson dominates.
Observations. In accordance with Sinhuber et al.8 the largest laboratory swarm (Ob1) in the dataset of Sin-
huber et al.14 containing on average 94 individuals was found to be well characterised by an equation of state
PV1.7 = kNT2. As with the simulated swarms, it is equally well characterized by an equation of state for a non-
ideal gas (Fig. 10). For the smaller laboratory swarms, second virial coefficients increase with increasing kinetic
energy (temperature) and so resemble those for interacting gases, but they do not adhere closely to the van der
Waals form. It is therefore possible that the equation of state attains an asymptotic form pertaining to a van der
Waals gas when swarms contain order 10 individuals. This would be consistent with the observations of Puckett
and Ouellette23 who reported that once the swarms contain around 10 individuals, average volume occupied per
individual, average nearest-neighbour distance, along with other swarm statistics saturate.
Equipartition. In conventional statistical mechanics, the equipartition theorem states that a classical system in
thermal equilibrium at temperature T has a mean energy of kT/2 per degree of freedom where k is a constant.
Sinhuber et al.8 showed that equipartition holds for the laboratory swarms despite not being in thermal equilib-
rium and that the number of degrees of freedom is about 6: 3 translational and 3 potential which not surprising
given that potential well in which the insects reside is 3-dimensional9. It is readily shown that equipartition also
Scientific Reports | (2021) 11:14979 | https://doi.org/10.1038/s41598-021-94582-x 9
Vol.:(0123456789)www.nature.com/scientificreports/
Figure 10. Second virial coefficient for the largest laboratory swarm (•) mirrors theoretical expectations for a
swarm with slabs and corresponds to a van der Waals gas (dashed line). Data are taken from Sinhuber et al.14;
swarm Ob1 which contains on average 94 individuals.
holds for the stochastic swarm m odels17,19 (Reynolds et al. 2017). In one-dimensional versions of these models
for statistical stationary swarms, the mean acceleration (restorative force) is given by
1 ∂ u
F(u, x) = − ∫ vP(v, x)dv (11)
P(u, x) ∂x −∞
where P(u, x) is the joint distribution of position and velocity19, Reynolds 2017). The potential energy
1 ∞ ∞ ∂ u 1
Ep = xF = − ∫ ∫ x ∫ vP(v, x)dvdudx = σu2
2 −∞ −∞ ∂x −∞ 2
is therefore equal to the kinetic energy, Ek = 12 σu2. More elaborate analysis shows that this is also true of 2- and
3-dimensional stochastic models of quiescent swarms. This is a consequence of the virial state which for sta-
tionary systems dictates that 2Ek − 2Ep + S = 0 where S = 0 is the surface pressure. Nonetheless, the results of
numerical simulations show that in the presence of multiplicative noise, Ek > Ep; indicating that equipartition
is not satisfied exactly and that S < 0 in accordance with observations12. This was anticipated by Reynolds17,18,22
who attributed S < 0 (i.e., confining surface pressures) to erratic movements of the swarms’ centre of mass.
Discussion
The equation of state extracted by Sinhuber et al.8 quantifies the macroscopic properties of the swarms. Its’ non-
linear form shows that these macroscopic properties cannot be the result of individuals behaving like an ideal
gas. This is unexpected because other studies indicate that individuals although tightly bound to the swarm itself
are weakly coupled inside it10 and herein in Supplementary Material I]. Moreover, stochastic models of the tra-
jectories of non-interacting midges agree with numerous observations from carefully controlled, high precision,
laboratory experiments. They do, for example, account: for the observed emergence of macroscopic mechanical
properties similar to solids, including a finite Young’s modulus and yield s trength4,17,18; for the observed collective
viscoelastic response to applied oscillatory visual s timuli7; and for the fact that laboratory swarms of the non-
biting midge Chironomus riparius consist of a core ‘condensed’ phase surrounded by a dilute ‘vapour’ p hase1,17.
Here such stochastic models were shown to account for the equation of state obtained by Sinhuber et al.8 but
only when they take explicit account of slab confinement which was uncovered here (Figs. 1, 2, 3, 4) in an analysis
ata20. It was also shown how this internal structure allows swarms to be driven through thermo-
of pre-existing d
dynamic cycles by the application of a suitable sequence of external perturbations to the swarms (Figs. 7, 8, 9).
Departures of the effective equation of state from the ideal gas law were here attributed to the swarms’ internal
structure and to presence of extrinsic and intrinsic noise rather than to interactions per se between individuals.
Here it was shown that predicted and observed departures from the ideal gas law are (over the accessible
parameter ranges) equally well represented by the non-linear equation of state advocated by Sinhuber et al.8 which
lacks a physical interpretation and by the conventional equations of state for van der Waals gases (Figs. 9c, 10).
Both thermodynamic descriptions are succinct yet complete and accurate. The non-uniqueness is not surpris-
ing given that similar macroscopic properties can emerge from different microscopic dynamics, i.e., emergent
macroscopic properties can be insensitive to microscopic details. Nonetheless, it was shown how similitude with
van der Waals gases is readily understood, thereby providing new insights into swarming.
Slab confinement could be facilitated by acoustic ordering. It has been suggested that to best facilitate detec-
tion of females, male mosquitoes within swarms seek to reduce the acoustic interference they create for another
by dividing the sounds they make into local clusters with unique tones24. Aldersley et al.25 subsequently revealed
the formation of frequency-domain clusters between individuals within audible range of one another. They noted
that this may be important for swarm formation and cohesion because flight tones are the interactive media
Scientific Reports | (2021) 11:14979 | https://doi.org/10.1038/s41598-021-94582-x 10
Vol:.(1234567890)www.nature.com/scientificreports/
through which inter-individual coupling and movement coordination takes place. Indeed, R eynolds18 showed
that the cohesion of midge swarms can be attributed to the observed tendency26 of midges to occasionally per-
form nearly harmonic oscillations conducted in synchrony with another midges. These pairwise interactions
do not typically occur between midges that are nearest neighbours and are presumably mediated a coustically26.
Being intrinsically linked to motor function, the flight tones should be reflected in the midge flight characteristics.
This is evidenced in distributions of acceleration (Figs. 5, 6). The potential connection between acoustic ordering
and the swarm structure warrants further investigation because if the modelling is to fully explain swarming, then
it must be rooted in the correct biology, rather than in assumptions at the epi-phenomenological level. Embryo
mathematical models for slab formation are presented in the Supplementary Material IV.
Intrinsic noise (i.e. thermal fluctuations) were shown to be crucial for the emergence of the thermodynamic
properties of midge swarms, as prefigured by R eynolds22. This mirrors previous studies which have attributed
the swarms’ emergent macroscopic mechanical properties, including for example, tensile strength and finite
yield strength, to the presence of intrinsic multiplicative n oise17,18. In this sense intrinsic noise, unlike internal
slab structure, sculpts both the thermodynamic and mechanical properties of swarms. It does so by restruc-
turing the basins of attraction (potential wells) that determine a swarm’s internal structure. Nonetheless, the
thermodynamic, gas-like properties and the solid-like, mechanical properties emerge under different kinds of
perturbations4,27, Sinhuber et al.8,11,14, i.e., the response of the swarms to external perturbations, whether gas-like
or solid-like, is context dependent. These emergent properties are thus complementary rather than contradictory
properties. In other words, external perturbations can drive phase transitions resulting in either gas-like or solid-
like states. These emergent properties can be advantageous, functioning, for example, to suppress imposed per-
turbations very efficiently and keeping the swarm stable and stationary even in a noisy, stochastic e nvironment11.
Nonetheless, their emergence may be an accidental by-product of the swarm dynamics rather than the result
of selection pressures for advantageous b ehaviours11,16,17. In the Supplementary Material VII & VIII I uncover
two further accidental but potentially advantageous behaviours. I show that laboratory swarms of Chironomus
riparius midges are close to being critically damped, i.e., are poised between being over- and underdamped.
Consequently, these midges tend to return to their equilibrium position—the centre of the swarm—in the
minimum time; typically, just failing to overshoot and not making single oscillations. With the aid of stochastic
models, I show that critical damping in insect swarms does not require fine tuning, because it arises freely. I also
report that insect swarms are predicted to behave like auxetic materials which have negative Poisson ratios, i.e.,
when swarms are pulled apart in one direction, as in Ni and O uellette4, they expand rather than contract in the
perpendicular direction. This suggests that swarms do not become inherently weaker when stretched because
they thicken in response to a tensile force, rather than becoming thinner like positive-Poisson-ratio material.
Finally, the similitude with van der Waals gases suggests that insect swarms can undergo the equivalent of a
liquid–gas phase transition (as prefigured in the Supplementary Material IV and complementing the analyses
of Reynolds16,22,28 and van der Vaart et al.11) and that these two phases can coexist. [Insects in the bottom ‘com-
pressed’ slab (Fig. 1) may correspond to liquid condensates that can form in van der Waals gases and which under
the action gravity settle out.] This warrants further investigation, as does the potential application to other kinds
of swarming insects [Supplementary Material IX].
Data availability
Computer codes can be obtained from the author.
Received: 13 April 2021; Accepted: 12 July 2021
References
1. Sinhuber, M. & Ouellette, N. T. Phase coexistence in insect swarms. Phys. Rev. Lett. 119, 178003 (2017).
2. Ouellette, N. T. Toward a ‘thermodynamics’ of collective behavior. SIAM News 40, 1–4 (2017).
3. Ouellette, N. T. The most active matter of all. Matter 1, 297–299 (2019).
4. Ni, R. & Ouellette, N. T. On the tensile strength of insect swarms. Phys. Biol. 13, 045002 (2016).
5. Peleg, O., Peters, J. M., Salcedo, M. K. & Mahadevan, L. Collective mechanical adaptation of honeybee swarms. Nat. Phys. 14,
1193–1198 (2018).
6. Tennenbaum, M., Liu, Z., Hu, D. & Fernandez-Nieves, A. Mechanics of fire ant aggregations. Nat. Mat. 15, 54–59 (2016).
7. van der Vaart, K., Sinhuber, M., Reynolds, A. M. & Ouellette, N. T. Mechanical spectroscopy of insect swarms. Sci. Adv. 5, eaaw9305
(2019).
8. Sinhuber, M., van der Vaart, K., Feng, Y., Reynolds, A. M. & Ouellette, N. T. An equation of state for insect swarms. Sci. Rep. 11,
3773 (2021).
9. Kelley, D. H. & Ouellette, N. T. Emergent dynamics of laboratory insect swarms. Sci. Rep. 3(1073), 1–7 (2013).
10. Puckett, J. G., Kelley, D. H. & Ouellette, N. T. Searching for effective forces in laboratory swarms. Sci. Rep. 4, 4766 (2014).
11. van der Vaart, K., Sinhuber, M., Reynolds, A. M. & Ouellette, N. T. Environmental perturbations induce correlations in midge
swarms. J. R. Soc. Int. 17, 20200018 (2020).
12. Gorbonos, D. et al. Long-range acoustic interactions in insect swarms: An adaptive gravity model. New. J. Phys. 18, 073042 (2016).
13. Okubo, A. Dynamical aspects of animal grouping: Swarms, schools, flocks, and herds. Adv. Biophys. 22, 1–94 (1986).
14. Sinhuber, M. et al. Three-dimensional time-resolved trajectories from laboratory insect swarms. Sci. Data 6, 190036 (2019).
15. Attanasi, A. et al. Collective Behaviour without collective order in wild swarms of midges. PLoS Comp. Biol. 10, e1003697 (2014).
16. Reynolds, A. M. Langevin dynamics encapsulate the microscopic and emergent macroscopic properties of midge swarms. J. R.
Soc. Inter. 15, 20170806 (2018).
17. Reynolds, A. M. On the origin of the tensile strength of insect swarms. Phys. Biol. 16, 046002 (2019).
18. Reynolds, A. M. On the emergence of gravitational-like forces in insect swarms. J. Roy. Soc. Inter. 16, 20190404 (2019).
19. Reynolds, A. M. & Ouellette, N. T. Swarm dynamics may give rise to Lévy flights. Sci. Rep. 6, 30515 (2016).
20. Sinhuber, M., van der Vaart, K. & Ouellette, N. T. Response of insect swarms to dynamic illumination perturbations. J. Roy. Soc.
Int. 16, 20180739 (2019).
Scientific Reports | (2021) 11:14979 | https://doi.org/10.1038/s41598-021-94582-x 11
Vol.:(0123456789)www.nature.com/scientificreports/
21. Turner, R. E. & Betts, D. S. Introductory Statistical Mechanics (Sussex University Press, 1974).
22. Reynolds, A. M. Intrinsic stochasticity and the emergence of collective behaviours in insect swarms. Euro. Phys. J. E. 44, 22 (2021).
23. Puckett, J. G. & Ouellette, N. T. Determining asymptotically large population sizes in insect swarms. J. R. Soc. Inter. 11, 20140710
(2014).
24. Lapshin, D. Mosquito bioacoustics: Auditory processing in Culex pipiens pipiens L. Males (Diptera, Culicidae) during flight
simulation. Ent. Rev. 92, 605–621 (2012).
25. Aldersley, A. et al. Emergent acoustic order in arrays of mosquitoes. Curr. Biol. 27, R1193–R1213 (2017).
26. Puckett, J. G., Ni, R. & Ouellette, N. T. Time-frequency analysis reveals pairwise interactions in insect swarms. Phys. Rev. Lett. 114,
258103 (2015).
27. Ni, R., Puckett, J. G., Dufresne, E. R. & Ouellette, N. T. Intrinsic fluctuations and driven response of insect swarms. Phys. Rev. Lett.
115, 118104 (2015).
28. Reynolds, A. M. Fluctuating environments drive insect swarms into a new state that is robust to perturbations. Europhys. Lett.
124, 38001 (2018).
Acknowledgements
The work at Rothamsted forms part of the Smart Crop Protection (SCP) strategic programme (BBS/OS/
CP/000001) funded through Biotechnology and Biological Sciences Research Council’s Industrial Strategy Chal-
lenge Fund. I thank Nick Ouellette, Michael Sinhuber and Kasper van der Vaart for numerous, encouraging and
fruitful discussions, and for disclosing unpublished findings.
Author contributions
A.M.R. conceived and undertook the research. A.M.R. wrote the main manuscript and prepared the figures.
Competing interests
The authors declare no competing interests.
Additional information
Supplementary Information The online version contains supplementary material available at https://doi.org/
10.1038/s41598-021-94582-x.
Correspondence and requests for materials should be addressed to A.M.R.
Reprints and permissions information is available at www.nature.com/reprints.
Publisher’s note Springer Nature remains neutral with regard to jurisdictional claims in published maps and
institutional affiliations.
Open Access This article is licensed under a Creative Commons Attribution 4.0 International
License, which permits use, sharing, adaptation, distribution and reproduction in any medium or
format, as long as you give appropriate credit to the original author(s) and the source, provide a link to the
Creative Commons licence, and indicate if changes were made. The images or other third party material in this
article are included in the article’s Creative Commons licence, unless indicated otherwise in a credit line to the
material. If material is not included in the article’s Creative Commons licence and your intended use is not
permitted by statutory regulation or exceeds the permitted use, you will need to obtain permission directly from
the copyright holder. To view a copy of this licence, visit http://creativecommons.org/licenses/by/4.0/.
© The Author(s) 2021
Scientific Reports | (2021) 11:14979 | https://doi.org/10.1038/s41598-021-94582-x 12
Vol:.(1234567890)You can also read