Acoustic analysis of starting jets in an anechoic chamber: implications for volcano monitoring - Nature
←
→
Page content transcription
If your browser does not render page correctly, please read the page content below
www.nature.com/scientificreports

            OPEN            Acoustic analysis of starting
                            jets in an anechoic chamber:
                            implications for volcano monitoring
                            J. J. Peña Fernández1*, V. Cigala2, U. Kueppers2 & J. Sesterhenn3

                            Explosive volcanic eruptions are associated with a plethora of geophysical signals. Among them,
                            acoustic signals provide ample information about eruptive dynamics and are widely used for
                            monitoring purposes. However, a mechanistic correlation of monitoring signals, underlying source
                            processes and reasons for short-term variations is incomplete. Scaled laboratory experiments
                            can mimic a wide range of explosive volcanic eruption conditions. Here, starting (non-steady)
                            compressible gas jets are created using a shock tube in an anechoic chamber and their acoustic
                            signature is recorded with a microphone array. Noise sources are mapped in time and frequency using
                            wavelet analysis and their dependence from pressure ratio, non-dimensional mass supply and exit-
                            to-throat area ratio is deciphered. We observed that the pressure ratio controls the establishment of
                            supersonic conditions and their duration, and influences the interaction between shock, shear layer,
                            and vortex ring. The non-dimensional mass supply affects the duration of the discharge, the maximum
                            velocity of the flow, and the existence of a trailing jet. Lower values of exit-to-throat area ratio induce
                            a faster decay of the acoustic fingerprint of the jet flow. The simplistic experiments presented here,
                            and their acoustic analysis will serve as an essential starting point to infer source conditions prior to
                            and during impulsive volcanic eruptions.

                            Abbreviations
                            Ae	Exit area
                            A*	Throat area
                            c0	Speed of sound in the reservoir at start
                            ce	Speed of sound at exit conditions
                            cj	Speed of sound at fully expanded conditions
                            De	Exit diameter
                            Dj	Diameter of the jet for fully expanded conditions
                            Dst	Diameter of the shock tube
                            Dvr	Diameter of the vortex ring
                            dts-sl-vr	Time delay between the compression wave and the shock-shear layer-vortex ring interaction
                            fBBSN	Frequency of the broad-band shock noise
                            fvr	Frequency of the vortex ring noise
                            fb	Bandwidth parameter of the complex Morlet transform
                            fc	Center frequency of the complex Morlet transform
                            L	Reservoir length
                            Ls	Shock cell spacing
                            M	Mach number
                            Md	Exit Mach number at the adapted conditions for the specific geometry
                            Mj	Mach number at fully expanded conditions
                            Re	Reynolds number
                            Rg	Specific gas constant
                            pr	Gas pressure in the reservoir at start

                            1
                             Institut für Strömungsmechanik und Technische Akustik, Technische Universität Berlin, Berlin,
                            Germany. 2Department of Earth and Environmental Sciences, Ludwig–Maximilians–Universität (LMU), Munich,
                            Germany. 3Fakultät für Ingenieurwissenschaften, Universität Bayreuth, Bayreuth, Germany. *email: fernand@
                            tnt.tu‑berlin.de

Scientific Reports |   (2020) 10:13576              | https://doi.org/10.1038/s41598-020-69949-1                                        1

                                                                                                                                   Vol.:(0123456789)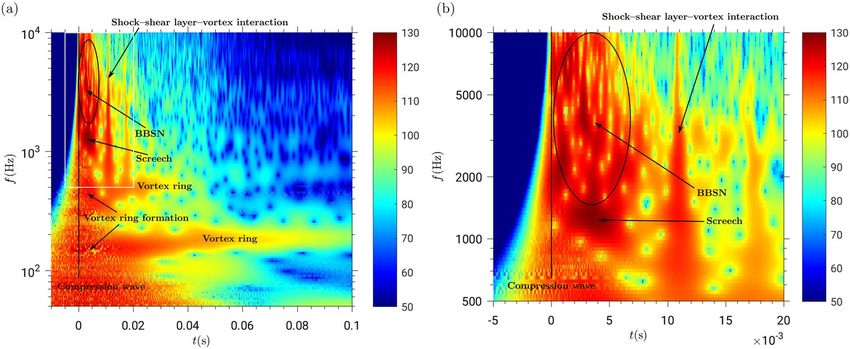
www.nature.com/scientificreports/
p∞ Gas pressure at unbounded chamber conditions
t Time
t* Characteristic time
Tj Temperature at fully expanded conditions
Tr Temperature in the reservoir at start
T∞ Temperature at unbounded chamber conditions
uj Flow velocity at fully expanded conditions
uKH Convection velocity of Kelvin–Helmholtz instability
uvr Propagation velocity of the vortex ring
π Pi
γ Isentropic exponent
μ Ratio core to vortex ring diameter
σ1 First root of the zero-order Bessel function
Explosive volcanic eruptions are hazardous events. Large events from volcanoes with longer (years, decades,
centuries) repose periods can to date be only poorly forecasted in terms of onset, eruption style and duration.
A mechanistic correlation of monitoring signals, the underlying source processes and reasons for short-term
variations is presently incomplete. Among the signals generated by erupting volcanoes and used for studying and
monitoring purposes, we focus on the acoustic signature. Explosive volcanic eruptions produce a broad range of
acoustic signals, from infrasound (< 20 Hz) to audible frequencies (20 Hz to 20 kHz). The dynamic range of this
signal, over five orders of magnitude in its amplitude, allows deriving information on shallow processes based
on frequency and wavelength variations. Moreover, and differently from seismic signals, which often represent
both superficial and deep internal processes, acoustic signals provide a plethora of information about the near-
vent eruptive dynamics.
Infrasound has been over the years the preferential frequency range because of its lower attenuation compared
to that in the audible range, allowing successful measurements over distances of tens to hundreds of k ilometers1,2.
Infrasound signals have been used to infer key eruption parameters, such as exit velocity or mass ejection r ate3–5,
based on a theoretical and experimental investigation of the radiation of audible noise, stimulated by “episodic
geyser-like eruptions of incandescent pyroclastics and gas” at Stromboli that produced noise “remarkably like that
of twin jet engines”6. More quantitively, Taddeucci et al.7 investigated impulsive, seconds-long volcanic explo-
sions and deciphered the sources and features of jet noise in the audible range. Goto et al.8 proposed a source
of noise in the different frequency ranges. Specifically, they suggested that the infrasonic part of the signal is
produced by magma doming at a free surface, while the high-frequency part reflects the consequent dynamics
of gas and particle ejection.
Background of the acoustics of supersonic jet flow and implications for volcanic
processes
During explosive volcanic eruptions, magma is fragmented inside the conduit. Gas and pyroclast ejection dynam-
ics into the atmosphere are the first direct observable. The interpretation of these dynamics requires knowledge
of source (e.g. magma porosity, pressure) and path parameters (e.g. conduit geometry, roughness). Here, analysis
of acoustic signals can provide constraints on these subsurface parameters.
Supersonic starting jet noise is produced by the impulsive release (volcanic explosion) of fluid contained in a
ow9. The noise of a single explosion
pressurized reservoir at a pressure ratio large enough to deliver supersonic fl
is generated by several processes at various locations and the main components a re9:
(1) Compression wave generated by the sudden release of pressure;
(2) Vortex ring noise, generated when the fluid rolls-up at the nozzle lip;
(3) Turbulent jet mixing noise (TMN) caused by the turbulence in the jet;
(4) Broadband shock noise (BBSN) induced by the interaction of shocks and the turbulence in the shear layer;
and
(5) Screech tone produced by the interaction between the shocks and the turbulence in the shear layer.
The difference of the present study is the temporal evolution of the noise sources in contrast to steady jet
oise10–12. For non-steady jets as in the present study, a jet is composed of three phases: (1) the build-up phase
n
leading to phase 2, (2) the quasi-steady jet phase, and (3) the final phase when the driving pressure is decaying.
1. The compression wave is a finite jump in pressure. For this reason, when performing a frequency analysis
of the pressure time series, all frequencies are excited when the compression wave reaches the microphone.
Compression waves travel at the speed of sound if they are generated with p r/p∞ lower than 41.213. For larger
values, it is considered a blast wave and its propagation Mach number is larger than 1. In general, larger p r/
p∞ generate stronger compression waves but very large values are needed to generate compression waves
with a noticeable larger amplitude14.
2. The vortex ring frequency can be estimated as proposed by Kopiev15 and Ran and Colonius16 using
uvr
fvr =
(1)
πµ2 Dvr log µ8 − 41
Scientific Reports | (2020) 10:13576 | https://doi.org/10.1038/s41598-020-69949-1 2
Vol:.(1234567890)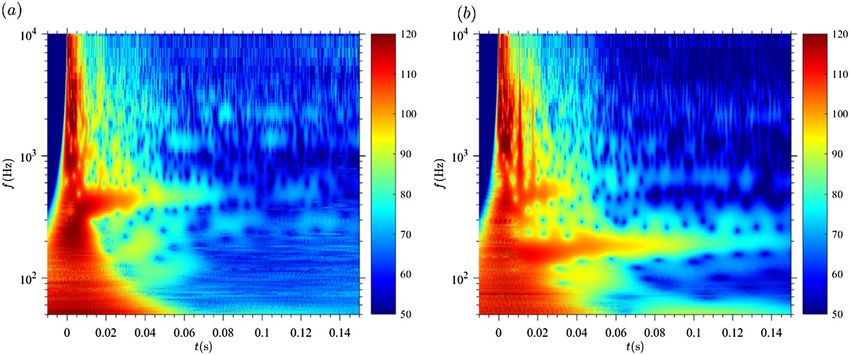
www.nature.com/scientificreports/
Figure 1. Peak frequency of the broadband shock noise (BBSN) radiated by a jet with different Mach numbers
(Mj) and diameters (D) for γ = 1.67 and a reservoir to unbounded chamber temperature ratio Tr/T∞ = 1. The
color-scale ranges from 3.75 to 20 000 Hz, the same frequency range as our microphone. This frequency range is
also represented in the diagram with two solid black lines. The two dashed black lines correspond to the average
human hearing frequency range (20–17 000 Hz).
For symbol explanation see list of symbols.
3. The TMN is the dominant noise component in the downstream direction of the jet9 and generated by the
turbulence of the jet flow. It cannot always be depicted as it is usually masked by the supersonic noise sources
in the transverse direction. Both the large turbulent structures (also known as coherent structures and with
a size of the order of the exit diameter D
e) and the small vortices of the turbulence (also known as fine-scale
turbulence and with a larger range towards smaller sizes when increasing the Reynolds number) contribute
to the TMN although they are not radiated in the same direction. The TMN of large structures is radiated
mainly downstream while the fine-scale TMN is radiated in the transverse direction. The fine-scale TMN
peak frequency depends on the Reynolds number of the fl ow17 since the amount and size of large and small
turbulent structures also depends on the Reynolds number, being the large turbulent structures always of a
size similar to D
e.
4. The broadband shock noise (BBSN) radiated by a jet depends on the shock-cell spacing Ls (distance between
two shocks) and the propagation velocity of the Kelvin–Helmholtz vortices (assuming u KH = 0.7 uj). The
related peak Strouhal number is 118:
fBBSN Ls
=1 (2)
uKH
and describes a universal behavior for supersonic jets. The shock-cell spacing depends on the throat diam-
eter, the Mach number, and the isentropic exponent of the gas in the reservoir (see equations below). The
eddy convection velocity depends mainly on the Mach number and the isentropic exponent of the gas in the
reservoir. At volcanoes, geometry and gas compositions vary. Unfolding the dependence of the shock-cell
spacing and the eddy convection velocity with the Mach number and exit diameter, we show the peak fre-
quency of the BBSN for different Mach numbers and exit diameters (Fig. 1). Experimental setups (millimeter
to centimeter throats) produce a jet which radiates BBSN frequencies above 10 kHz over a large range of
Mach numbers, while natural volcanic jets (released from decimeter- to meter-sized vents that are on top
of conduits of so far unconstrained dimensions) produce jets that radiate in the range of 20–1,000 Hz. For
even larger diameters, e.g. 100 m, the BBSN frequencies are in the infrasonic range (down to 0.1 Hz or even
0.01 Hz)19. Based on the scaling law of Peña Fernández9, the peak frequencies of the supersonic jet noise
sources of laboratory experiments can be scaled to nature without losing accuracy:
σ1 cj
fBBSN =
(3)
π Mj2 D
−1 j
where the different parameters can be calculated using:
γ +1
1
1 + 21 (γ − 1)Mj2
4(γ −1)
Md 2
Dj = Dst (3.1)
1
1+ 2 (γ − 1)Md2 Mj
Scientific Reports | (2020) 10:13576 | https://doi.org/10.1038/s41598-020-69949-1 3
Vol.:(0123456789)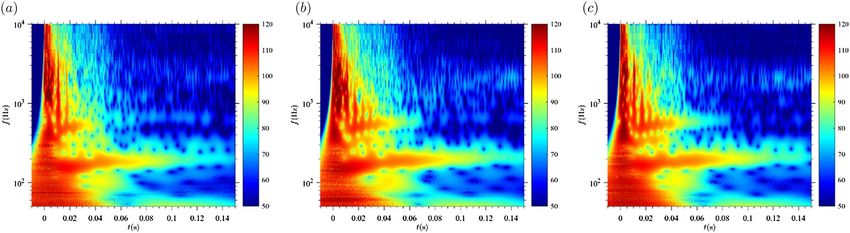
www.nature.com/scientificreports/
γ −1
12
2 p0r γ
Mj = −1 (3.2)
γ −1 p∞
γ +1
γ +1
Ae 2 2(γ −1) 1 γ −1 2 2(γ −1)
= 1+ Md (3.3)
A∗ γ +1 Md 2
cj = γ Rg Tj (3.4)
γ − 1 2 −1
Tj = Tr 1 + Mj (3.5)
2
For symbols’ explanation see list of symbols.
5. The scaling law for the screech tone frequency according to Schulze20 is:
−1
�
0.67Mj cj Dj
1 + � 0.7Mj T∞
fscreech = � (4)
Mj2 − 1
� � Tr
1 + γ −1
2 M 2
j
For symbols’ explanation see list of symbols.
The behavior of a starting jet with a fixed geometry is governed by four main dimensionless parameters21:
(1) the Reynolds number (Re), affecting mainly the size of the Kelvin–Helmholtz instabilities relative to the
nozzle diameter,(2) the non-dimensional mass supply (L/Dst) given by the length (L) of a hypothetical cylindri-
cal reservoir of diameter Dst, influencing the existence of a trailing jet as well as the maximum velocity of the
flow at the nozzle exit; (3) the reservoir-to-unbounded chamber pressure ratio ( pr/p∞), having an effect on the
compressibility and (4) the reservoir-to-unbounded chamber temperature ratio Tr/T∞, also having an effect on
compressibility.
Another important non-dimensional parameter of jet dynamics is the characteristic time (t* = t Dst/uj), defined
as the time the flow needs to advance the distance of one nozzle diameter at the typical velocity of the flow. For
instances, using the cylindrical nozzle with 28 mm diameter, one characteristic time is 0.04 ms.
In this work, we focus on acoustic signals in the audible frequency range. We produced starting compressible
gas jets under controlled conditions in the laboratory using a shock tube a pparatus22,23 and recorded the acoustic
signature produced by the impulsive decompression in the anechoic chamber (Fig. 2) and mapped noise sources
in time and frequency. The complete dataset with starting conditions and raw acoustic measurements is available
through the EPOS database24. This will be the foundation for future quantitative analysis of experiments with
increased geometrical complexity, elevated reservoir temperature and containing particles and will ultimately
serve to scale the measurable noise of volcanic eruptions to the underlying conditions. Varying some governing
parameters (pressure and geometry) allowed to empirically constrain their influence on acoustic properties of
the generated jets.
With reservoir temperature and gas species constant, we varied the following parameters (Fig. 2) (and list
the volcanic parameter in parentheses):
• Reservoir-to-unbounded chamber pressure ratio ( pr/p∞) = [3, 4, 50 and 80]. (Gas overpressure inside gas
bubbles in magma)
• non-dimensional mass supply (L/Dst) = [2, 8] (gas bubble or slug size)
• nozzle geometry parametrized by the exit-to-throat area ratio ( Ae/A*) = [1, 2.37, 4] (conduit and vent geom-
etry)
Results
Acoustic fingerprint identification of the physical elements in the wavelet diagram. To locate
the acoustic components in frequency and time, we transformed the signal into the frequency space using the
wavelet decomposition (see section “Methods” for details). In this way, we can identify the acoustic fingerprint
of every element of the compressible starting gas jet. Figure serves as an example for experiments at pr/p∞ = 50,
L/Dst = 8, Ae/A* = 1 and the acoustic fingerprints are presented in the following:
• At the gas release time (t = 0), the fingerprint of the compression wave can be identified by the excitation of all
frequencies. Note here that in the wavelet transform the temporal resolution is lower for lower frequencies,
which leads to the broadening of the signal in time for lower f requencies25.
• When the contact surface of the flow (the boundary between the fluid located initially inside and outside the
reservoir) reaches the exit of the shock tube, a vortex ring is formed, radiating a frequency of 2.45 kHz. With
time, a vortex ring grows radially while decelerating vertically26, leading to an almost constant frequency
radiated over time. For the set of parameters in this study, this frequency was in the range of 200 Hz.
Scientific Reports | (2020) 10:13576 | https://doi.org/10.1038/s41598-020-69949-1 4
Vol:.(1234567890)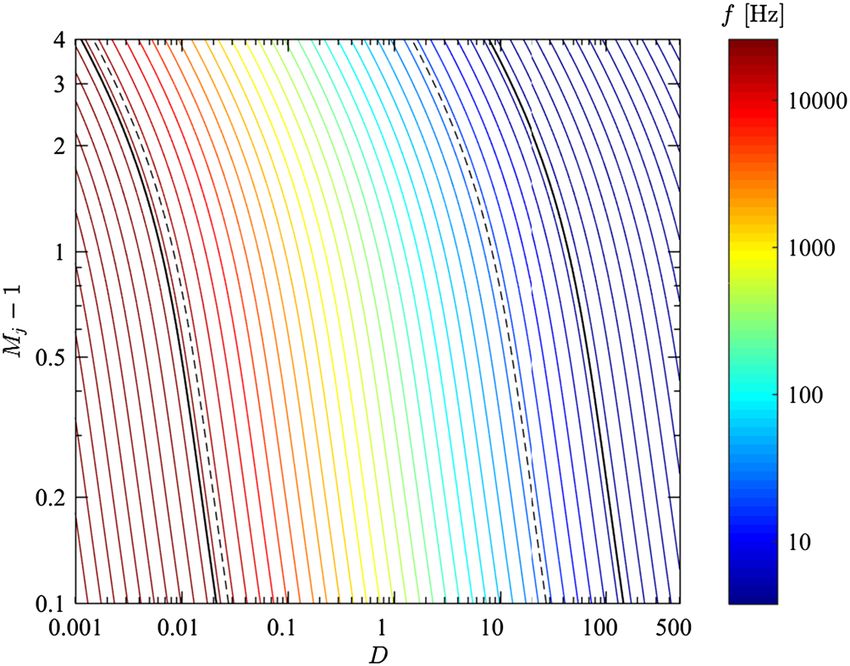
www.nature.com/scientificreports/
Figure 2. Setup configuration. Shock tube with a constant diameter Dst and variable length L. Three shock-tube
exit geometries were studied as represented: (1) straight, (2) slightly divergent and (3) strongly divergent. The
microphone was located at a similar height to the shock-tube exit at a distance of 12.5 D at an angle of 2.29°. In
the setup used, Dst also represents the throat diameter, the smallest diameter the flow as to pass through. D
e is
the exit diameter and it also represents the vent diameter.
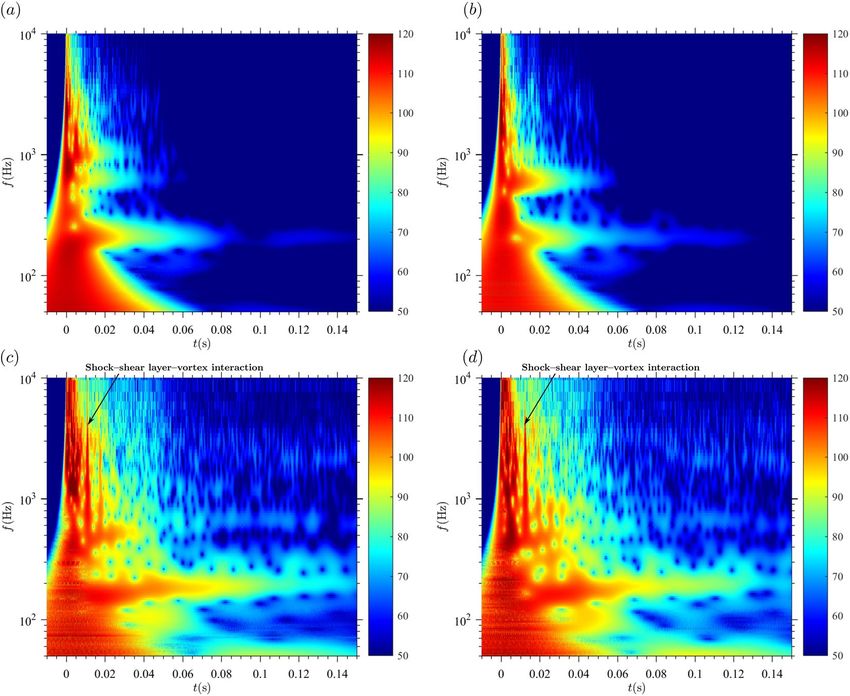
Figure 3. Identification of the elements of the starting jet in the wavelet diagram. The color scale represents
the sound pressure level [dB] at the microphone location. Pressure ratio pr/p∞ = 50; L/D = 8; Ae/A* = 1. (a) The
compression wave, vortex ring, screech, broadband shock noise and the shock-shear layer-vortex interaction can
be identified in the diagram by matching the frequency and time delay estimations with the patterns found in
the spectrogram from the recorded signals. The white frame is the region represented in panel (b). (b) Zoom in
of the wavelet diagram. BBSN and screech can be identified as well as the shock-shear layer-vortex interaction.
• About ten characteristic times after release (0.4 ms), a jet flow is fully developed at the shock tube exit, as
identified in the wavelet diagram by the relatively large amplitude (approximately 120 dB for the setup in this
study). For different frequency regimes, we can identify the different components of jet noise, when measur-
ing the acoustic signal at a position close to the shock tube exit plane (see measurement position in Fig. 2).
• The BBSN peaks at 3.51 kHz in Fig. 3, as expected following Peña Fernández9.
• The screech can be found at a frequency of 1.4 kHz in Fig. 3, which agrees with S chulze20. However, as the
analyzed jets are not steady, the screech frequency decreases with time to reach a minimum frequency
(around 1 kHz), followed by another rise as the reservoir discharges. This frequency shift is due to the (non-
linear) dependence with the Mach n umber9. Usually, the screech tone has a similar frequency to the lowest
frequency radiated by the B BSN27. This pattern becomes obvious in Fig. 3b, where the lowest part of the dark
Scientific Reports | (2020) 10:13576 | https://doi.org/10.1038/s41598-020-69949-1 5
Vol.:(0123456789)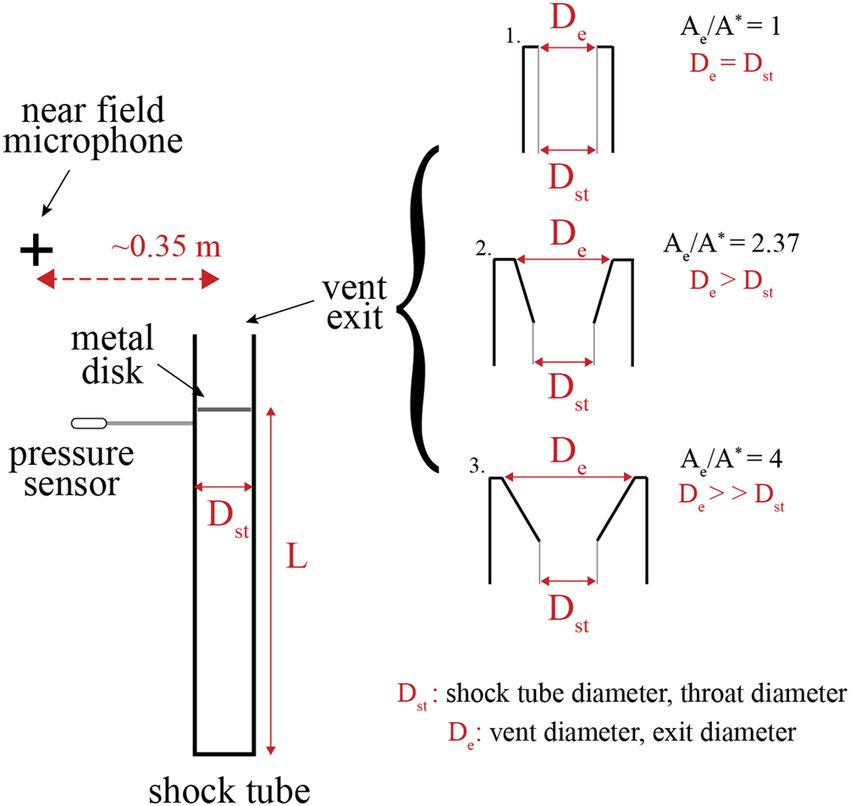
www.nature.com/scientificreports/
Figure 4. Effect of the pressure ratio on the acoustic signature of the shock-tube in the wavelet diagram. The
color scale represents the sound pressure level [dB] at the microphone location. Ae/A* = 1 and L/D = 8. (a) pr/
p∞ = 3. (b) pr/p∞ = 4. (c) pr/p∞ = 50. (d) pr/p∞ = 80.
red spot (t = 6 ms and frequency around 1 kHz) corresponds to the screech tone while the adjacent dark red
zone with slightly larger frequencies (not separated by a low amplitude region) corresponds to the BBSN.
• The peak frequency of the fine-scale TMN depends on the Reynolds number17. The range of Reynolds num-
bers present in this study (around 107) leads to a peak frequency for the fine-scale TMN around 10 kHz,
corresponding to the range of the BBSN and therefore masked by it.
• Acoustic fingerprints similar to the one of the compression wave are present in the wavelet diagram of Figure
b for t = 11 ms. This secondary acoustic wave is due to the interaction between the shock, the shear layer
and the vortex ring as first reported by Peña Fernández and Sesterhenn21. The acoustic wave resulting from
this interaction was observed, as expected by21, 11 ms after the compression wave (see Fig. 3b “shock—shear
layer—vortex ring interaction”). This interaction has been identified for the first time in an experimental
acoustic dataset. These secondary acoustic waves cannot correspond to secondary pressure waves due to
reflections at the bottom of the reservoir: for L/Dst = 8, the delay with respect to the primary compression
wave is in the order of 1 ms; for L/Dst = 2, the delay is in the order of 0.1 ms. This signature can furthermore
not correspond to reflections at the walls of the anechoic chamber because the expected delay with respect
to the compression wave would be 20 ms (based on the size of the anechoic chamber and the position of the
setup).
Effect of the main parameters on the acoustic fingerprint. In our measurements, we have varied
the pressure ratio (pr/p∞), the non-dimensional mass supply (L/Dst) and the exit-to-throat area ratio (Ae/A*) and
show their effect on the acoustic fingerprint changes.
1. Pressure ratio (Fig. 4)
• Concerning the compression wave, we observed no variation of frequency or amplitude on the recorded
signals, as all frequencies have been excited for all experiments in this study and the arrival of the compres-
sion wave at the microphone was used to synchronize our experiments.
• Regarding the vortex ring, its frequency is approximately constant (around 200 Hz; although slightly larger
for pr/p∞ = 3 and 4, as expected from Kopiev15. On the other hand, its amplitude and duration change notice-
ably and are positively correlated with pressure ratio, because the amount of energy and vorticity contained in
Scientific Reports | (2020) 10:13576 | https://doi.org/10.1038/s41598-020-69949-1 6
Vol:.(1234567890)www.nature.com/scientificreports/
the vortex is larger. for pr/p∞ = 3, the fingerprint vanishes after approximately 0.09 s. For pr/p∞ = 4, the acous-
tic fingerprint vanishes after approximately 0.13 s while for pr/p∞ = 50 and above, the acoustic fingerprint
is even longer, and the end is not represented in Fig. 4. Amplitude and vortex ring noise are also positively
correlated with pressure ratio: at t = 0.05 s for example, the amplitude for p r/p∞ = 50 is around 100 dB while
around 70 dB for p r/p∞ = 3 and 4.
• No BBSN nor screech tone were recorded for p r/p∞ = 3 and 4.
• TMN is the dominant noise component (which can be seen just after the compression wave), ranging in
frequency from 600 to 10,000 Hz. It evolves towards lower values because the vortices grow (a size more
similar to that of the shock tube exit) as the Reynolds number of the flow decreases. For p r/p∞ = 50 and 80,
the supersonic jet noise components (BBSN and screech) are dominant and partially mask the TMN. Screech
has a lower frequency for p r/p∞ = 80 (about 450 Hz) than for p r/p∞ = 50 (about 1200 Hz). After the supersonic
jet noise sources disappear, TMN still radiates some noise, but at diminishing rates. For p r/p∞ = 80 the decay
is slower than for p r/p∞ = 50.
• Both high-pressure cases show the shock-shear layer-vortex interaction, although not for the same delay
with respect to the compression wave. The low-pressure cases do not show any interaction between the
shock-wave, the shear layer and the vortex ring because the supersonic phase, if existent, has duration too
short for such interaction to take place.
• This delay depends on the shock-cell spacing (Ls), which is, in turn, mainly dependent on the pressure ratio,
and the velocity of the Kelvin–Helmholtz instabilities of the jet flow. We found that the delay can be calculated
as follow:
Ls
dts−sl−vr = (5)
uKH
Using the following relationships:
Ls π 2 Dj
= Mj − 1 (5.1)
Dst σ1 Dst
γ +1
γ −1 2
4(γ −1)
1
Dj 1+ 2 Mj Md 2
= (5.2)
Dst γ −1 2 Mj
1+ 2 Md
γ
pr γ −1 2 γ −1
= 1+ Mj (5.3)
p∞ 2
uKH = 0.7uj = 0.7Mj cj (5.4)
1
c0 γ −1 2 2
= 1+ Mj (5.5)
cj 2
where we assume the velocity of the Kelvin–Helmholtz instabilities to be 70% of the fully expanded velocity.
We get to:
1
1 pr 2 1
Mj γ −1 p∞ pr 2γ
dts−sl−vr ∼ ∼
γ −1 ∼ (6)
Mj pr 2γ p∞
p∞
which means for Argon (γ = 1.67) an exponent of 0.299. The average value of the exponent in the cases here
presented is 0.3 and the exponents of all cases are within the interval (0.28, 0.32), which agrees very well
with the analytical solution.
2. Non-dimensional mass supply (L/Dst) (Fig. 5)
The non-dimensional mass supply (L/Dst) has three main effects: (i) the duration of the discharge and (ii)
the maximum velocity of the flow are positively correlated with L/Dst and (iii) the existence of a trailing jet
is expected for values of L/Dst larger than approximately f our28. Figure 5 shows the acoustic fingerprint of
Ae/A* = 1 and pr/p∞ = 50. L/Dst varied between 2 and 8.
• Discharge duration and maximum flow velocity are larger for L/Dst = 8 than for L/Dst = 2. For t = 0.05 s, the
noise radiated by L/Dst = 8 is significantly larger than for L/Dst = 2.
• The shock-shear layer-vortex interaction can be observed for L/Dst = 8 but not for L/Dst = 2.
• The vortex ring can be identified for both cases around 600 Hz. For L/Dst = 8, an additional vortex ring with a
lower frequency (around 200 Hz) can be observed. This additional vortex ring propagates at a lower velocity.
3. Nozzle geometry, parametrized by the exit-to-throat area ratio (Figure)
Scientific Reports | (2020) 10:13576 | https://doi.org/10.1038/s41598-020-69949-1 7
Vol.:(0123456789)www.nature.com/scientificreports/
Figure 5. Effect of the non-dimensional mass supply on the acoustic signature of the shock-tube in the wavelet
diagram. The color scale represents the sound pressure level [dB] at the microphone location. A
e/A* = 1 and p0r/
p∞ = 50. (a) L/D = 2. (b) L/D = 8.
Figure 6. Effect of the nozzle geometry on the acoustic signature of the shock-tube in the wavelet diagram.
The color scale represents the sound pressure level [dB] at the microphone location. L/D = 8 and p0r/p∞ = 50. (a)
Ae/A* = 1. (b) Ae/A* = 2.36. (c) Ae/A* = 4.
The nozzle geometry affects the portion of the flow inside the setup before crossing the nozzle exit plane. A
divergent nozzle enables the flow to expand in the supersonic regime but causes compression in the subsonic
regime. The larger A e/A*, the stronger this effect. Figure 6 shows the acoustic fingerprint of L/Dst = 8 and pr/
p∞ = 50. Ae/A* varied from 1 to 4.
• Frequency of compression wave and vortex ring does not change. However, larger Ae/A* generates more
stable vortex rings with accordingly larger amplitudes for a longer time.
• The decay of the acoustic fingerprint of the jet flow (i.e. TMN, BBSN and screech) is negatively correlated
(see the time evolution of the three cases presented in Fig. 6 at a frequency around 600 Hz). Once the flow
e/A* = 1 as the divergent
at the throat is no longer choked (= subsonic), the flow velocity will be higher for A
geometry acts as a diffuser. The delay of the shock-shear layer-vortex ring interaction with respect to the
compression wave is constant (11 ms).
Ls
dts−sl−vr = (7)
uKH
Using the following relationship (and 5.1 to 5.5):
uKH = 0.7Md ce
where the velocity of the Kelvin–Helmholtz instabilities is written as a function of the conditions at the nozzle
exit. For symbols’ explanation see list of symbols.
We get to:
Scientific Reports | (2020) 10:13576 | https://doi.org/10.1038/s41598-020-69949-1 8
Vol:.(1234567890)www.nature.com/scientificreports/
1 γ +1 1
2 4(γ −1) + 2 5−3γ
5−3γ
Md Ae 16
(8)
dts−sl−vr ∼ ∼ Md8(γ −1) ∼
Md A∗
where the exponent takes the value of − 6.25·10–4 for γ = 1.67.
Discussion
Among the signals generated by volcanoes and used for monitoring purposes, we chose the acoustic signal as it
provides information about the eruptive dynamics in the near-vent region and allows for correlating parameters
of particle ejection and eruption column to the underlying (mostly subsurface) conditions (e.g., geometry, pres-
sure) via empirical relationships. However, most of the state-of-the-art correlations are based on simple geo-
metrical systems, and the complex volcanic features are often not taken into account as underlined by Matoza
et al.3,11. Swanson et al.29 were the first performing an experimental investigation of jet acoustic issuing from
nozzles of different geometries with application to volcanoes. They used nozzles with convergent, cylindrical,
and divergent walls ( Ae/A* ranging from 0.1 to 2). The experimental setup is, in general, different from the one
we used, and they did not minimize external noise in their runs. They were able to distinguish jet noise from
structural features of flows exiting the convergent nozzles only. We performed acoustic measurements of a shock
tube in an anechoic chamber varying the pressure ratio (pr/p∞), the non-dimensional mass supply (L/Dst) and the
exit-to-throat area ratio ( Ae/A*). Performing the experiments in an anechoic chamber gave us the possibility to
define the signature of all the different sources of noise with high accuracy and map them in time and frequency.
Based on the timing and frequency estimations of the different elements of the starting jets, we have been able
to identify multiple elements in the wavelet diagram and the controlling parameters:
The compression wave is a jump in pressure, and when transformed to the frequency space, it can be identi-
fied by the excitation of all frequencies for a single time. No variation is expected in the frequency distribution
of the compression wave since all frequencies will be excited. This element is present in all cases that we have
measured. We expected to have a slightly stronger compression wave for larger p r/p∞, which is represented by
larger amplitudes in the acoustic fingerprint but the values used in this study do not lead to large differences in
the noise amplitude of the compression wave. Noticeable larger p r/p∞ are needed to perform a proper analysis.
We synchronized all recorded signals using the arrival of the compression wave to the microphone; hence we
have no information about the propagation velocity of the compression wave in the different cases.
The vortex ring is generated at the lip of the shock tube exit when the flow rolls up due to the instability caused
by the large velocity gradients. Vortex rings are very robust structures that can travel long distances without
becoming unstable26. While propagating in the axial direction, the vortex ring radius grows, and the propagation
velocity decreases. For this reason and according to Eq. (1), the frequency radiated by the vortex ring is almost
constant over time. We have confirmed that for larger pr/p∞, the vortex ring frequency decreases slightly. For L/
Dst = 8, an additional vortex ring was observable in the wavelet diagram with a lower frequency, meaning that it
moves much slower than the first one (around one third of the velocity assuming a similar shape than the former
vortex ring), driven by generally lower exit velocities with time. This also agrees with the accepted theory of
Gharib28 that the trailing jet exists for L/Dst > 4. Larger values of Ae/A* are positively correlated with stability and
noise radiation duration of the vortex rings. We observed vortex rings under all experimental parameter combi-
nations. Quantifying vortex ring characteristics of explosive eruptions (diameter and its evolution, propagation
velocity) will contribute to constraining the commonly unknown vent diameter26.
The quasi-steady trailing jet has established a few characteristic times after the release of the pressure from
the shock tube for L/Dst = 8. In this case, supersonic noise sources are dominant over subsonic o nes27.
In the wavelet diagram for the supersonic cases, we identified the BBSN as a high amplitude region. Its fre-
quency can be estimated using equation (). Its frequency decreases for increasing Mach numbers and therefore
for larger p r/p∞ and L/Dst. The duration of the quasi-steady jet phase can be correlated with L/Dst. Assuming a
pressure ratio large enough to deliver sonic flow at the throat and a known vent diameter (see equations in the
sections above), this correlation will give insights into erupted gas volume (and possibly fragmentation depth),
but this topic needs further investigation.
The screech tone showed the highest amplitude of noise sources. Its frequency is lower than that of the BBSN
and was found to be negatively correlated with Mach number. Accordingly, its frequency can be estimated using
equation ().
Following Bailly and Bogey17 and for a Reynolds number of 107, the TMN peak frequency is about 10 kHz
for the experiments in this study. As this frequency is similar to that of the BBSN, this noise source is masked by
BBSN and therefore does not provide any additional information.
For some combinations of pr/p∞ and L/Dst, we did not identify any supersonic jet noise source (BBSN, TMN,
screech) in the wavelet diagrams, meaning that the jet had never reached supersonic conditions. We speculate
that, if generated at all, the duration of supersonic flow was too short to radiate supersonic jet noise components,
i.e. insufficient time for the vortices of the flow to interact with the shock waves.
We could identify an acoustic wave resulting from the interaction between the shock, the shear layer and the
vortex ring, theoretically first postulated by Peña Fernández and Sesterhenn21. The delay between compression
and acoustic wave is independent of Ae/A* and depends on pr/p∞ (see Eqs. 6 and 8). This could be quantified
remarkably well for the different experimental conditions of this study (Figs. 4c,d, 5b and 6).
The results obtained in this study can be used to attempt upscaling of the experimentally constrained relation-
ships to volcanic systems. The equations presented above show that there are relationships between Mach number,
gas properties, Ae/A*, pr/p∞, L/Dst and the peak frequency of the supersonic jet noise sources. Taking BBSN as
an example, Fig. 1 shows that its dominant frequency is negatively correlated with De. Based on Eq. 3, the peak
Scientific Reports | (2020) 10:13576 | https://doi.org/10.1038/s41598-020-69949-1 9
Vol.:(0123456789)www.nature.com/scientificreports/
frequency of the BBSN would be approximately 170 Hz when assuming (i) a cylindrical conduit and vent of 1 m
diameter, (ii) gas composition (80% water, 10% C O2 and 10% S O2) leading to an isentropic exponent of γ = 1.31
and a gas constant R g = 401.1, and (iii) a Mach number M = 3. For reference, in the experimental setup with a
conduit diameter of 28 mm and a composition 100% Ar (γ = 1.67 and Rg = 208) at a Mach number of M = 3, the
peak frequency of the BBSN is 3.51 kHz.
We are aware that volcanic jets are characterized by even more complex dynamics than the ones here tested
(e.g. presence of particles, rough conduit, dynamic evolution of the vent area, external noise, etc.). However, we
can characterize all the important elements of the shock tube discharge from acoustic measurements using a
single microphone: compression wave, vortex ring, the components of the supersonic jet noise and the interac-
tion between the shock, the shear layer and the vortex ring. At low particle concentration in a dilute flow, robust
supersonic structures may not be significantly affected. We refer to the investigation of further complexities, like
the presence of particles, but also less clean ambient conditions to future work. “Clean” laboratory experiments
in an anechoic room are an essential starting point for future links between scaled and reproducible laboratory
experiments (with all starting parameters known) and natural volcanic eruptions (without any parameter known
a priori).
Conclusions
The analysis of acoustic signals is nowadays widely used for volcano monitoring purposes. Nevertheless, many
uncertainties remain in the parameters retrieved from acoustic analysis due to the complexity of volcanic systems.
The present investigation focused on a better understanding of the relationship between source parameters and
acoustic signals generated by compressible starting gas jets. Compressible starting (i.e. non-steady) gas jets have
been generated using a shock tube system in an anechoic chamber and their acoustic noise sources have been
located in time and frequency using wavelet analysis. The effect of the following parameters has been analyzed:
pressure ratio (pr/p∞), non-dimensional mass supply (L/Dst) and exit-to-throat area ratio ( Ae/A*).
• pr/p∞ controls (1) the establishment of supersonic conditions in the jet flow, (2) the duration of supersonic
conditions in the jet flow, and (3) the interaction between shock, the shear layer, and the vortex ring.
• L/Dst is positively correlated with (1) the duration of the discharge, and (2) the maximum flow velocity and
affects (3) the existence of a trailing jet.
• Ae/A* is negatively correlated with the duration during which individual acoustic fingerprints can be observed.
We have performed this study under controlled ambient conditions in the anechoic chamber, which gave
us the possibility to focus on the acoustic fingerprints of each noise-producing jet structure with high accuracy
and to map them in time and frequency. Finally, we show how the relationships found can be applied to volcanic
scenarios by scaling the results of this study to infer the conditions at the source of short-lived explosive volcanic
eruptions. These experiments serve as a starting point to empirically constrain the link between acoustic finger-
prints of compressible starting gas jets (experimentally generated and repeatable) to acoustic signals measured
during impulsive volcanic explosions.
Methods
Shock tube discharge. The jets are generated with the vertical shock tube apparatus originally developed
by Alidibirov and D ingwell30 and used by Cigala et al.23 to investigate the dynamics of particle-laden starting
jets at volcanic conditions. The shock tube (made of Nimonic 105 alloy) allows for high P–T conditions (up to
100 MPa and 850 °C). The shock tube has an internal diameter of 28 mm (Dst) and is 60 or 240 mm high (L).
To reduce the length of the tube from 240 to 60 mm and thus the internal volume, a full cylinder of Teflon of
180 mm is being fixed at the bottom of the shock tube. The internal volume of 0.032 or 0.127 l, respectively, is
being pressurized by Argon gas. The shock tube system is sealed from ambient conditions via one tailored metal
disk. Depending on the desired pressure ratio, a disk of aluminum foil, copper or iron was chosen (in order of
increasing stability). The combination of the type of metal, its thickness and imprint depth of a ring and a cross
is controlling the absolute pressure differential that a disk can withstand. Empirically constrained disks with reli-
able opening pattern and stability have been chosen. The disk bursts at the desired overpressure in four triangle-
shaped segments (less regular for the aluminum disk only) that are being bent upwards by 90° and end along
the shock tube walls, generating some internal diameter variation (between 26 and 28 mm). At the shock tube
exit, three nozzle geometries have been deployed: a cylindrical and two funnel-shaped nozzles. The geometries
are parametrized by the exit-to-throat area ratio ( Ae/A*) = (1, 2.37, 4). In this study, all experiments took place
at chamber temperature. Four overpressure scenarios (3, 4, 50 and 80 bar, respectively) have been investigated,
with each set of experimental conditions having been repeated two times, resulting in pressure scenarios of
3.2 ± 0.1, 3.6 ± 0.3, 47.5 ± 2.6 and 78.4 ± 4.7 bar.
Acoustic data acquisition system. The half-inch microphone used is manufactured by PCB with a fre-
quency range of 3.75–20,000 Hz. The sampling rate is 102 kHz. We have analyzed the jet noise recorded in the
near field with one microphone located at the shock tube exit plane at 0.35 m from the shock tube axis (see Fig. 2
for reference). The measurements have been triggered manually, taking into consideration the release of the
pressure in the shock tube.
Anechoic chamber. We have performed the measurements in the anechoic chamber facility of the Tech-
nische Universität Berlin. It has a free volume of 1,070 m3 and a walkable area of 126 m2. The certified lower
Scientific Reports | (2020) 10:13576 | https://doi.org/10.1038/s41598-020-69949-1 10
Vol:.(1234567890)www.nature.com/scientificreports/
frequency limit of the anechoic chamber is 63 Hz. This means that signals with lower frequencies than the lower
bound of the anechoic chamber will be affected by the acoustic properties of the anechoic chamber, and the
results will not be trustworthy. We cannot make any statement for frequencies lower than the lower bound of
the anechoic chamber.
Wavelet analysis of acoustic signals. To locate the different noise sources in frequency and time and
retrieve more information about the physical processes that led to these acoustic signals, we have performed a
time–frequency analysis of the acoustic signals recorded. For the analysis, we chose the wavelet transform over
the short-time Fourier transform because the former has a constant relative error in frequency space while the
latter has a constant absolute error in frequency s pace25,this difference allows a suitable resolution over the whole
frequency range being able to identify better the noise sources in time–frequency. After testing different wave-
forms, we have performed the wavelet transformation using the complex Morlet wavelet and we have chosen the
bandwidth parameter fb = 1.5 and a center frequency of fc = 1. The start and end frequencies are chosen to match
the nominal frequency range of the microphones. With this setup, we achieved a relative error in the frequency
space of about 4%. We used a logarithmic distribution of the frequencies during the computation of the wavelet
coefficients for better visualization of the spectrograms and an easier interpretation of the results.
Received: 13 April 2020; Accepted: 1 July 2020
References
1. Johnson, J. & Ripepe, M. Volcano infrasound: A review. J. Volcanol. Geoth. Res. 206, 61–69 (2011).
2. Fee, D. & Matoza, R. An overview of volcano infrasound: From hawaiian to plinian, local to global. J. Volcanol. Geotherm. Res. 2,
123–139 (2013).
3. Matoza, R. et al. Infrasonic jet noise from volcanic eruptions. Geophys Res Lett 2, 2–6 (2009).
4. Ripepe, M. et al. Ash-plume dynamics and eruption source parameters by infrasound and thermal imagery: The 2010 Eyjafjal-
lajökull eruption. Earth Planet. Sci. Lett. 2, 112–121 (2013).
5. Fee, D. et al. Eruption mass estimation using infrasound waveform inversion and ash and gas measurements: Evaluation at Sakura-
jima Volcano, Japan. Earth Planet. Sci. Lett. 2, 42–52 (2017).
6. Woulff, G. & McGetchin, T. R. Acoustic noise from volcanoes: Theory and experiment. Geophys. J. Int. 2, 601–616 (1976).
7. Taddeucci, J. et al. High-speed imaging, acoustic features, and aeroacoustic computations of jet noise from Strombolian (and
Vulcanian) explosions. Geophys. Res. Lett. 2, 3096–3102 (2014).
8. Goto, A., Ripepe, M. & Lacanna, G. Wideband acoustic records of explosive volcanic eruptions at Stromboli: New insights on the
explosive process and the acoustic source. Geophys. Res. Lett. 2, 3851–3857 (2014).
9. J. J. Peña Fernández, The compressible starting jet: Fluid mechanics and Acoustics, Technische Universität Berlin, 2018.
10. Tam, C. K., Viswanathan, K., Ahuja, K. K. & Panda, J. The sources of jet noise: experimental evidence. J. Fluid Mech. 2, 253–292
(2008).
11. Matoza, R. S., Fee, D., Neilsen, T. B., Gee, K. L. & Ogden, D. E. Aeroacoustics of volcanic jets: Acoustic power estimation and jet
velocity dependence. J. Geophys. Res. Solid Earth 118(12), 6284–6369 (2013).
12. Morris, P. J. & Viswanathan, K. Jet noise. Noise sources in turbulent shear flows: fundamentals and applications 119–196 (Springer,
Vienna, 2013).
13. Ishii, R., Fujimoto, H., Hatta, N. & Umeda, Y. Experimental and numerical analysis of circular pulse jets. J. Fluid Mech. 392, 129–153
(1999).
14. J. Teichter, Design of a shock tube, SP Measurement Technology, 2005.
15. Kopiev, V. F. Aeroacoustics of the vortex ring. Appl. Mech. Rev. 53, 195–205 (2000).
16. Ran, H. & Colonius, T. Numerical simulation of the sound radiated by a turbulent vortex ring. Int. J. Aeroacoust. 8, 317–336 (2009).
17. Bailly, C. & Bogey, C. Current understanding of jet noise-generation mechanisms from compressible large-eddy-simulations. In Direct
and Large-Eddy Simulation VI 39–48 (Springer, Dordrecht, 2006).
18. Norum, T. D. & Seiner, J. M. Broadband shock noise from supersonic jets. AIAA J. 2, 68–73 (1982).
19. Matoza, R. & Fee, D. The inaudible rumble of volcanic eruptions. Acoust. Today 14, 17–25 (2018).
20. J. Schulze, Adjoint based jet-noise minimization., Technische Universität Berlin, 2013.
21. Fernández, J. J. P. & Sesterhenn, J. Compressible starting jet: pinch-off and vortex ring–trailing jet interaction. J. Fluid Mech. 817,
560–589 (2017).
22. Kueppers, U., Perugini, D. & Dingwell, D. B. “Explosive energy” during volcanic eruptions from fractal analysis of pyroclasts. Earth
Planet. Sci. Lett. 2, 800–807 (2006).
23. Cigala, V. et al. The dynamics of volcanic jets: Temporal evolution of particles exit velocity from shock-tube experiments. J. Geophys.
Res. Solid Earth 2, 6031–6045 (2017).
24. J. Peña Fernández, V. Cigala, U. Kueppers and J. Sesterhenn, Sound emission from shock-tube experiments for volcanological inves-
tigations, GFZ Data Services, 2020.
25. I. Daubechies, Ten lectures on wavelets, in Society for industrial and applied mathematics, 1992.
26. Fernández, J. J. P. & Sesterhenn, J. Axial and radial dynamics of compressible vortex rings. Eur. J. Mech.-B/Fluids 76, 303–315
(2019).
27. Tam, C. K. W. Supersonic jet noise. Annu. Rev. Fluid Mech. 27, 17–43 (1995).
28. Gharib, M., Rambod, E. & Shariff, K. A universal time scale for vortex ring formation. J. Fluid Mech. 360, 121–140 (1998).
29. Swanson, E., Theunissen, R., Rust, A., Green, D. & Phillips, J. An experimental study of the flow structure and acoustics of jets:
Implications for volcano infrasound. J. Volcanol. Geoth. Res. 363, 10–22 (2018).
30. Alidibirov, M. & Dingwell, D. B. Magma fragmentation by rapid decompression. Nature 380, 146–148 (1996).
Acknowledgements
We thank the Technische Universität Berlin for allowing the usage of the anechoic chamber. We also thank the
laboratory staff Christian Westphal. We thank Julia Holzmüller and Steffen Nitsch for their help during the
preparation of the experiments. We thank Corrado Cimarelli for the insightful comments to the final draft of
this document. V.C. and U.K. acknowledge support from the VERTIGO Marie Curie ITN, funded through the
European Seventh Framework Programme (FP7 2007–2013) under grant agreement 607905. V.C. acknowledges
Scientific Reports | (2020) 10:13576 | https://doi.org/10.1038/s41598-020-69949-1 11
Vol.:(0123456789)www.nature.com/scientificreports/
support from the Deutsche Forschungsgemeinschaft with grant number CI306/2-1. We thank two anonymous
reviewers for their insightful comments.
Author contributions
U.K. and J.S. conceptualized the original idea; V.C. and U.K. managed the shock tube; J.J.P.F. and J.S. managed
the microphones and measured the signals; all authors processed and interpreted the data; all authors wrote the
original manuscript and thereby contributed to the study.
Competing interests
The authors declare no competing interests.
Additional information
Correspondence and requests for materials should be addressed to J.J.P.F.
Reprints and permissions information is available at www.nature.com/reprints.
Publisher’s note Springer Nature remains neutral with regard to jurisdictional claims in published maps and
institutional affiliations.
Open Access This article is licensed under a Creative Commons Attribution 4.0 International
License, which permits use, sharing, adaptation, distribution and reproduction in any medium or
format, as long as you give appropriate credit to the original author(s) and the source, provide a link to the
Creative Commons license, and indicate if changes were made. The images or other third party material in this
article are included in the article’s Creative Commons license, unless indicated otherwise in a credit line to the
material. If material is not included in the article’s Creative Commons license and your intended use is not
permitted by statutory regulation or exceeds the permitted use, you will need to obtain permission directly from
the copyright holder. To view a copy of this license, visit http://creativecommons.org/licenses/by/4.0/.
© The Author(s) 2020
Scientific Reports | (2020) 10:13576 | https://doi.org/10.1038/s41598-020-69949-1 12
Vol:.(1234567890)You can also read