Research Paper Effect Analysis of Loudspeaker's Placement Angle and Direction on Frequency Response and Sound Pressure Level in TV Applications
←
→
Page content transcription
If your browser does not render page correctly, please read the page content below
ARCHIVES OF ACOUSTICS
            Vol. 46, No. 1, pp. 79–85 (2021)
            DOI: 10.24425/aoa.2021.136562

                                                Research Paper

        Effect Analysis of Loudspeaker’s Placement Angle and Direction
     on Frequency Response and Sound Pressure Level in TV Applications

                                                 Ibrahim DEMIREL
                                           Arçelik AŞ., Electronics HW Design
                                       Turkey; e-mail: ibrahim.demirel09@gmail.com
                                  (received February 27, 2020; accepted August 27, 2020)

           In a television, obtaining a good acoustic response is a challenging issue because of slim mechanical
        structures. The area dedicated for speaker’s placement is limited and inadequate space inside the cabinet
        of a TV prevents possible solutions to increase the sound performance. In addition, frame of the TV’s
        is getting narrower as the customers searching for the highest screen to body ratio. These designing
        aspects restrain optimal speaker positioning to achieve good sound performance. In this paper, an analysis
        related to speaker’s placement and mounting angle is proposed. A rotation setup compatible with a TV
        was prepared to measure different facing position of the speaker. This paper proposes the analysis of
        speaker’s rotation and facing direction in a flat panel television and its effects on sound pressure level
        together with deviation of the acoustic response. Measurement results are analyzed with an audio analyzer
        together with a statistics tool to achieve precise results.
        Keywords: acoustic transducers; frequency measurement; frequency response; loudspeakers.

                    1. Introduction                                First approach of these studies is new loudspeaker
                                                               structures. A different speaker structure available for
     In recent televisions (TVs), placement of the speak-      flat panel TV was proposed in which a planar voice coil
ers is problematic because of the mechanical slimming          and a sandwich-type magnetic circuit are used for de-
trend. The main reason for this problem is a loud-             sign (Bai et al., 2008). A novel flat loudspeaker which
speaker’s requirements for sound reproduction. Speak-          uses dielectric elastomer actuators with natural rubber
ers are electro-mechanical components and require vo-          for the elastomeric layers and metal electrodes as trans-
lume to be placed in the cabinet. They need air in-            duction mechanism was introduced in another study
side/outside the cabinet to produce the sound. Large           (Rustighi et al., 2018). Proposed novel loudspeaker
sized speakers are not suitable for slim panels due to         structures are successful in acoustic results, but they
their dimensions. Slim speakers are mostly the solu-           may cause some problems for commercial applications
tion for slim panel structures but they have insuf-            due to their complicated structure. Furthermore, uti-
ficient diaphragm surface and it has a negative im-            lizing the technology behind ultrasonic capacitance
pact on the sound quality such as low sound pres-              transducers, a radically new loudspeaker concept was
sure level, unbalanced frequency responses, ineffective        developed (Medley et al., 2019), which resulted in
representation of low frequency areas and potential            the creation of an ultra-thin loudspeaker. In extension
mechanical resonance problems. To optimize adverse             to above explained studies, a piezo based thin speaker
effects of slimming trend, in other words, limited area        array study was proposed as a novel structure (Been
problem in television cabinets, there have been dif-           et al., 2015). This study proposes a speaker structure
ferent studies in literature. The focus of these litera-       suitable for limited dimensions but not very applica-
ture studies has been on primary aspects of creating           ble for high quantity commercial products. Zhu et al.
a good sound which are the most efficient speaker de-          (2003) also proposes experimental results of a panel
sign and sound performance.                                    distributed speaker constructed by small actuators.
     There are different approaches to find a solution         Another slim speaker models for flat devices are de-
to a limited mounting area problem for loudspeakers.           scribed in (Sun et al., 2012; Kwon et al., 2007). There
After studying prior researches, these studies are cate-       are varieties of studies which focus on space limit prob-
gorized in two groups: new speaker structures and dis-         lem and recommend different solutions by means of
tortion elimination methods.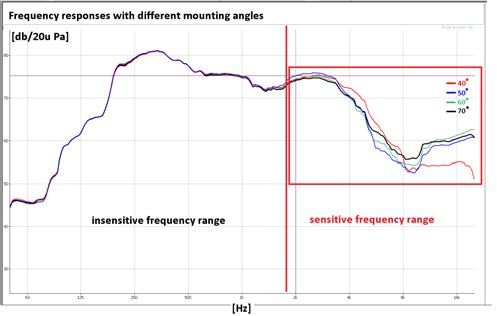
80                                 Archives of Acoustics – Volume 46, Number 1, 2021

mechanically slim loudspeaker unit with the combina-         and novel methods and studies for improving loud-
tion of novel structures (Satoh et al., 1997; Hwang          speaker characteristics were presented in many re-
et al., 2005; Zhu et al., 2003). Micro or slim speaker       search (Pawar et al., 2012; Bai et al., 2008; Kim
structures are a solution to low space problem which         et al., 2009; Lee, Hwang, 2011; Merit, Lemar-
is the result of electronic devices mechanical design.       guand, 2008). A psycho-acoustic bass technique can
Above mentioned novel speaker solutions are proposed         also significantly improve the low frequency perfor-
to solve mechanical limit problems. On the other hand,       mance of a loudspeaker and can be used to increase
novel structures of loudspeaker are not effective enough     frequency reproduction without distortion (Gan et al.,
to solve performance problems, especially on low fre-        2001). This technique doesn’t increase the cost and it
quencies (Lee et al., 2010; Satoh et al., 1997; Hwang        is effective and successful for slim structures. Due to
et al., 2005; Klippel, 2005a; 2005b), and slim and           that it produces bass voices as virtual ones it achieves
rectangular shaped loudspeaker units have the prob-          good bass sound but can have an adverse effect on the
lem of non-linearity and distortion (Bai et al., 2008;       frequency balance because of the artificial effects ap-
Been et al., 2015; Klippel, 2005). Distortion level          plied to the signal.
of a speaker is critical for sound performance. Sound            Above-mentioned studies and literature work have
performance is quite important and should be care-           been proposed for neutralizing the negative effect of
fully studied to improve acoustics and naturally there       small sized speaker structures which is a result of slim-
are different studies with the aim of optimizing dis-        ming trend on the electronic devices. All these studies
tortion level. As a summary of literature work men-          are focused on increasing efficiency of a loudspeaker to
tioned above, these studies propose novel loudspeaker        emerge a positive effect to perception of hearing. On
structures as a solution to slimming trend but effects       the other hand, design limitations such as mounting
of placement or facing direction of these loudspeakers       conditions or placement of a speaker together with the
are not studied to extend these analyses.                    availability for mass production, have undesired im-
    On the other hand, the emergence of new speaker          pact on these proposed solutions and decrease their
structures has become the basis for focusing on har-         efficiency. Above discussed literature studies do not
monic distortion problems and solutions. The loud-           contain the analysis of loudspeakers positioning and
speaker converts electrical signals to pressure signals.     mounting scenarios in a limited space and none of them
When this situation happens, total harmonic distor-          used statistical approach to precisely determine effi-
tion (THD) occurs. A comparison of different speaker         ciency level.
enclosures with the analysis and results of distortion,          In this paper, an efficiency improvement study is
lower total harmonic, intermodulation, and transient         proposed. To understand and achieve the best effi-
distortion was proposed in (Novak, 1959). To have            ciency point for sound reproduction, different place-
further knowledge about distortion, sound pressure           ment angles are applied to a loudspeaker which is com-
level efficiency and eliminating nonlinearities, different   patible with TV sets and an effect analysis of these po-
studies and designs for loudspeakers/enclosures were         sitioning scenarios is analyzed with a statistics tool and
proposed in the literature as well (Nakajima et al.,         results of this work are released. This paper presents
2015; Christensen, Olhoff, 1998; Jaskula, Mic-               the effect of the mounting angle of a speaker on the
kiewicz, 2013; Hwang et al., 2002; Aerts et al., 2009;       sound pressure level (SPL), critical angle values to
Ravand et al., 2009; 2010; Ouaegebeur, Chaigne,              achieve an effective frequency curve together with an-
2008; Kitagawa, Kajikawa, 2009; Cruz, Martinez,              gle sensitive frequency range. In Sec. 2 loudspeaker
2014). Sound performance of a loudspeaker with en-           placement considerations for TV sets are discussed.
closure and the theory of wave diffraction in the enclo-     Details of the experimental setup and measurement
sure was also presented to understand the distortion         results are presented in Sec. 3. Section 4 gives the con-
(Dobrucki, 2006).                                            clusion.
    Another field of study is the optimization of loud-
speaker characteristics such as achieving lower har-
                                                              2. Speaker placement and perceptual approach
monic distortion, improvement of non-linear param-
eters and mechanical inconsistencies. Mechanical reso-           Most of the televisions need to be slim and well-
nances and non-linearities affect a loudspeaker’s be-        shaped because of the consumer market’s need for
haviour and should be precisely optimized. Pawar             smart looking designs and evolution of the technol-
et al. (2012) illustrated improved effect of diaphragm       ogy. A good-looking design is a decision factor when it
tracks on the sound pressure levels and THD re-              comes to buying an equipment in most cases. In a tele-
sponse of elliptical miniature loudspeaker. According        vision, there are some parts that critically affect the
to the measurement results in the anechoic chamber,          TV’s mechanical concept such as mainboard, power
diaphragm tracks has no visible effect on sound pres-        supply unit and speakers. These functions should be
sure level, but it has effect on total harmonic distor-      designed very carefully for optimum performance and
tion. Different items of a loudspeaker were studied          speakers are the critical components which need free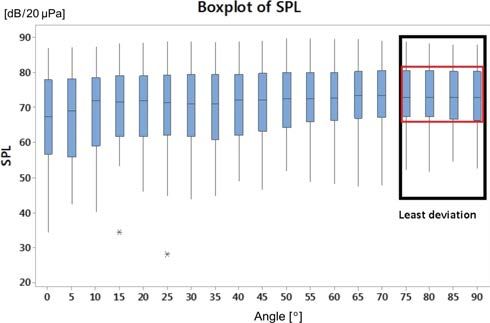
I. Demirel – Effect Analysis of Loudspeaker’s Placement Angle and Direction. . .                   81

space on the back cover due to physical requirement           attached to TV cabinet to guide sound waves based on
of producing sound. Sound is the outcome of pressure          reflection rules. All these solutions are effective and
variations and it needs a carrier for propagation like        have significant effect on sound quality improvement,
the air in front of the vibrating surface of the speaker      but they are all cost dependent and need additional
or free air in the back cover of the TV. Dimensions           structures or components to be implemented in TV
of a speaker’s transducer determine how much air it           sets productively.
will oscillate. Bigger sized speakers generally produce            Expected ideal frequency curve from a sound pro-
better acoustic pressure because of higher amplitude          ducing equipment is the absolute flatness but obtain-
they can create. But nowadays slimming trend in elec-         ing this flatness level is a very difficult issue. Because
tronics limits the area for placing the speakers which        of speaker unit’s non-ideal conditions, complicated re-
means a use of limited surfaced smaller speaker struc-        sponse of the enclosure which the speaker unit sealed
tures and as a result lower SPLs. In addition to this,        in, mechanical resonances in the units/enclosure,
using smaller speakers is not a sole solution because         placement and mounting structures of the speakers
of another visual parameter of a TV. Most of the cus-         cause peaks and dips on the frequency response curve.
tomers seek for the highest screen to body ratio so           Decreasing the deviation of frequency response down
bezels of the TV’s should be as slim as possible. Fi-         to ± 3 dB range is a reasonable aim for optimizing but
gure 1 shows the comparison between a front-firing            it is not easy to achieve also. Figure 2 shows exemplary
TV with a thick low side bezel which is used to place         comparison of an adjusted frequency curve with mini-
the speakers and a down-firing TV with high screen to         mum deviation and non-ideal frequency curve with the
body ratio. Borderless designs prevent placing speakers       large fluctuations which belongs to a TV with 25 mm
directly facing towards the customer and for this rea-        width. As shown in Fig. 2 the transition of low, middle
son speakers are positioned as down fired. In down fired      and high frequency sections is smooth in the adjusted
position there are some reflections because of the an-        curve and as a result the TV sounds more natural
gle and these reflections may have a negative effect on       and balanced because loudspeakers are able to play all
the uniformity of frequency response. It causes fluctu-       tones correctly and in a convenient proportion to each
ations on the frequency response and decrease SPL for         other. For most people ±3 dB is the perceivable limit.
the listening position and may further affect peak/dip        If the deviation on the frequency response increases,
transition on the frequency response which are neces-         human ear detects fluctuation as a noise and it is per-
sary criteria for tuning and sound performance.               ceived as unnatural. High SPL and minimum deviation
                                                              on the frequency curve are the two key parameters for
                                                              a good sound performance but due to recent slimming
                                                              trend in consumer electronics and above- mentioned
                                                              technical aspects, achieving these criteria is quite dif-
                                                              ficult.

Fig. 1. Comparison of front firing structure vs down firing
structure, variation of screen to body ratio with different
                      bezel structures.

    Also, there are other solutions to optimize sound
quality in limited mounting dimensions such as ap-
plying mechanical enclosures to seal the air inside the
speaker enclosure and prevent acoustic shortcut be-
tween front and back of the diaphragm or use of bass
reflex structures to extend bass response of a loud-
speaker. Using special transducers like tweeters to re-
produce high frequency area or using passive radiator
driver to create resonance with the loudspeaker to in-
crease low frequency response without using bass ports
are other exemplary solutions to limited space problem        Fig. 2. Frequency curve comparison example, indication of
in TV structures. Multiple firing (back/down/front)                             large/small deviations.
options with more than one loudspeaker in a complete
speaker set are also another way to increase sound               In this paper, an analysis of a speaker structure
quality. One of other method is to use mechanical parts       with different installation angles is proposed. TV com-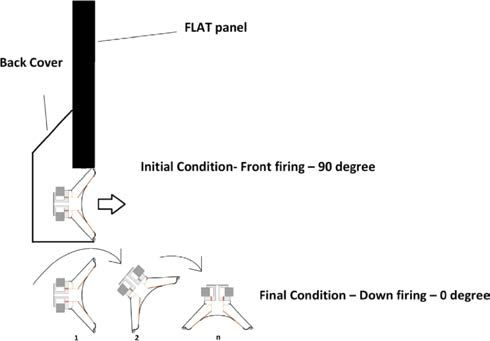
82                                  Archives of Acoustics – Volume 46, Number 1, 2021

patible speaker unit is placed as front-fired as an initial   TV’s center point. Center point of the TV’s screen was
condition and rotated from initial condition to down-         selected as a reference point because nowadays there
fired position. The rotation is achieved with a mechan-       are variety of tv unit furniture with different height
ical apparatus connected to a TV cabinet and spinning         levels. It is difficult to estimate elevation of tv stands
steps are executed as 5°in each turn. In every position       and customer’s body position and for this reason mid-
steady state response of the speaker unit is measured         dle point of the screen was assumed as a reference
from 1m distance. After the measurement stage, fre-           point.
quency curves are observed to find the critical place-            After measuring initial condition, speakers are ro-
ment position which proposes the best SPL and mini-           tated with 5○ increment. On every rotation, back cover
mum curve deviation. Also angle dependent frequency           and the mounting point of speakers are optimized due
ranges are determined with a comparative analysis us-         to mechanical changes caused by the rotation. Mea-
ing the frequency responses of the speaker. This paper        surement results are obtained till reaching the final
presents the effect of the installation angle of a speaker    condition which is the down-firing situation. On the
on the SPL, critical points to achieve the best fluctua-      measurement results initial condition is expressed as
tion together with the angle sensitive frequency range.       90○ and the final condition is defined as 0○ . Figure 4
The measurements were made by using high precision            shows the rotation steps and initial/final conditions.
audio analyzer with an omnidirectional microphone.
A semi-anechoic room suitable to NC25 room criteria
was used for the measurement environment.

                    3. Experiments
 3.1. Experiment setup and measurement condition

    Slim structure’s effect and limitations to sound re-
production was discussed in Sec. 2. To understand the
effect of speaker’s positioning, an experimental setup
was implemented. Figure 3 shows the simplified mea-
surement setup (sideview). As an initial condition,
a flat TV with front-fired speaker was used. The back
cover and mechanical mounting points were set accord-
ing to front-firing structure. The TV was tested on
a stand and the distance between the stand and the              Fig. 4. Rotation steps and initial and final conditions.
low side of the back cover was determined as 50 mm.
43′′ TV was used for experiment and volume of the
back cover was approximately 10 liters. SPL and fre-              The measurements results were acquired in a semi-
quency responses were measured 1m distance from the           anechoic room. To simulate the listening environment
                                                              from the point of TV customers some reflective ma-
                                                              terials like stand and back wall are located inside the
                                                              measurement environment. Brüel & Kjær (B&K) type
                                                              4191 high precision 1/2 inch omnidirectional micro-
                                                              phone is used for frequency measurement. Reflections
                                                              and diffractions can cause pressure increase in front
                                                              of microphone diaphragm especially at higher frequen-
                                                              cies. Free field microphone is selected for optimizing
                                                              adverse effect of reflections and diffractions. Measure-
                                                              ment results are achieved by using commercial analysis
                                                              software for noise and vibration (B&K PULSE 7700)
                                                              together with B&K 3560C signal analyzer. A 500 mV
                                                              stepped sweep signal is applied as the input signal. The
                                                              output response of the TV speakers is obtained by mi-
                                                              crophone and signal analyzer and PULSE program is
                                                              used for further analysis. Individual calibration data
                                                              of the microphone is inserted to the analyzer system
                                                              for correction of measurement results. The summary
                                                              of the measurement conditions and speaker parame-
     Fig. 3. Simplified measurement setup (sideview).         ters are shown in Table 1.
I. Demirel – Effect Analysis of Loudspeaker’s Placement Angle and Direction. . . 83
Table 1. Experiment equipment and conditions.
Equipment & condition
Resonance frequency of the speaker 180 Hz
Speaker diaphragm diameter 19 × 153 mm rectangular shape
Audio Analyzer B&K 3560c with PULSE Software
Impedance of the speaker 8Ω
Nominal power of the speaker 10 W
Audio amplifier Digital amp with 20 W output for each channel
Room noise criteria NC25
Measurement distance 1m
Frequency range of the speaker 180 Hz – 20 kHz
Microphone B&K 4191 omnidirectional 1/2 free field mic
Microphone sensitivity 12.5 mV/Pa
Microphone frequency 3.15 Hz – 40 kHz
3.2. Experiment results looking at a frequency response curve, it is not easy to
figure out sound pressure level variations correspond-
From initial condition to 0○ , speakers were rotated ing to different angles. From 1.6 kHz to 20 kHz, which
with 5○ alternation and at each angle value frequency is the main frequency area of angle effect, there are lots
response of the TV was measured. Figure 5 indicates of frequency and SPL values. MINITAB has the func-
comparative frequency responses of different angled se- tion of calculating the standard deviation and mean
tups. From the results it was measured that the rota- level of angle dependent SPL data values for effective
tion is effective on high-mid/high frequency range and frequency range. Also, it has the feature of comparing
it is measured that 1600 Hz is the critical point for them as a unitary data set. In the frequency-weighted
proposed angle values. Because of wavelength of low- evaluation of the variation in pressure levels caused by
low/mid frequencies, the curves of different angles were the angle change, the statistical approach and calcula-
not affected by the reflection significantly. For 1.6 kHz tion method give us more precise results. ANOVA test
to 20 kHz frequency range, the results and the devia- function of the statistical tool was used for this ana-
tions are apparent and SPL values on this pitch were lysis. ANOVA is a statistical test method which helps
used for further analysis. us to determine whether there is a difference between
data sets, in our study which is a combination of SPL
and frequency in each angle value, also shows us what
is the level of difference of these compared data. Figu-
res 6 and 7 are generated with the help of statistical
tool.
Fig. 5. Frequency responses with different angles.
Frequency sound pressure levels were converted
to numbers in each frequency and for a comparative
analysis a table was formed by using the values from
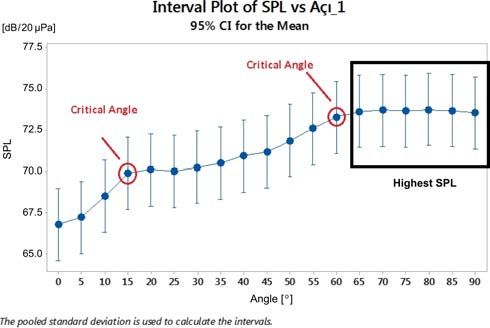
the frequency curves. To calculate the highest SPL and Fig. 6. Average SPL with incremental angle values.
lowest deviation precisely, commercial statistics tool
MINITAB was used with the input values of SPL, fre- Figure 6 indicates the average SPL with incremen-
quency and angle of the measurement setup. By simply tal angle values. From the results it is obvious that 60○84 Archives of Acoustics – Volume 46, Number 1, 2021
to measurement results conclusion of this study can
be acceptable and extended to special drivers like high
frequency dedicated loudspeakers in consideration of
measured sensitive frequency range.
4. Conclusion
This paper proposes the analysis of speaker’s rota-
tion and facing direction in a flat panel television and
its effects on sound pressure level together with de-
viation of the acoustic response. Flat TV dedicated
experimental setup is established for this purpose.
Measurement and analysis results were obtained and
presented by using a high precision audio analyzer with
Fig. 7. Least deviation of a frequency response, measured
at different angles.
further help of an assistant statistics tool for accurate
evaluation. The effective frequency range which is de-
pendent to angle change is determined by using the
point is the breakdown area. Before that area the SPL output frequency responses. Also, the impact of the an-
average is the highest and has a uniform distribution. gle on sound pressure level and frequency deviations
But after the breakdown point the average of the SPL are examined. The breakdown points related to the
is decreasing almost linearly. A high SPL means that angle change are acquired. Facing direction of a TV
less power can be applied to the speaker and it results speaker can be optimized by using these results and
as low distortion. discussions. It should be also noted that other main
Another critical point is the 15○ rotation. Down- criterion for sound quality is the room and its char-
firing is defined as 0○ and its effects can be clearly acteristics. Propagation of the sound waves is directly
seen in Fig. 6. The lowest SPL occurs at 0○ . But a 15○ relevant to room structure. Room acoustics will have
rotation have a good SPL average in comparison to profound effect on the sound. Reflections, reverbera-
the highest levelled angles. It can be expressed that tions, spatialization may have different impact on hu-
in a down-firing positioned TV, a 15-degreed rotation man hearing perception. These room dependent fea-
to the front can be very positive for the sound per- tures are not examined in this study to focus further
formance. As discussed before ANOVA test is meant of a single loudspeaker’s primary characteristics. In fu-
to calculate variations of a data set. If the variation in ture studies, these major components in relevant to
sound pressure levels corresponding to angle/frequency room acoustics should be studied in suitable acous-
range combination is small, it means SPL is not vary- tic environment. Joint evaluation of speaker and room
ing for related angle value and it includes the fea- parameters would be a key point to achieve improved
ture of flatness, which is a key parameter to a ba- sound quality.
lanced sound response. If the variation is big, it refers
to a non-balanced frequency response and it is nega- References
tive for sound reproduction as discussed in previous
sections. From measurement results as boxplots which 1. Aerts J.R.M., Dirckx J.J.J., Pintelon R. (2009),
can be seen in Fig. 7, minimum variation in frequency Measurement of nonlinear distortions in the vibration
response also signifies the mean, upper and lower va- of acoustic transducers and acoustically driven mem-
lues of frequency responses are in a narrow axis and branes, Optics and Lasers in Engineering, 47(3–4):
419–430, doi: 10.1016/j.optlaseng.2007.12.010.
it is called least deviation in our study. Least devia-
tion is measured at 90-85-80-75 degrees. Further ro- 2. Bai M.R., Liu C.Y., Chen R.L. (2008), Optimiza-
tion of microspeaker diaphragm pattern using com-
tations increase the peak/dip amplitude in the fre-
bined finite element-lumped parameter models, IEEE
quency response and deviation starts to increase. Body
Transactions on Magnetics, 44(8): 2049–2057, doi:
of the boxplots (red marked area) in Fig. 7 shows the 10.1109/TMAG.2008.923316.
smallest deviation and the pin bars shows the deviation
3. Been K.H., Je Y.U.B., Lee H.S., Moon W.K.
range’s limits. Smallest deviation leads to balanced fre- (2015), A parametric array PMUT loudspeaker with
quency response and it is easier for sound adjustment high efficiency and wide flat bandwidth, 2015 Trans-
and helps a lot to create better hearing cases. ducers – 2015 18th International Conference on Solid-
The main purpose of this study is to understand an- State Sensors, Actuators and Microsystems (TRANS-
gle and frequency response relation. From the results it DUCERS), Anchorage, AK, pp. 2097–2100, doi:
can be observed that high frequency range is sensitive 10.1109/TRANSDUCERS.2015.7181371.
to angle. All measurement results are made with a con- 4. Christensen S.T., Olhoff N. (1998), Shape opti-
ventional loudspeaker driver. Additionally, according mization of a loudspeaker diaphragm with respect toI. Demirel – Effect Analysis of Loudspeaker’s Placement Angle and Direction. . . 85
sound directivity properties, Control and Cybernetics, 17. Lee C.H., Kwon J.H., Kim K.S., Park J.H.,
27(2): 177–198. Hwang S.M. (2010), Design and analysis of micros-
peakers to improve sound characteristics in a low fre-
5. Cruz A., Martinez M.H. (2014), Frequency band
quency range, IEEE Transactions on Magnetics, 46(6):
displacement for optimizing acoustic boxes above the
2048–2051, doi: 10.1109/TMAG.2010.2042793.
natural frequency of the loudspeaker, 2014 XIX Sym-
posium on Image, Signal Processing and Artificial Vi- 18. Medley P., Billson D.R., Hutchins D.A., Davis A.J.
sion, Colombia. (2019), A new design of thin and flexible loudspeaker,
University of Warwick, UK.
6. Dobrucki A. (2006), Diffraction correction of fre-
quency response for loudspeaker in rectangular baffle, 19. Merit B., Lemarguand G. (2008), Ironless low fre-
Archives of Acoustics, 31(4): 537–542. quency loudspeaker working under its resonance fre-
quency, Archives of Acoustics, 33(4): 59–64.
7. Gan W.S., Kuo S.M., Toh C.W. (2001), Virtual
bass for home entertainment, multimedia PC, game 20. Nakajima H., Sakata N., Hashiro K. (2015), Non-
station and portable audio systems, IEEE Transac- linear distortion reduction for a loudspeaker based on
tions on Consumer Electronics, 47(4): 787–796, doi: recursive source equalization, 2015 IEEE International
10.1109/30.982790. Conference on Acoustics, Speech and Signal Process-
ing (ICASSP), Brisbane, Australia, pp. 281–285, doi:
8. Hwang G.Y., Kim H.G., Hwang S.M., Kang B.S. 10.1109/ICASSP.2015.7177976.
(2002), Analysis of harmonic distortion due to un-
21. Novak J. (1959), Performance of enclosures for low-
even magnetic field in a microspeaker used for mobile
resonance high-compliance loudspeakers, IRE Trans-
phones, IEEE Transactions on Magnetics, 38(5): 2376–
actions on Audio, AU-7(5): 5–13, doi: 10.1109/TAU.
2378, doi: 10.1109/TMAG.2002.803579.
1959.1166180.
9. Hwang S.M., Kwon J.H., Hong K.S. (2005), De-
22. Ouaegebeur N., Chaigne A. (2008), Mechanical
velopment of woofer microspeakers used for cellu-
resonances and geometrical nonlinearities in electrody-
lar phones, IEEE Transactions on Magnetics, 41(10):
namic loudspeakers, Journal of the Audio Engineering
3808–3810, doi: 10.1109/TMAG.2005.854928.
Society, 56(6): 462–472.
10. Jaskula M., Mickiewicz W. (2013), The effect 23. Pawar S.J., Weng S., Huang J.H. (2012), Total
of lowering the resonant frequency of the loud- harmonic distortion improvement for elliptical minia-
speaker during impedance measurement as a func- ture loudspeaker based on suspension stiffness nonlin-
tion of the signal power, 18th International Confer- earity, IEEE Transactions on Consumer Electronics,
ence on Methods & Models in Automation & Robotics 58(2): 221–227, doi: 10.1109/TCE.2012.6227416
(MMAR), Miedzyzdroje, Poland, 2013, pp. 701–704,
doi: 10.1109/MMAR.2013.6669997. 24. Ravaud R., Lemarguand G., Lemarguand V.
(2010), Ranking of the nonlinearities of electrodynamic
11. Kim W., Jang G.W., Kim Y.Y. (2010), Micros- loudspeakers, Archives of Acoustics, 35(1): 49–66.
peaker diaphragm optimization for widening the op-
erating frequency band and increasing sound pressure 25. Ravaud R., Lemarguand G., Roussel T. (2009),
level, IEEE Transactions on Magnetics, 46(1): 59–66, Time-varying non-linear modeling of electrodynamic
doi: 10.1109/TMAG.2009.2025271. loudspeakers, Applied Acoustics, 70(3): 450–458, doi:
10.1016/j.apacoust.2008.05.009
12. Kitagawa S., Kajikawa Y. (2009), Dynamic distor-
26. Rustighi E., Kaal W., Herold S., Kubbara A.
tion measurement for linearization of loudspeaker sys-
(2018), Experimental characterisation of a flat dielec-
tems, 2008 International Symposium on Intelli-
tric elastomer loudspeaker, Actuators, 7(2): 28, doi:
gent Signal Processing and Communications Systems,
10.3390/act7020028.
Bangkok, Thailand, 2009, pp. 1–4, doi: 10.1109/ISPACS.
2009.4806674. 27. Satoh K., Takewa H., Iwasa M., Kikkawa T.
(1997), A high fidelity small-sized loudspeaker, IEEE
13. Klippel W. (2005), Loudspeaker nonlinearities – Transactions on Consumer Electronics, 43(3): 972–
causes, parameters, symptoms, 119th Audio Engineer- 979, doi: 10.1109/30.628776.
ing Society (AES) Convention, USA.
28. Sun P., Park J.H., Kwon J. H., Hwang S.M.
14. Klippel W. (2005), Large signal performance of (2012), Development of slim speaker for use in flat TVs,
tweeters, micro speakers and horn drivers, 118th Audio IEEE Transactions on Magnetics, 48(11): 4148–4151,
Engineering Society (AES) Convention, Spain. doi: 10.1109/TMAG.2012.2197676.
15. Kwon J.H., Hwang S.M., Kim K.S. (2007), Deve- 29. Takewa H., Saiki S., Kano S., Inaba A. (2006),
lopment of slim rectangular microspeaker used for min- Slim-type speaker for flat panel televisions, IEEE
imultimedia phones, IEEE Transactions on Magnetics, Transactions on Consumer Electronics, 52(1): 189–
43(6): 2074–2706, doi: 10.1109/TMAG.2007.893784. 195, doi: 10.1109/TCE.2006.1605046.
16. Lee C.M., Hwang S.M. (2011), Optimization of 30. Zhu H., Rajamani R., Dudney J., Stelson K.A.
SPL and THD performance of microspeakers consider- (2003), Active noise control using a distributed mode
ing coupling effects, IEEE Transactions on Magnetics, flat panel loudspeaker, ISA Transactions, 43(3): 475–
47(5): 934–937, doi: 10.1109/TMAG.2010.2089502. 484, doi: 10.1016/S0019-0578(07)60148-7.You can also read