Molecularly imprinted membrane for transport of urea, creatinine, and vitamin B12 as a hemodialysis candidate membrane
←
→
Page content transcription
If your browser does not render page correctly, please read the page content below
Open Chemistry 2021; 19: 806–817
Research Article
Muhammad Cholid Djunaidi*, Nabilah Anindita Febriola, Abdul Haris
Molecularly imprinted membrane for transport
of urea, creatinine, and vitamin B12 as a
hemodialysis candidate membrane
https://doi.org/10.1515/chem-2021-0069
received March 28, 2021; accepted June 17, 2021
1 Introduction
Abstract: High levels of urea and creatinine in the blood Chronic kidney disease is becoming more common in
are a sign of decreased kidney function. To remove these every part of the world with an estimated prevalence of
substances from the blood, hemodialysis which utilizes 5–15% throughout the world [1]. Chronic kidney failure is
membranes could be used. In this study, a molecularly a progressive and irreversible disorder in the kidney
imprinted membrane (MIM) was synthesized for the selec- function in which the body’s ability to maintain fluid
tive transport of urea. The synthesis is initiated with the and electrolyte balance and metabolic waste excretion
polymerization of eugenol into polyeugenol and then into is lost, ultimately leading to uremia (retention of urea
polyeugenoxy acetate (PA). The PA is then contacted with and other nitrogenous wastes in the blood) [2]. Renal
urea and then used as the functional polymer in the synth- disease or chronic renal failure is a progressive renal
esis of MIM with polysulfone as the membrane base, and
damage which is fatal and characterized by uremia and
polyethylene glycol as the cross-linking agent. The result
may lead to complications or even to a kidney transplant
was later analyzed with FTIR and SEM-EDX. The mem-
[3] if hemodialysis is not carried out.
brane is then used in the transport of urea, creatinine,
Hemodialysis utilizes a semipermeable membrane to
and vitamin B12 and then compared with the non-imprinted
remove unwanted nitrogenous wastes from the blood.
membrane (NIM) performance. By using UV-Vis spectro-
Molecular transport process using a membrane is not
photometry, the results showed that the membrane with
only determined by the membrane’s pore size but also
10 h heating variation is able to transport more urea and is
by the presence of reactive groups on the membrane
more selective than NIM; this proves that the urea template
that activate the interaction between the membrane and
on the MIM enables it to recognize urea molecules better
the target compound to occur. Furthermore, the membrane
than creatinine and vitamin B12. The order of transport from
used for hemodialysis needs to have high permeability that
the best results is urea > creatinine > vitamin B12.
means it needs to be able to transport metabolite as fast as
Keywords: polyeugenoxy acetate, urea, molecularly imprinted possible [4].
membrane, selectivity In this research, we utilize molecularly imprinted
membrane (MIM) to transport urea and compare its ability
with creatinine and vitamin B12 transport. MIM is a mem-
brane that has molecular recognition abilities due to its
template that is achieved through cross-linking the func-
tional polymer and the target molecule. The target mole-
cule is later removed from the membrane, forming a cavity
with correct shape and orientation of functional groups
that serves as the template binding area for selective
* Corresponding author: Muhammad Cholid Djunaidi, Department recognition [5]. Molecular imprinting material has some
of Chemistry, Faculty of Science and Mathematics, Diponegoro advantages such as high stability and specificity [6].
University, Jl. Prof. H Soedarto SH, Semarang, 50275, Indonesia,
Imprinted material has greater flexibility in selecting
e-mail: choliddjunaidi@live.undip.ac.id
Nabilah Anindita Febriola, Abdul Haris: Department of Chemistry,
the appropriate functionalities due to the availability of
Faculty of Science and Mathematics, Diponegoro University, Jl. Prof. a large amount of polymerizable compounds [7]. Djunaidi
H Soedarto SH, Semarang, 50275, Indonesia et al. synthesized a molecularly imprinted polymer using
Open Access. © 2021 Muhammad Cholid Djunaidi et al., published by De Gruyter. This work is licensed under the Creative Commons
Attribution 4.0 International License.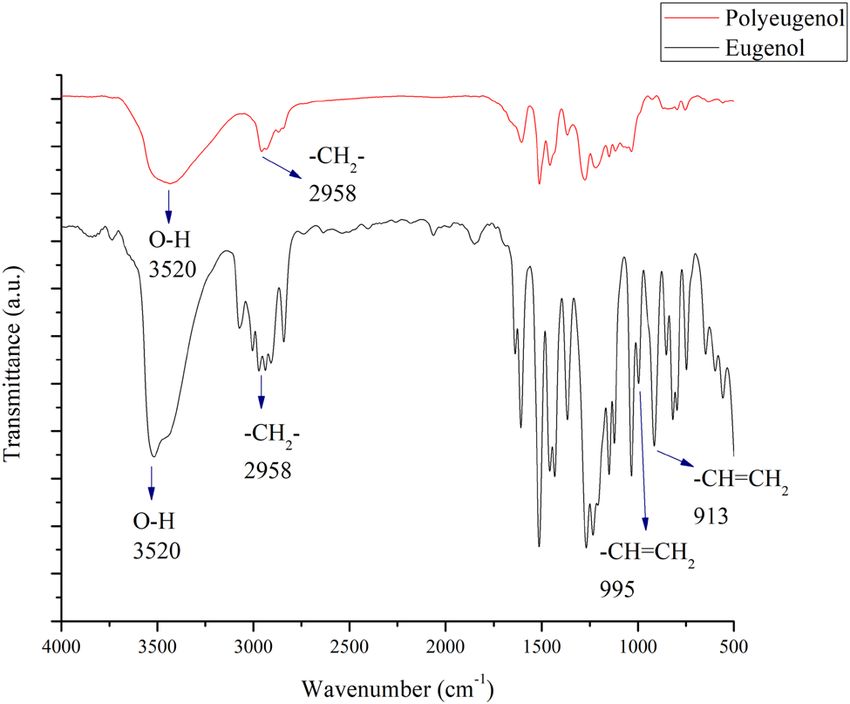
MIM for transport of urea, creatinine, and vitamin B12 807
polyeugenol as the functional polymer to achieve a urea- volumetric flask. Afterward, pH measurement was carried
selective adsorbent [8]. Other previous studies that uti- out using a pH meter to obtain a pH of 7.4.
lized imprinting method used poly(methyl methacrylate)
as the functional polymer to synthesize a non-enzymatic
urea sensor, 3,4-ethylenedioxythiophene monomer, for
the synthesis of electrochemical urea sensor, and methacrylic
2.3 Tools and instruments
acid as the monomer for diisopropylurea recognition
Laboratory equipment glass (Herma dan Pyrex), reflux,
[9–11].
analytic scale (Mettler-200), magnetic stirrer, hot plate,
One of the potential compounds to be used as the
SEM-EDX (Jeol Jsm 6510 La), thickness meter (Digilife),
functional polymer in MIM is eugenol-based polymer.
pH meter (HACH E C20), UV-Vis spectrophotometry (LW-
Previous research has showed the promising potential
V-200-RS), and FT-IR (Shimadzu Prestige 21) were used
of eugenol derivatives such as polyeugenol, polyeugenol
in this study.
sulfonate, and polyeugenoxy acetyl thiophene methano-
late for the separation of gold and other metals [12–14].
Eugenol is suitable for the synthesis of a new compound
that is more reactive; this is due to the allyl, hydroxyl, 2.4 Synthesis of polyeugenol
and methoxy groups present in eugenol [15,16]. Through
the allyl group, eugenol can be polymerized into polyeu- Into a three-necked flask, 5.8 g of eugenol (0.035 mol)
genol, while through the hydroxyl group, a carboxylic was added with BF3-diethyl ether catalyst as much as
compound of polyeugenoxy acetate (PA) can be synthe- 0.25 mL each hour for the next 4 h while being stirred.
sized. PA has an active group of –COOH which can be The polymerization reaction was done for 12–16 h under
used as a carrier compound in selective transport [17]. PA room temperature and pressure and then it was stopped
will be used as the functional polymer in this research, by adding 1 mL of methanol. It then turned into a gel form
combined with polysulfone and polyethylene glycol for which was later dissolved with chloroform and washed
the synthesis of MIM. with aquabidest until it reached a neutral pH. The solu-
tion was then added with anhydrous Na2SO4 and then let
to evaporate at room temperature until it hardened. The
2 Materials and methods precipitate formed was weighed and analyzed by FTIR.
2.1 Materials 2.5 Synthesis of PA
Eugenol p.a. (Merck), chloroform p.a. (Merck), BF3O(C2H5)2 As much as 5 g of polyeugenol (0.03 mol) was added with
(Sigma Aldrich), diethyl ether p.a. (Merck), anhydrous 17.5 mL of 33% NaOH (0.144 mol) in a three-necked flask.
Na2SO4 p.a. (Merck), Aqua demineralized, HCl (Merck), poly- The mixture was then stirred for 30 min and slowly added
sulfone Mw 35.000 (Sigma Aldrich), methanol p.a. (Merck), with 12.5 mL of 50% chloroacetic acid (0.066 mol) while
1-methyl-2-pyrolidone (NMP) 99.5% (Sigma Aldrich), NaOH continuously being stirred. With a reflux apparatus, the
p.a. (Merck), NaHCO3 (Merck), polyethylene glycol 6000 mixture is heated in a water bath at a temperature of
(Sigma Aldrich), Cl2CH2COOH p.a. (Merck), 2,2′,azobis(2- 80–90°C for 2 h. Afterward, once the mixture had cooled
methylpropionitrile) (AIBN) (Sigma Aldrich), Na2HPO4 down, it was acidified with 6 M of HCl until the mixture
(Merck), NaH2PO4 (Merck), creatinine (Merck), ethanol p.a. reached a pH of 1. It was then extracted with each of
(Merck), vitamin B12 (Merck), urea (Merck), picric acid (Merck), 50 mL of diethyl ether and 50 mL of sodium bicarbonate
and 4-(Dimethyl amino benzaldehyde) (DAB) (Merck) were (5 wt%, 0.029 mol) three times. The result was acidified
used in this study. The materials were used as received again in the same way, then filtered, and dried. The
without further purification step. polymer was analyzed with FTIR.
2.2 Preparation of phosphate buffer
solution (PBS) 2.6 PA contact with urea
PBS of pH 7.4 was made by mixing 29 mL of 0.01 M PA was contacted with 1,000 ppm of urea to make a urea
Na2HPO4 with 6.5 mL of 0.02 M NaH2PO4 in a 100 mL mold in the membrane with the weight ratio of PA to urea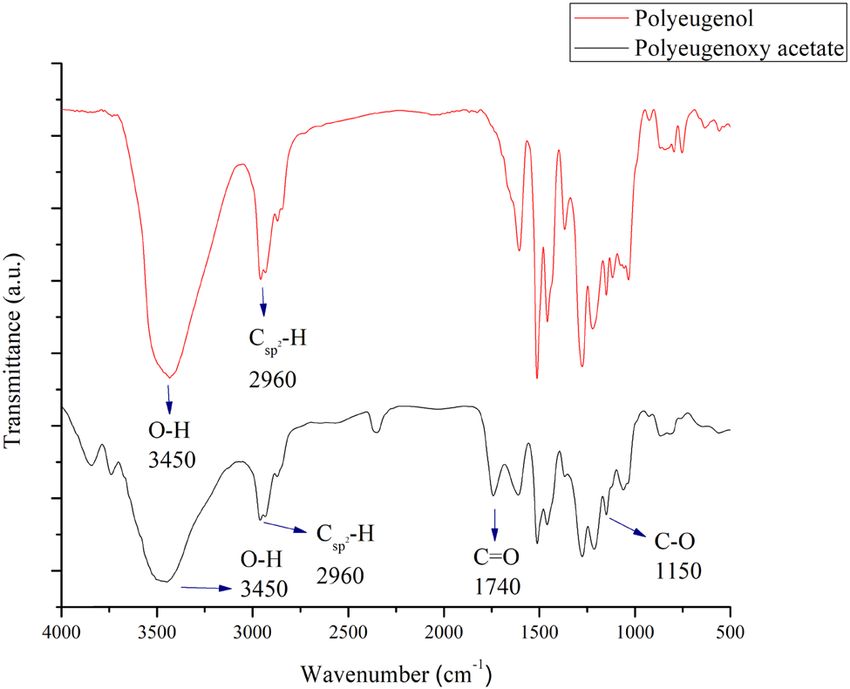
808 Muhammad Cholid Djunaidi et al.
of 1:20. The contacting process is done through stirring.
The PA was added with 1,000 ppm of urea solution and
the mixture was stirred for 24 h in a tightly shut con-
tainer; it was then filtered and dried.
Figure 1: Illustration of the diffusion cell apparatus.
2.7 Synthesis of MIM and non-imprinted
membrane (NIM) the equation of the standard, and then the transport per-
centage of the FP and the RP was calculated as follows:
The MIM was synthesized by mixing 3.749 g of polysulfone
(0.008 mol), 0.8333 g of PA-urea (0.005 mol), 0.8333 g of FP transport (%)
PEG (0.046 mol), and 0.249 mL of AIBN (0.00027 mol), Initial urea concentration in FP
= , (2)
diluted with 12 mL of NMP (0.00012 mol). Then their treat- Urea concentration in FP at n hour
ment was varied by only mixing without heat (MIM-0) and × 100 %
refluxed for 5 (MIM-5) and 10 h (MIM-10) at a temperature
of 80–90°C. Afterward, once the mixture had cooled down RP transport (%)
and was free of air bubble, the membrane was casted on a Initial urea concentration in the FP (3)
= × 100%,
glass surface and immediately submerged into aquabidest. Urea concentration in RP at n hour
NIM (NIM-0, NIM-5, and NIM-10) was also synthesized by where n is the time of the samples taken. The same
the same method but using the PA that has not been con- method is also used to calculate creatinine and vitamin
tacted with urea and then later used for comparison. B12 transport percentage. Creatinine concentration used
for the standard reference is 0–30 ppm with multiples of
5 ppm with the resulting equation:
2.8 Urea transport y = 0.0475x − 0.0102 . (4)
While the concentration used to make the vitamin B12 stan-
The transport was done by placing the membrane in a
dard is 0–50 ppm in 5 ppm multiples with the resulting
diffusion cell with 50 mL of PBS as the receiving phase
equation:
(RP) and 50 mL of 300 ppm urea diluted in PBS of pH 7.4 as
the feed phase (FP). The diffusion cell setup is described in y = 0.0159x − 0.0057. (5)
Figure 1. Sampling was done every 2 h for 8 h by taking 2 mL
solution of each phase. Then the concentration of samples
from both the phases was measured by UV-Vis spectro-
photometry at the wavelength of 430 nm to measure the 2.10 Membrane selectivity toward urea,
urea concentration by complexing the sample with DAB. creatinine, and vitamin B12
Transports of 100 ppm of urea, 25 ppm of creatinine, and
20 ppm of vitamin B12 were conducted, and the results were
2.9 Determination of urea, creatinine, and then compared to determine the selectivity. Sampling and
vitamin B12 transport percentage measurement were done in the same way by taking 2 mL of
solution from each phase every 2 h for 8 h. The creatinine
Using UV-Vis spectrophotometer, a standard reference of was complexed with picric acid before measuring with
urea concentration ranging from 0–400 ppm in multiples of UV-Vis. Creatinine was measured at the wavelength of
50 ppm was measured. The resulting equation is as follows: 486 nm, while vitamin B12 was measured at the wavelength
of 361 nm.
y = 0.0026x − 0.0246. (1)
Then the concentration of each transported urea Ethical approval: The conducted research is not related to
samples measured by the UV method was referred to either human or animal abuse.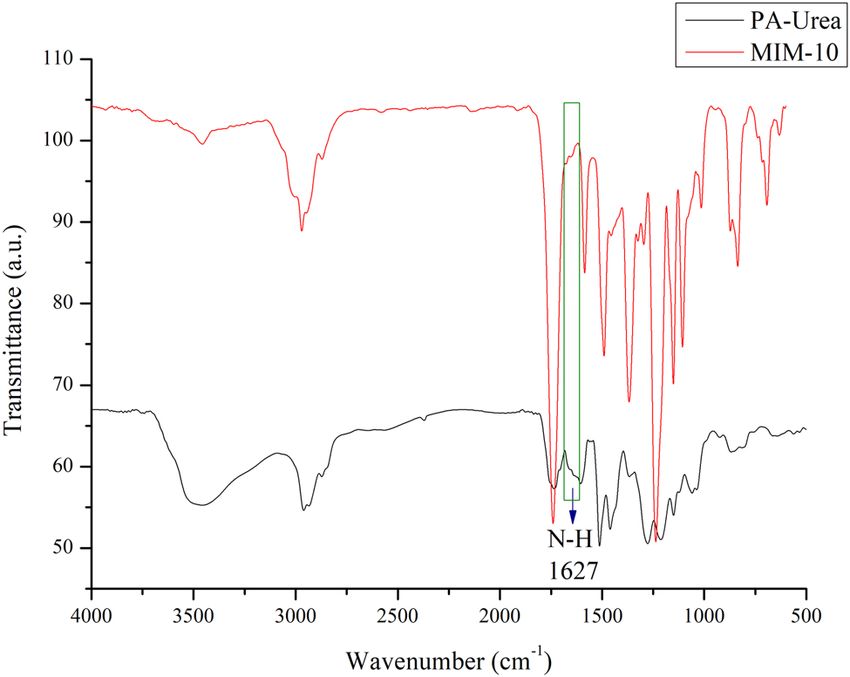
MIM for transport of urea, creatinine, and vitamin B12 809
3 Results and discussions
3.1 Synthesis of polyeugenol and PA
The polyeugenol synthesis showed a yield of 5.67 g (97.89%).
The polymerization consists of three stages. The first is the
initiation stage where the eugenol will go through an addi-
tion reaction due to the protons (H+) from BF3-diethyl ether
catalyst which follows Markovnikov’s law. Afterward is the
propagation stage in which the covalent bonds between the
cation chains and the eugenol monomers are formed. This
process continues until a long polymer chain is obtained.
Intermolecular rearrangement of the carbonium ion also
occurs at this stage. The last stage is the termination stage,
in which the cationic polymerization reaction between the
monomer and the catalyst takes place until all the monomers
are used up. Then methanol was added to stop the poly-
merization by binding the carbonium ion to its anion partner,
the CHO− 3 group from methanol. The mechanism reaction is
shown in Figure 2.
The resulting polyeugenol was analyzed by FTIR and
then compared with eugenol as shown in Figure 3. According
to the data, an absorption band in the 995 and 913 cm−1
region which belongs to a vinyl group was found in eugenol
but not in polyeugenol. This may indicate that polymeriza-
tion has occurred.
NMR characterization of eugenol and polyeugenol
could also be used to prove the polymerization. In pre-
vious research, it was found that there was a chemical Figure 2: Reaction mechanism of eugenol polymerization.
shift at 4.75–5.2 ppm that appeared as a doublet in the
eugenol spectra which indicates the ]CH2 groups. While
it was not seen in the polyeugenol spectra, there is
a chemical shift at 2.4–3.0 ppm indicating the presence
of –CH– groups in the polymer and the spectrum at
0.7–1.5 ppm indicating the three hydrogen atoms of methyl
groups in the polymer backbone. This strengthens the indi-
cation that polymerization has happened [18].
The synthesis of polyeugenoxy acetic acid begins
with the addition of NaOH and chloroacetic acid to the
polyeugenol. Polyeugenol will react with NaOH to form
polyeugenolate salt through its hydroxy group. The proton
from the hydroxyl group (–OH) on the polyeugenol is
easily released because the anion is stabilized by the pre-
sence of a benzene ring resonance. So, the addition of base
in the form of excess NaOH is carried out so that a lot of
salt is produced and the results are maximum. Na-polyeu-
genol salt is formed by the reaction of chloroacetic acid to
form polyeugenoxy acetic acid.
Then the results obtained were purified by extraction Figure 3: Comparison of FTIR result between eugenol and
using diethyl ether. The function of purification using polyeugenol.810 Muhammad Cholid Djunaidi et al.
diethyl ether is to remove impurities that are polar. After
that, extraction is carried out using sodium carbonate
which aims to remove impurities that are non-polar.
Next the solution was added with 6 M HCl until pH 1
was obtained and the solution was decanted. The filtrate
is then dried at room temperature and the results are then
weighed. PA synthesis resulted in a 6.5 g (96.04%) yield
with the degree of acetylation of 38.47%. The reaction of
PA synthesis is shown in Figure 4.
Eugenol, like most essential oils derived from a plant,
is sensitive to heat, highly volatile, and not soluble in
water [19]. Polymerizing, synthesizing the derivative,
and incorporating it with a cross-linking agent will result
in a more stable material. MIM is known to have multiple
advantages such as high stability, high affinity, and
selectivity toward template molecule [20].
Figure 5: Polyeugenol and PA FTIR comparison.
Figure 5 shows the FTIR analysis result of PA com-
pared with polyeugenol, which shows an absorbance
band at the range of 3,450 cm−1 indicating hydroxyl group contacted urea percentage in the polymer, UV-Vis spectro-
and at 2,960 cm−1 region indicating saturated carbonyl photometry analysis was used to analyze the urea
group (Csp2-H). The absorption band of acid carbonyl concentration before and after the contacting process.
group (C]O) was identified at the 1,740 cm−1 region, while The concentration of urea used for the contacting step
the acid (C–O) bond was identified at 1,150 cm−1. From is 1,000 ppm. This concentration is used to optimize
these data, it could be concluded that polyeugenoxy acetic the amount of urea contacted with the polymer, while
acid has been successfully synthesized. keeping the concentration of urea to be not too high so
that it could be analyzed using UV-Vis spectroscopy. The
result showed that 23.54% of urea was adsorbed by the
PA. The amount of urea that interacts with the polymer is
3.2 PA contacting with urea one of the important things that will determine the per-
formance of the membrane when used for transport
The synthesized polyeugenol was contacted with urea to applications. In the contacting stage, there can be two
create a urea template in the MIM. To calculate the types of interactions between the polymer and the tem-
plate. The first type is called a self-assembling approach
which is similar to the biological recognition systems that
use non-covalent forces such as hydrogen bonds, Van der
Waals forces, ionic or hydrophobic interactions, and
metal coordination [21]. The second is a preorganized
approach which uses reversible covalent bonds. This
type of approach tends to produce homogeneous binding
sites and reduce non-specific sites. However, it is neces-
sary to break the covalent bonds to remove the template
from the polymer matrix [22]. The approximate hydrogen
bond between polygenoxy acetic acid and urea is depicted
in Figure 6.
3.3 Analysis of MIM and NIM
Two types of membranes were synthesized, the MIM and
Figure 4: Reaction mechanism of PA synthesis. NIM. The variations carried out in this research were theMIM for transport of urea, creatinine, and vitamin B12 811
Figure 6: Approximation of bond between polyeugenoxy acetic acid and urea.
variation in reflux time of 5 and 10 h at a temperature of membrane will also increase. Some parts of the mem-
80–90°C and without the use of reflux and only stirring brane seem to have impurity in the surface of the pores
using a stirrer for 10 h at room temperature. The mixture that looks like some cluster. However, the transport pro-
turned into a blackish brown solution which was then cess was done using the membrane part that seems to
cast to form a membrane and allowed to soak in aqua- have the least defect from the rest, so the quality of the
bidest for 24 h. transport should not be much affected by it. The pore
The urea will be released from the membrane when it sizes of the MIM and NIM are measured using ImageJ
is being soaked in aquabidest leaving a cavity of size, software and the generated results are shown in Table 1.
shape, and structure similar to that of urea, thus creating The EDX analysis results in Table 2 indicate that there are
an MIM. To confirm this, we analyze the urea contacted
PA (PA-Urea) sample and the MIM-10 sample. In the
result shown in Figure 7, the green box area is the absorp-
tion area of urea N–H bending. It is detected in the wave-
number of 1,627 cm−1 in the PA-Urea spectra but it is not
shown in the MIM-10 spectra, which indicates that the
urea has indeed been released and no longer contained in
the membrane, forming a template in the MIM. The N–H
bending spectra of urea detected in this research corre-
spond with other previous studies [23,24].
Analysis using SEM-EDX was carried out to determine
the surface morphology of the membrane and to determine
the elemental content in the membrane. Figures 8 and 9
show the surface and pore morphology of the MIM and
NIM at 5,000× magnification, respectively.
Based on the surface morphology of the MIM in
Figure 8, it is seen that heating affects the membrane
pores. Heating will decrease the pore size of the mem- Figure 7: FTIR spectra comparison of PA-Urea and MIM-10 high-
brane, but as heating time increases, the pore size of the lighting the N–H urea absorbance area.812 Muhammad Cholid Djunaidi et al.
Figure 8: SEM analysis results of (a) MIM-0, (b) MIM-5, and (c) MIM-10 surface morphology.
Figure 9: SEM analysis result of (a) NIM-0, (b) NIM-5, and (c) NIM-10 surface morphology.
no nitrogen (N) from urea contained in the sample of the followed by NIM-10 and NIM-0 in the absorption area
membranes. NIM was synthesized using PA that was not 1,080–1,130 cm−1.
contacted with urea but the MIM used the PA that has
been contacted with urea. The lack of nitrogen in the EDX
analysis of all the MIM samples indicates that the urea
3.4 Urea transport test with heating time
has been released from the MIM when it was soaked with
aquabidest, supposedly leaving a urea cavity in the MIM variations in the membrane
that will later serve as the template that could recog-
nize urea. The variation in the membrane without heating results in
In the NIM variation, analysis was carried out using a membrane with perforated part when viewed under light.
FTIR to determine the effect of heating on the membrane When a leak test is carried out, the membrane without
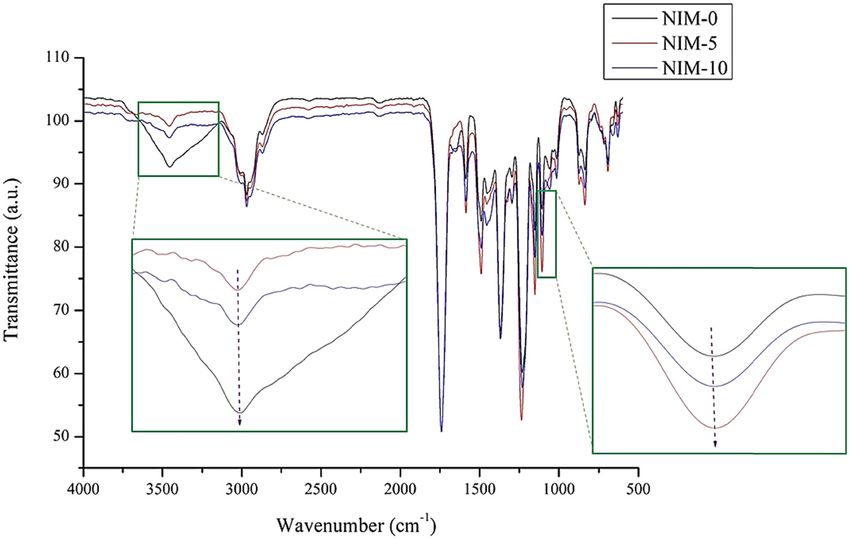
functional groups. The results of FTIR analysis on NIM-0, heating leaks. Based on previous FTIR results, membranes
NIM-5, and NIM-10 are shown in Figure 10. It can be seen without heating had the strongest O–H absorption com-
in the OH absorption region in the range 3,450–3,460 cm−1 pared to membranes with heating for 5 and 10 h. So, it
that NIM-0 (without heating) has the greatest OH inten- can be concluded that less of O–H indicates the ability of
sity, followed by NIM-10 and NIM-5. The strengthening the membrane to be leakage free. If transport using a mem-
of the OH group intensity will show the attenuation of brane without heating (MIM-0) that leaks is carried out, the
the C–O group detected in the 1106.5 cm−1 absorption transport results obtained may be invalid because it is pos-
area. The strongest C–O group intensity is in NIM-5, sible that the urea will escape and does not represent the
transport ability and selectivity of the membrane itself.
Table 1: Pore size measurement result of all membrane variation
Table 2: Elemental analysis result by EDX on all membrane
Sample Average pore size (μm) variations
MIM-0 1.087 ± 0.328
Element NIM- NIM- NIM- MIM- MIM- MIM-
MIM-5 0.373 ± 0.063
0 (%) 5 (%) 10 (%) 0 (%) 5 (%) 10 (%)
MIM-10 0.530 ± 0.096
NIM-0 0.867 ± 0.154 C 77.26 76.47 75.70 76.89 75.36 76.13
NIM-5 0.746 ± 0.178 O 18.32 18.95 19.53 17.70 19.71 19.50
NIM-10 1.134 ± 0.268 S 4.42 3.93 4.26 4.45 4.36 3.62MIM for transport of urea, creatinine, and vitamin B12 813
Figure 10: FTIR graph on the absorption of C–O and O–H groups in the NIM variation.
Therefore, the transport test for urea was carried out using a is no longer possible to transport because the concentra-
membrane with a heating variation in 5 and 10 h (MIM-5 tion between the FP and the RP is balanced. The result is
and MIM-10). shown in Figure 12.
The setup used for the transport process is a diffusion
cell that consists of the FP and the RP. The FP contains
the solution with the compound that has to be trans- 3.5 Urea, creatinine, and vitamin B12
ported, in this case urea diluted by PBS, while the RP transport and selectivity test
only consists of PBS. The MIM is put in-between the FP
and the RP, and with concentration difference as the For the selectivity test, MIM-10 was used as it is the
driving force, urea will be transported to the RP. The membrane that showed the best ability in transporting
results of 300 ppm urea transport using NIM and MIM 300 ppm of urea. The membranes are used for the trans-
variations are shown in Figure 11. port of 100 ppm urea, 25 ppm creatinine, and 20 ppm
In Figure 11, the transport of 300 ppm of urea is vitamin B12, and from these data, the selectivity of the
shown to be the most optimum using the MIM-10 varia- membrane towards urea is calculated. These specific con-
tion which shows a 21.13% decrease in urea in the FP, centrations were chosen as it is the concentration that
while the RP shows a 17.91% of urea increment. The con- gives the highest precision in the UV method, which is
centration lost from the FP and gained in the RP could be in the range of 0.2–0.8 [25]. More than 20 ppm creatinine
different due to urea entrapment in the membrane.
Another transport test using 500 ppm of urea was
carried out for 48 h to determine the membrane transport 100
RP NIM-5
Transport percentage (%)
performance when the transport time was increased. 80 FP NIM-5
The membrane used in this test was the MIM-10 which 60 RP MIM-5
showed the optimal results when transporting 300 ppm FP MIM-5
40
of urea. The results showed that at 48 h, the membrane RP NIM-10
20
was able to transport 50.42% of 500 ppm of urea in terms FP NIM-10
of the FP. Meanwhile, the RP showed that the amount of 0 RP MIM-10
0 2 4 6 8
urea transported was 49.06%. The longer the transport FP MIM-10
Time (hours)
time, the lower the amount of urea being transported. The
driving force on this transport is the difference in concen- Figure 11: The result of 300 ppm urea transport using variations in
tration between the FP and the RP, and at the 48th hour it MIM and NIM.814 Muhammad Cholid Djunaidi et al.
100
best transport result was achieved by the 100 ppm concen-
Transport percentage (%) RP
tration. The results of 100 ppm urea transport with MIM-10
80 FP
and NIM-10 are shown in Figure 14.
60 For the creatinine transport, the NIM was able to
transport 4.47% of creatinine, while the MIM was able
40
to transport 23.62% of creatinine when viewed from the
20 FP. While from the RP, NIM was able to transport 3.46%
0 of creatinine and MIM was able to transport 13.44% of
0 12
2 24 36 48 creatinine. This shows that the membrane’s ability to
Time (hoours)
transport creatinine is not optimal when compared to
Figure 12: The result of 500 ppm urea transport for 48 h using urea transport. The results of creatinine transport using
MIM-10. the 10 h NIM and MIM membranes are shown in Figure 15.
While for the vitamin B12, in terms of the FP, vitamin
would give an absorbance value over 1, while urea con- B12 transport using the NIM-10 was able to transport
centration of 50 ppm and under would have absorbance 9.38% of vitamin B12, while the MIM-10 was only able
value of less than 0.2. to transport 6.28% of vitamin B12. When viewed from the
Transport of urea, creatinine, and vitamin B12 aims to RP, NIM-10 is able to transport 5.37% of vitamin B12 while
prove the urea template in the membrane and its ability MIM is able to transport 9.86% of vitamin B12. This shows
in transporting urea compared to other substances. The that the MIM-10 and NIM-10 membranes are less capable
approximate reaction between polysulfone, PEG, and PA- of transporting vitamin B12. The results of vitamin B12
Urea is depicted in Figure 13. transport using the NIM-10 and MIM-10 membranes are
In this test, urea transport was carried out with a shown in Figure 16.
concentration of 100 ppm. This time for urea transport, Based on the results of creatinine and vitamin B12
the urea concentration was lowered to obtain better transport, it shows that the MIM membrane is more cap-
transport results. Evidently, by using a lower concentra- able of transporting urea than creatinine and vitamin B12.
tion of urea, the percentage of urea that was successfully This could be due to the molecular size of urea, creati-
transported when viewed from the FP was 28.89% for nine, and vitamin B12. Urea has a size of 60 Da, creatinine
MIM and 5.31% for NIM. Meanwhile, when viewed from has a size of 113 Da [26], and vitamin B12 has a size of 8.5 Å
the RP, the urea transported was 28.09% for MIM and or 1.35 kDa [27]. The size of vitamin B12 is much larger
14.61% for NIM. The results of urea transport using the than the size of urea so that the transport ability of the
MIM were better than those obtained using the NIM, indi- MIM membrane in the transport of vitamin B12 is not as
cating that the urea template on the MIM was properly good as the transport of urea as well as creatinine.
formed so that it was able to recognize urea and transport Based on the selectivity graph of urea and vitamin B12
it more optimally. From the various concentrations of urea in Figure 17, it shows that the MIM has a greater selec-
used in the transport process, it can be concluded that the tivity value than the NIM. This means that the MIM with
Figure 13: Estimated formation of a urea template on the MIM membrane.MIM for transport of urea, creatinine, and vitamin B12 815
100 100
Transport percentage (%)
Transport percentage (%)
80 80
RP NIM-10 60 RP NIM-10
60
FP NIM-10 FP NIM-10
40
40 RP MIM-10 RP MIM-10
FP MIM-10 20 FP MIM-10
20
0
0 0 2 4 6 8
0 2 4 6 8
Time (hours)
Time (hours)
Figure 14: Percentage of 100 ppm urea transport using MIM-10 and Figure 16: Percentage of 20 ppm vitamin B12 transport using MIM-10
NIM-10. and NIM-10.
from the FP to the RP, so it will happen continuously as
100
long as there is a driving force which is the concentration
Transport percentage (%)
80
difference between the FP and RP. The reusability of the
60 RP MIM-10 imprinted membranes is not yet tested on this research
40 FP MIM-10 and will be an interesting insight to be added in future
RP NIM-10
20 studies, but as long as the regeneration is proper, the
FP NIM-10
0 reusability is hoped to be dependable as supported by
0 2 4 6 8 the low amount of trapped molecule in the membrane
Time (hours)
when comparing the difference in the transport data
between the FP and the RP.
Figure 15: Percentage of 25 ppm creatinine transport using MIM-10
and NIM-10.
urea template is better in transporting urea than vitamin
B12. This also proves the presence of urea template on the 4 Conclusion
MIM which makes the MIM more selective toward urea
and less capable of transporting vitamin B12. Meanwhile, Polyeugenol and PA have been successfully synthesized
the NIM, which does not have a urea template, has a with a yield of 97.89 and 96.04%, respectively. The
lower selectivity value because the NIM is not able to synthesized MIM is proven to transport urea better than
recognize urea properly. the NIM due to the urea template in the MIM. In an 8-h
The regeneration of the membrane happens in the span, the best urea transport result was shown by MIM-10
transport process during the release of target molecule variation that was synthesized by heating for 10 h, which
1.5 1.5
1 1
Selectivity
Selectivity
0.5 FP MIM-10 0.5 FP MIM-10
FP NIM-10
FP NIM-10
0 0
0 2 4 6 8 0 2 4 6 8
Time (hours) Time (hours)
(a) (b)
Figure 17: MIM-10 and NIM-10 selectivity for the transport of urea toward (a) creatinine and (b) vitamin B12.816 Muhammad Cholid Djunaidi et al.
transported 28.89% of 100 ppm urea, while the NIM-10 opposite behavior of covalently and noncovalently imprinted
transported only 5.31%. However, the transport that was membranes, Macromolecules. 1998;31:2137–40.
conducted for 48 h showed that the MIM-10 could trans- [7] Poma A, Turner APF, Piletsky SA. Advances in the manu-
facture of MIP nanoparticles. Trends Biotechnol.
port 50.42% of 500 ppm urea. MIM-10 selectivity toward
2010;28:629–37.
urea and against creatinine and vitamin B12 showed a [8] Djunaidi MC, Azizah A, Gunawan. Synthesis of molecularly
higher value than the NIM selectivity. The result proves the imprinted polymer urea based on polyeugenol with ethylene
presence of the urea template in the MIM. The order of MIM glycol dimethacrylate as crosslinking agent. Proceedings of
selectivity from the best results was urea > creatinine > the 14th Joint Conference on Chemistry. Indonesia: AIP Conf
Proc; 2019 Sep 10–11. p. 020058.
vitamin B12.
[9] Rayanasukha Y, Pratontep S, Porntheeraphat S,
Bunjongpru W. Non-enzymatic urea sensor using molecularly
Acknowledgment: This study was financially supported imprinted polymers surface modified based-on ion-sensitive
by the International Publication Research Grant funded field effect transistor (ISFET), Nukeaw J Surf Coat Tech.
other than state budget of Diponegoro University 2021 2016;306:147–50.
[10] Liu YL, Liu R, Qin Y, Qiu QF, Chen Z, Cheng SB, et al. Flexible
(185-78/UN7.6.1/PP/2021).
electrochemical urea sensor based on surface molecularly
imprinted nanotubes for detection of human sweat. Anal
Funding information: This research was funded by the Chem. 2018;90(21):13081–87.
Ministry of Research, Technology, and Higher Education, [11] Pogány P, Razali M, Szekely G. Experimental and theoretical
Indonesia. investigation of the complexation of methacrylic acid and
diisopropyl urea. Spectrochim Acta A. 2017;170:69–76.
[12] Djunaidi MC, Haris A, Pardoyo P, Rosdiana K. The impact of
Author contributions: M.C.D. – conceptualization, funding
template types on polyeugenol to the adsorption selectivity of
acquisition, resources; N.A.F. – investigation, formal ana- ionic imprinted polymer (IIP) Fe metal ion. Proceedings of the
lysis, writing – original draft, review and editing; M.C.D. 12th Joint Conference on Chemistry. Indonesia: IOP Conf Ser;
and N.A.F. – methodology, data curation; and M.C.D. and 2017 Sep 19–20. p. 012034.
A.H. – supervision. [13] Djunaidi MC, Prasetya NBA, Khoiriyah A, Pardoyo P, Haris A,
Febriola NA. Polysulfone influence on au selective adsorbent
imprinted membrane synthesis with sulfonated polyeugenol
Conflict of interest: Authors state no conflict of interest.
as functional polymer. Membranes. 2020;10(12):390.
[14] Djunaidi MC, Pardoyo P, Widodo DS, Lusiana RA, Yuliani A.
Data availability statement: The datasets generated during In-Situ Ionic Imprinted Membrane (IIM) synthesis based
and/or analyzed during the current study are available on acetic polyeugenoxy acetyl tiophen methanolate for gold(III)
from the corresponding author on reasonable request. metal ion transports. Indones J Chem. 2020;20(6):1323–31.
[15] Da Silva FFM, Monte FJQ, de Lemos TLG, Do Nascimento PGG,
de Medeiros Costa AK, De Paiva LMM. Eugenol derivatives:
synthesis, characterization, and evaluation of antibacterial
and antioxidant activities. Chem Cent J. 2018;12(1):1–9.
References [16] Verma AM, Kishore N. Gas phase conversion of eugenol into
various hydrocarbons and platform chemicals. RSC Adv.
[1] De Nicola L, Zoccali C. Chronic kidney disease prevalence in 2017;7(5):2527–43.
the general population: heterogeneity and concerns. Nephrol [17] Zhang H, Tian H, Zhang J, Guo R, Li X, Int J. Facilitated transport
Dial Transplant. 2016;31:331–5. membranes with an amino acid salt for highly efficient CO2
[2] Mohammad AM, Yuniastuti A. Gender-based health disorders separation. Greenh Gas Con. 2018;78:85–93.
in end-stage renal disease patients in the hospital Elmarj city [18] Djunaidi MC, Siswanta D. Eluent influences on synthesis
Libya. Kemas. 2017;13(1):113–20. of Fe(III)-imprinted polyeugenol using polyethylene glycol
[3] Ahmed HG, Ginawi I, Alshammari F. Association of genetic and diglycidilether (PEGDE) as cross-linking agent and its
biochemical markers with GFR among renal failure patients: application as Fe(III) sorbent. Orient J Chem.
applying serum creatinine and cystatin C measures. Sch J App 2015;31(4):2223–9.
Med Sci. 2015;3(6D):2431–6. [19] Woranuch S, Yoksan R. Eugenol-loaded chitosan nanoparti-
[4] Deppisch R, Göhl H, Smeby L. Microdomain structure of poly- cles: I. Thermal stability improvement of eugenol through
meric surfaces–potential for improving blood treatment pro- encapsulation. Carbohydr Polym. 2013;96(2):578–85.
cedures. Nephrol Dial Trans. 1998;13(6):1354–9. [20] Saylan Y, Akgönüllü S, Yavuz H, Ünal S, Denizli A. Molecularly
[5] Cieplak M, Kutner W. Artificial biosensors: how can molecular imprinted polymer based sensors for medical applications.
imprinting mimic biorecognition? Trends Biotechnol. Sensors. 2019;19(6):1279.
2016;34(11):922–41. [21] Arshady R, Mosbach K. Synthesis of substrate-selective poly-
[6] Piletsky SA, Piletskaya EV, Panasyuk TL, El'skaya AV, Levi R, mers by host-guest polymerization. Macromol Chem Phys.
Karube I, et al. Imprinted membranes for sensor technology: 1981;182(2):687–92.MIM for transport of urea, creatinine, and vitamin B12 817
[22] Wulff G. The use of polymers with enzyme-analogous struc- [25] Hansen S, Pedersen-Bjergaard S, Rasmussen K. Introduction
tures for the resolution of racemates. Angew Chem Internat to pharmaceutical chemical analysis. Chichester, UK: John
Edit. 1972;11(4):341. Wiley & Sons; 2012.
[23] Djunaidi MC, Wenten IG, Synthesis of eugenol-based selective [26] Hosten AO. Bun and creatinine. Clinical methods: the history,
membrane for hemodialysis. IOP Conference Series: physical, and laboratory examinations. 3rd ed. Boston:
Materials Science and Engineering. Indonesia: IOP Butterworths; 1990.
Publishing; 2019 Apr. [27] Talmard C, Guilloreau L, Coppel Y, Mazarguil H, Faller P.
[24] Piasek Z, Urbanski TB. The infra-red absorption spectrum and Amyloid-Beta peptide forms monomeric complexes with Cuii
structure of urea. Pol Acad Sci-Tech X. 1962;X:13–20. and Znii prior to aggregation. Chembiochem. 2007;8(2):63–165.You can also read