Ultrafast superresolution fluorescence imaging with spinning disk confocal microscope optics
←
→
Page content transcription
If your browser does not render page correctly, please read the page content below
Ultrafast superresolution fluorescence imaging with
         spinning disk confocal microscope optics

Shinichi Hayashia and Yasushi Okadab,*
a
 Products development department 6, R&D division, Olympus Corporation, 2951
Ishikawa-cho, Hachioji, Tokyo, 192-8507, Japan.
b
 Laboratory for Cell Polarity Regulation, Quantitative Biology Center, RIKEN,
Furuedai 6-2-3, Suita, Osaka, 565-0874, Japan
*Correspondence should be addressed to Yasushi Okada
Quantitative Biology Center, RIKEN, Furuedai 6-2-3, Suita, Osaka, 565-0874, Japan
Tel: +81-6-6155-0118
Fax: +81-6-6155-0112
Email: y.okada@riken.jp

Running Head: Ultrafast Superresolution Live Imaging

Abbreviations
SR: superresolution
SDSRM: spinning disk superresolution microscope
SIM: structured illumination microscope
WF: wide field
CF: confocal
MSIM: multifocal structured illumination microscope
ISM: image scanning microscopy
DSU: disk scanning unit

ABSTRACT
Most current superresolution (SR) microscope techniques surpass the diffraction limit at
the expense of temporal resolution, compromising their applications to live cell
imaging. Here, we describe a new SR fluorescent microscopy based on confocal
microscope optics, which we named as Spinning Disk SuperResolution Microscope
(SDSRM). Theoretically, SDSRM is equivalent to structured illumination microscopy
(SIM) and achieves a spatial resolution of 120 nm, double that of the diffraction limit of
widefield fluorescent microscopy. However, SDSRM is 10 times faster than
conventional SIM because SR signals are recovered by optical demodulation through
the stripe pattern of the disk. Therefore a single SR image requires only a single
averaged image through the rotating disk. Based on this theory, we have modified a
commercial spinning disk confocal microscope. The improved resolution around 120

                                                           1

                        Supplemental Material can be found at:
                        http://www.molbiolcell.org/content/suppl/2015/02/23/mbc.E14-08-1287v1.DC1.html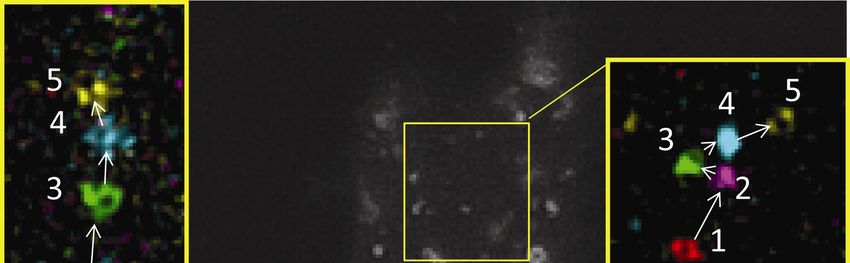
nm was confirmed with biological samples. The rapid dynamics of microtubules,
mitochondria, lysosomes and endosomes were observed with temporal resolutions of
30-100 frames per second. Since our method requires only small optical modifications,
it will enable an easy upgrade from an existing spinning disk confocal to a SR
microscope for live cell imaging.

Introduction
Fluorescent microscopy is now an essential tool for the cell biologist. However, most of
the subcellular structures are smaller than 200 nm and are blurred by diffraction (Abbe,
1873). Superresolution (SR) techniques like photoactivatable localization microscopy
(PALM) (Betzig et al., 2006), stochastic optical reconstruction microscopy (STORM)
(Rust et al., 2006) or stimulated emission depletion microscopy (STED) (Hell and
Wichmann, 1994) can extend the resolution down to 50 nm or better, but usually at the
expense of image acquisition time. Therefore, their applications are rather limited to
fixed specimens. In living cells, some cellular structures like endosomes and other
vesicles move at velocities faster than 3 µm/s (Allen et al., 1982). Thus, the image
acquisition time needs to be much faster than 30 ms for 100 nm resolution imaging.
From this viewpoint, PALM and STORM are not suitable to observe the rapid dynamics
of subcellular structures in living cells, because they reconstruct a single SR image from
at least thousands of raw images, requiring more than 10 seconds of imaging for a
single frame. STED can be accelerated, but faster image acquisition requires orders of
magnitude stronger illumination than conventional imaging that risks photo damage. As
a result, the practical limit of STED image acquisition time is longer than a few
microseconds per pixel, meaning 10 seconds for a 1024x1024 pixels field of view
(Huang et al., 2009).
A third SR technique, structured illumination microscopy (SIM) (Heintzmann and
Cremer, 1999), can extend the resolution to 120 nm, twice the resolving power of
conventional wide field (WF) microscopy. Although its resolution is worse than the
other two techniques, SIM can achieve faster frame rates with little photo damage and
multi-color imaging relatively easily. One recent study reported a frame rate up to 11
Hz (Kner et al., 2009). However, this may be the best achievable frame rate, because
SIM requires 9 to 15 raw images to reconstruct a single SR image. A related technique,
multifocal SIM (MSIM) (York et al., 2012), a parallelized form of image scanning
microscopy (ISM)(Sheppard, 1988), generates an image with ~150 nm resolution at ~1
Hz frame rate. Recently, an improved implementation of MSIM, termed instant SIM,
was reported (York et al., 2013). A 100 Hz frame rate with ~150 nm resolution was
achieved by using several optical elements such as two sets of microlens array and
pinhole array, however expertise is required to align all these optical elements correctly.
Here we report another implementation of SIM using spinning disk confocal
microscope optics, which we named SDSRM (Spinning Disk SuperResolution
Microscope). We demonstrate that the commercial spinning disk confocal microscope
can be upgraded into a SR microscope simply by replacing the disk. It can achieve the
same resolution as SIM, 120 nm, but with a frame rate of 10 ms/frame. This is the

                                             2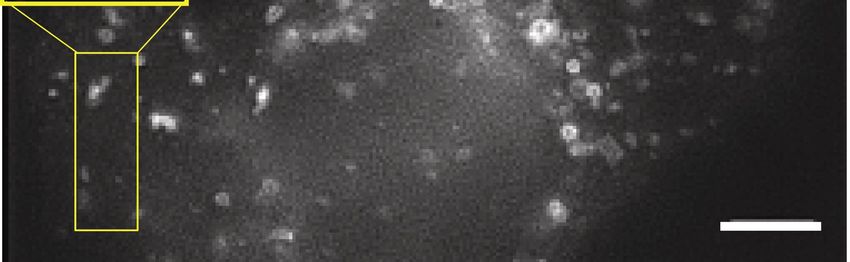
fastest frame rate ever reported for SR imaging (York et al., 2013), and is fast enough to
image fine structures in living cells moving at up to 6 µm/s.

Results
Principle of SDSRM
The basic principle of our SR method is illustrated in Figure 1, and fully discussed in
supplemental text 1. Here, we use a one-dimensional model and omit the magnification
of the imaging system for simplicity. In WF microscopy, the sample is illuminated
homogeneously and the image contains only the signals within the cut-off frequency of
the optical system (fc), which determines the diffraction limit of the resolution. In
conventional SIM (Figure 1A), a raw image is taken with illumination modulated
sinusoidally. SR signals, namely, the signals of the structure beyond fc are overlaid as
Moire interference patterns with a frequency shift by f0, the spatial frequency of the
sinusoidal illumination pattern. The SR signals are demodulated by digital processing
using three raw images taken with illumination patterns phase-shifted by 120 degrees
each. Thus, the cut-off frequency of SIM is extended to fc+f0. Usually, the same
objective lens is used for imaging and illumination, so that f0 can be designed up to fc
(        ). Hence,               . Namely, at most twice better resolution can be
achieved with SIM (Figures 1C, S1A).
In SDSRM, a stripe pattern with an opening width w and period p is used as a
modulator for illumination and demodulator for detection (Figure 1B). The stripe
pattern is shifted continuously, and the image is integrated on the camera. Thus, the
same confocal mask pattern serves as both modulator and demodulator, and frequency-
shifted SR signals are already returned to the original position optically. Although this
optical configuration is same as the conventional line confocal (CF) microscope, the
design of the stripe pattern is different. In conventional CF, the period p is much larger
than the opening width w to minimize cross talk (Shimozawa et al., 2013). Therefore,
the amplitude of the SR signals is much weaker than the WF signal (Figures 1D, S1B),

because it is proportional to                     (SI), Thus, the effective cut-off

frequency (fc’) of CF is limited to around       , meaning only root 2-fold increase in
resolution(Sheppard, 1988). SR signals between fc’ and fc+f0 are buried in the noise and
need statistical estimation for recovery with an algorithm like Richardson-Lucy
deconvolution (York et al., 2012). Instead, we have designed the stripe pattern as w=80
nm and p=270 nm on the sample plane to increase the SR signals. This parameter is
close to the theoretical maximum (w/p=0.35), and increases the SR signal more than 5
times than the conventional CF stripe pattern. Furthermore, we have designed a digital
high pass filter to further enhance the SR signals (Figures 1E, S2). Thus, we can recover
fully twice better resolution image from a single raw image of line CF with the designed
stripe pattern.

Instrumentation of SDSRM

                                             3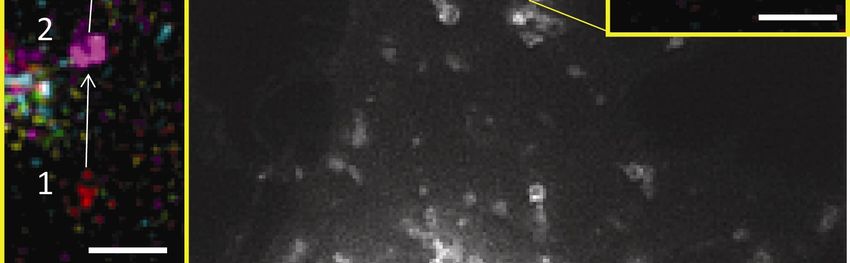
Based on this principle, we have modified a spinning disk microscope (Figure 2A). The
disk, light source and camera (projection lens) were changed from the commercial
system.
For the scan head, we used the disk scanning unit (DSU, Olympus) whose disk is easy
to replace. The stripe pattern of the disk was designed to match the condition discussed
above. The opening width (w) and the period (p) is 500 nm and 5 m on the sample
plane, respectively, with the commercial DSU for 60x NA1.4 objectives. Both w and p
were narrowed to 80 nm and 270 nm on the sample plane when projected through a 60x
objective (Figure 2, B and C). This custom-designed disk was made by using electron
lithography on a low reflection chrome coat that covered a fused silica substrate
(prototype development division of Olympus, to be available as a custom order product,
DU-DSR1-SP, from Olympus, Japan).
The Olympus DSU system normally uses a mercury lamp as the illumination, but the
light throughput for the illumination is only 14% with our custom designed disk mainly
due to the opening ratio and the diffraction efficiency of the disk pattern. We have
therefore replaced the light source to a laser (488 nm, 500 mW, Sapphire 488HP,
Coherent). The laser beam was expanded with a lens to fill the aperture, and the speckle
noise was removed by a rotating diffuser (light stirrer, NANDN, Tokyo, Japan).
The image was projected onto a CCD camera (CoolSNAP HQ, Photometrics) or an
sCMOS camera (ORCA FLASH 4.0v2, Hamamatsu) via a magnifier to satisfy the
Nyquist condition for up to 100 nm resolution. The SR components in the raw image
were amplified by Fourier space filtering using the “Custom Filter” command of Image
J. The filter (Figure S2E) was designed as discussed in the supplement.
The resolution of the system was confirmed using latex beads (Figure S3). In our hand,
a back- illuminated EMCCD camera (iXon512, Andor) failed to extend the resolution
even after the digital filtering. The SR components seemed to be weakened through the
potential cross-talks between the adjacent pixels.
Proof of principle experiments with a low NA objective
As a proof of principle experiment, we examined a microtubule sample under four
conditions: conventional WF with an NA 0.5 objective (Figure 3, A-C), CF with the
same NA 0.5 objective followed by deconvolution (Figure 3, D-F), SDSRM with the
same NA 0.5 objective (Figure 3, G-I) and conventional WF with an NA 0.95 objective
(Figure 3, J-L). Here, mercury lamp used for illumination, and the images were taken
with CCD camera (CoolSNAP HQ).
Because the diffraction limit is proportional to the inverse of the NA (Abbe, 1873), the
NA 0.95 objective yields an image with 1.9 times higher resolution than the NA 0.5
objective. Yet the image obtained by SDSRM with the NA 0.5 objective was essentially
same as an image obtained by conventional WF with the NA 0.95 objective, indicating
SDSRM is a real SR which improves resolution by a factor of about two compared with
conventional WF. It should be noted that deconvolution of the CF image did improve
resolution over WF but failed to achieve full 2x resolution (Figure 3, D-F). We have
4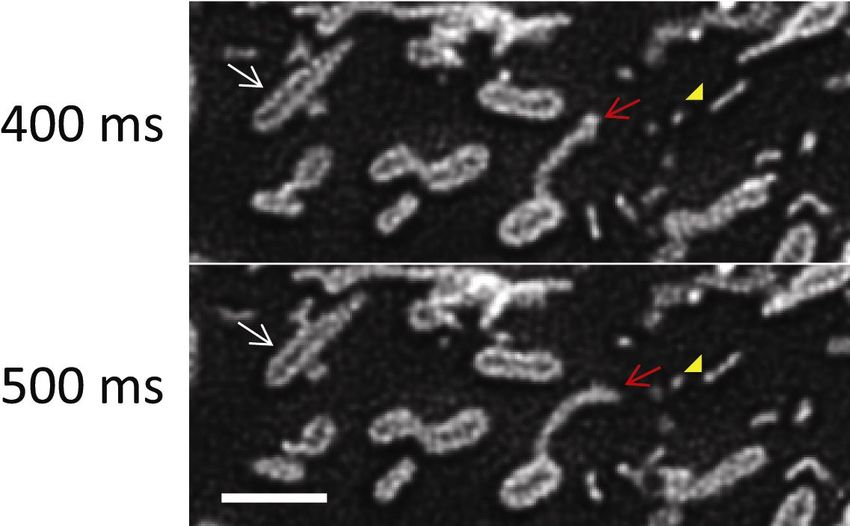
tried several different deconvolution software packages, but all gave similar results
(Figure S4).
SR live imaging of microtubule
We next examined whether our SDSRM can resolve biological structures smaller than
200 nm with a high NA objective (60x, NA 1.35) in living cells. Microtubules were
stained by expressing EYFP-tagged -tubulin. The raw images were taken by a CCD
camera (CoolSNAP HQ) at 5 FPS with a laser excitation 20W/cm2 at the sample. As
shown in Figure 4, the width of a single microtubule image is blurred to 260 nm
(FWHM) in conventional WF image, which is twice improved to 120 nm with SDSRM
(Figure 4C). A pair of microtubules with 250 nm distance was not separated in the
conventional WF image, but they were clearly separated with SDSRM (Figure 4D).
Furthermore, the dynamics of microtubules were recorded at 5 FPS (Movie 1).
Fast SR live imaging of endosomes
The initial experiments with CCD camera described above confirmed that SDSRM can
achieve ~120 nm resolution, twice better than conventional WF microscopy even with
the live biological specimen. Next, we tried faster frame rate by replacing the camera
with sCMOS camera (ORCA FLASH 4.0 v2), which can achieve a frame rate up to 100
FPS, faster than video rate. A silicone oil immersion objective lens (UPlanSApo 60x
Sil, NA1.3) was used to minimize the spherical aberrations by the refraction index
mismatch.
As the proof-of-principle of fast SR imaging, we chose endosomes and lysosomes,
which are known to be highly dynamic. They often move at faster than 1 m/s and
imaging faster than video rate is required for capturing their dynamics without motion
blur. The dynamics of lysosomes were observed with Lamp1 (Lysosomal-associated
membrane proitein1) –EYFP. The images were taken with 20 ms exposure. A 100 ms-
interval time series of two lysosomes are shown in Figure 5. They sometimes move at
as fast as 10 m/s, their lumen are still clearly visualized, demonstrating that the rapid
frame rate enabled the SR imaging without motion blur (Movie 1). Similarly, the rapid
dynamics of recycling endosomes including a fusion event were clearly visualized by
100Hz SR live imaging (10 ms exposure) of Rab11a-venus (Figure 6, Movie 2).
SR imaging of mitochondria derived vesicles
Finally, we applied SDSRM for the imaging of recently reported, but poorly
characterized organelle, mitochondria derived vesicles (MDVs). They are proposed to
be formed through budding of the mitochondria outer membrane, and to mediate the
transport of damaged proteins from mitochondria to peroxisomes (Neuspiel et al.,
2008). However, it has been difficult to examine the structure and dynamics of the outer
membrane of mitochondria due to the limited resolution of light microscopy. We,
5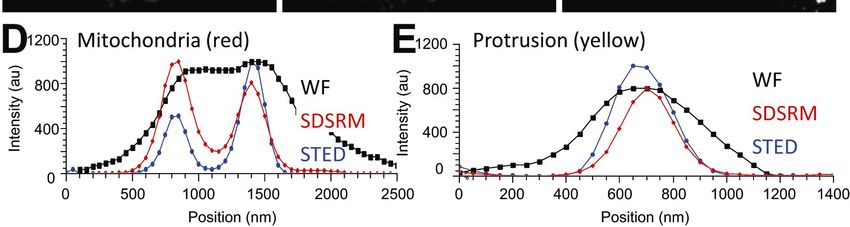
therefore, examined the mitochondria outer membrane first by staining with anti-
TOMM20 antibody (Figure 7). The lumen of the mitochondria was barely visible with
conventional WF image, but it is clearly observed with SDSRM as well as STED
(Figure 7D). Unexpectedly, the SR image of mitochondria outer membrane showed that
the size of the lumen of mitochondria is highly variable even in a single cell. We also
found thin protrusions from thick mitochondria. Only outer membrane is apparently
protruded, and the lumen is thin and unclear even with STED SR image (Figure 7E). In
addition to the mitochondria and the thin protrusions, many vesicular or tubular
structures were also stained with TOMM20 antibody. They would correspond to MDVs
as reported previously (Neuspiel et al., 2008).
We next expressed TOMM20-mEmerald and observed with SDSRM with 30 ms
exposure and 20 W/cm2 excitation. The 120 nm-resolution live imaging at video rate
with SDSRM enabled us to observe not only the mitochondria fusion event but also the
rapid dynamics of MDVs (Figure 8, Movie 3). The protrusions of the outer membrane
were highly dynamic: elongating, shrinking and branching. Sometimes a thin tubular
vesicle was released from the protrusion (yellow arrowhead in Figure 8), which suggest
that the protrusion would be pinched off to form MDV.
Discussion
In this study, we have demonstrated that the spinning disk confocal microscope has a
potential as an alternative implementation of SIM. Conventional SIM requires several
modulated images to retrieve SR components by demodulation in the Fourier space, but
it has higher photon efficiency, because the signal is retrieved without a mask. In
contrast, the confocal aperture works as a mask to demodulate the SR components in the
confocal microscope. In order to obtain stronger SR component signals, a smaller
confocal aperture is required. However this comes at the expense of signal intensity
because with a smaller confocal aperture, most of the photons from the sample are
rejected at the confocal aperture. Here, we have overcome this problem by specially
designing the mask pattern on the disk. The opening was narrowed to /5, while
keeping the aperture ratio as 30%. This aperture ratio is more than three times higher
than conventional spinning disk confocal, and this high light throughput enabled 100 Hz
SR imaging with moderate excitation power (20-40 W/cm2). Due to this high aperture
ratio, however, the optical sectioning capability is compromised. The stray light from
the out-of-the-focus specimen cannot be rejected efficiently, and the axial resolution is
close to the conventional WF imaging. The axial resolution can be enhanced by
reducing the aperture ratio, but at the expense of light throughput or the signal intensity.
Longer exposure time would be required.
Even with the high light throughput disk pattern, stronger excitation light was required
than typical fluorescent live cell imaging. Twice better resolution in 2D means 1/4
signal intensity per pixel, and only 30% of the signal passes through the disk to reach
the camera. Thus 12 times stronger signal is at least required. Furthermore, even higher
signal-to-noise ratio is required than conventional WF imaging, because the weak SR
components are enhanced by high-pass filtering, which can also enhance the noises. In
this study, therefore, most of the images were acquired with excitation light intensity of
6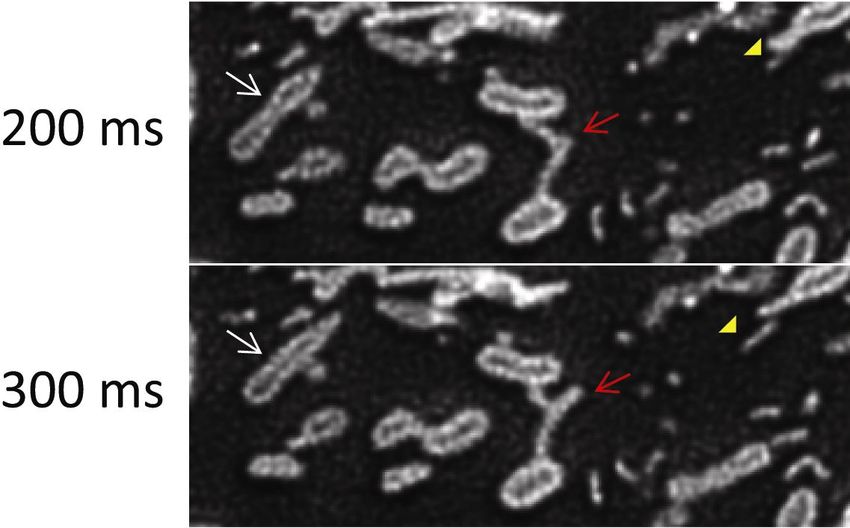
20-40 W/cm2, which is nearly 100 times stronger than typical fluorescent live cell
imaging (0.1-1 W/cm2). It should be noted, however, this excitation beam light
intensity is comparable to typical SIM imaging and more than 100 times weaker than
STED. Furthermore, the excitation light intensity can be further reduced for light
sensitive samples by elongating the exposure time, though the temporal resolution is
compromised.
As the applications of live cell SR imaging, we observed the dynamics of microtubules,
lysosomes, recycling endosomes, and mitochondria. The short exposure time (

For comparisons with WF, the disk was removed and a neutral density filter with a
transmission factor of 6% (ND6) was put into the illumination path to adjust the image
brightness. The image was projected onto the camera via a 5x magnifier and was taken
by 2x2 binning mode. Thus, the pixel size of the specimen is 43 nm with a 60x
objective lens, satisfying the Nyquist condition for up to 100 nm resolution. The
software package MetaMorph (Molecular Devices) was used to control the system and
acquisition of the image.
Cell culture, transfection
The cells were obtained from Health Science Research Resources Bank (Osaka, Japan)
and maintained at 37 oC in DMEM with 10% fetal bovine serum (Life Technologies) at
5% CO2. The cells were grown on glass cover slips (No 1S, Matsunami, Osaka, Japan)
for immunofluorescent staining. For live imaging, cells were transfected with
TransFectin (Bio-Rad) and plated onto a glass bottom dish (No 1.5, MatTek, Ashland,
MA). The medium was exchanged to L15 medium with 10% fetal bovine serum, but
without phenol red (Life Technologies) before imaging.
Immunofluorescent staining
For the microtubule staining (Figure 3), the cells were fixed with 2% paraformaldehyde
and 0.1% glutaraldehyde in 0.1 M cacodylate buffer and 4% sucrose for microtubule
staining, followed by the permeabilization with 0.5% Triton X-100. Non-specific
binding was blocked with 2% bovine serum albumin (BSA, Fraction V, Roche) before
staining with anti beta-tubulin antibody (MAB3408, Merck-Millipore) and AlelxaFluor
488-labeled secondary antibody (Life Technologies). For mitochondria staining (Figure
7), the cells were fixed with cold methanol (-20 oC), and stained with anti-TOMM20
antibody (ab56783, Abcam), followed by the AlexaFluor 488-labeled secondary
antibody. The stained cells were mounted with ProLong Gold (Life Technologies).
STED imaging
For confirmation of the subdiffraction structures, some samples were observed with a
STED microscope system (SP8-STED 3X, Leica) with the following settings. Acousto-
optic tunable filter was 3% for 480 nm (excitation) and 95% for 592 nm (depletion).
The gate for the detector was opened from 1.5 ns to 6 ns after excitation pulse. The
sample was scanned at 400 Hz with 8x line averaging. The pinhole was closed to 68 µm
(0.5 Airy unit at 520 nm).

ACKNOWLEDGMENTS
We are grateful to S. Niwa and N. Hirokawa (University of Tokyo) for the plasmids
(tubulin, Lamp1 and Rab11a); M. Davidson for the plasmid mEmerald-TOMM20-N-10
(addgene #54282); K. Abe (Olympus) for his discussion and assistance; S. Xu, J. Asada,
M. Komeno and M. Kakiuchi (QBiC) for their technical and secretarial assistance; and
D. Priest (QBiC) for editing the manuscript. Part of this work was supported by the
Ministry of Education, Science, Sports and Culture, Grant-in-Aid for Scientific

                                           8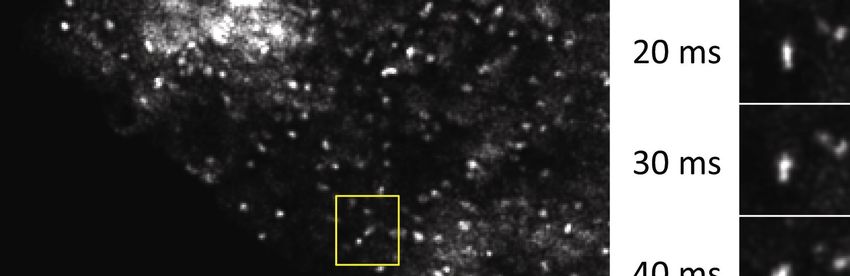
Research (KAKENHI) to Y.O (grant numbers 24659092, 25113723, 25293046) and by
the Uehara memorial Foundation to Y.O.
AUTHOR CONTRIBUTIONS
S.H. designed and built the microscope system through discussion with Y.O. Y.O.
prepared the samples, and did the experiments with S.H. S.H. and Y.O. co-wrote the
manuscript.
COMPETING INTEREST STATEMENT
S.H. is an employee of Olympus Corporation, which holds a patent regarding this SR
technique. Y.O. declares no competing financial interests.

REFERENCES

Abbe, E. (1873). Beiträge zur Theorie des Mikroskops und der mikroskopischen
Wahrnehmung. Arch Für Mikroskopische Anat 9, 413–418.

Allen, R. D., Travis, J. L., Hayden, J. H., Allen, N. S., Breuer, a. C., and Lewis, L. J.
(1982). Cytoplasmic Transport: Moving Ultrastructural Elements Common to Many
Cell Types Revealed by Video-enhanced Microscopy. Cold Spring Harb Symp Quant
Biol 46, 85–87.

Betzig, E., Patterson, G. H., Sougrat, R., Lindwasser, O. W., Olenych, S., Bonifacino, J.
S., Davidson, M. W., Lippincott-Schwartz, J., and Hess, H. F. (2006). Imaging
Intracellular Fluorescent Proteins at Nanometer Resolution. Science 313 , 1642–1645.

Heintzmann, R., and Cremer, C. G. (1999). Laterally modulated excitation microscopy:
improvement of resolution by using a diffraction grating. Proc. SPIE, 3568, 185–196.

Hell, S. W., and Wichmann, J. (1994). Breaking the diffraction resolution limit by
stimulated emission: stimulated-emission-depletion fluorescence microscopy. Opt Lett
19, 780.

Huang, B., Bates, M., and Zhuang, X. (2009). Super-resolution fluorescence
microscopy. Annu Rev Biochem 78, 993–1016.

Kner, P., Chhun, B. B., Griffis, E. R., Winoto, L., and Gustafsson, M. G. L. (2009).
Super-resolution video microscopy of live cells by structured illumination. Nat Methods
6, 339–342.

                                             9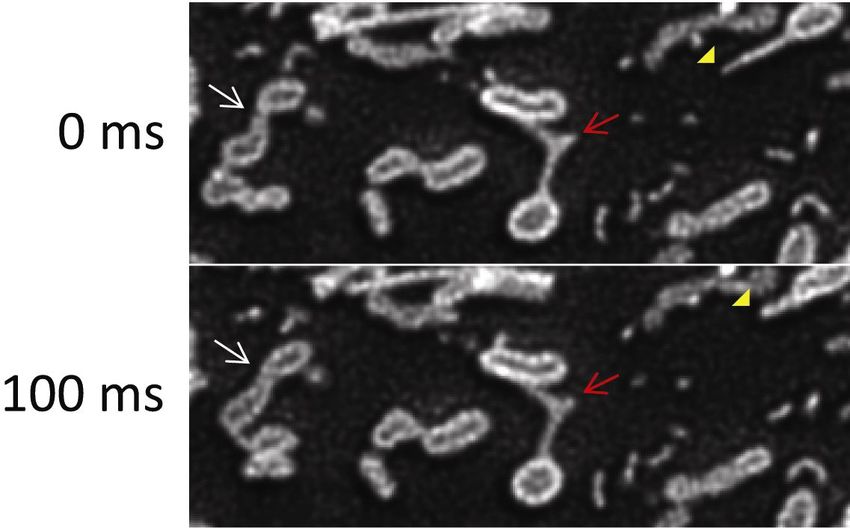
Neuspiel, M., Schauss, A. C., Braschi, E., Zunino, R., Rippstein, P., Rachubinski, R. A.,
Andrade-Navarro, M. A., and McBride, H. M. (2008). Cargo-Selected Transport from
the Mitochondria to Peroxisomes Is Mediated by Vesicular Carriers. Curr Biol 18, 102–
108.

Rust, M. J., Bates, M., and Zhuang, X. (2006). Sub-diffraction-limit imaging by
stochastic optical reconstruction microscopy (STORM). Nat Methods 3, 793–796.

Sheppard, C. J. R. (1988). Super-resolution in confocal imaging. Optik (Stuttg) 80, 53–
54.

Shimozawa, T. et al. (2013). Improving spinning disk confocal microscopy by
preventing pinhole cross-talk for intravital imaging. Proc Natl Acad Sci U S A 110,
3399–3404.

Südhof, T. C. (2013). Neurotransmitter release: the last millisecond in the life of a
synaptic vesicle. Neuron 80, 675–690.

York, A. G., Chandris, P., Nogare, D. D., Head, J., Wawrzusin, P., Fischer, R. S.,
Chitnis, A., and Shroff, H. (2013). Instant super-resolution imaging in live cells and
embryos via analog image processing. Nat Methods 10, 1122–1126.

York, A. G., Parekh, S. H., Dalle Nogare, D., Fischer, R. S., Temprine, K., Mione, M.,
Chitnis, A. B., Combs, C. a, and Shroff, H. (2012). Resolution doubling in live,
multicellular organisms via multifocal structured illumination microscopy. Nat Methods
9, 749–754.

                                            10
Figure 1. Principle of SIM and SDSRM. (A, B) Schematic comparison of SIM and
SDSRM. (C) Fourier transform of point spread function (PSF) of SIM, SIM (green),
is a weighted sum of WF (black) and its frequency f0 shifted SR components (red).
Here, fc denotes the cut-off frequency of conventional WF, and f0 denotes the spatial
frequency of the SIM illumination pattern. (D) Fourier transform of PSF of CF, CF
11(green), is a weighted sum of WF (black) and its frequency shifted components
(red). Here, f0 denotes the basic spatial frequency of the mask pattern, and fc’ denotes
the apparent cut-off frequency of CF. (E) With SDSRM, the stripe pattern is designed to
increase the SR component (red), and digital high pass filter (purple) further enhances
the SR component (blue). See supplement Fig S1 and S2 for detail.
12Figure 2 . Configurations for SDSRM. (A) System diagram. Excitation light from a
mercury lamp or a laser was introduced into the illumination port of a disk-scanning
unit (IX2-DSU, Olympus) attached to a microscope base (IX81, Olympus). The disk-
scanning unit has a retractable spinning disk and a six-position wheel for filter sets. The
spinning disk is rotated at 1,800 rpm. Slit patterns are drawn by electron lithography.
The intermediate image that passes through the disk is projected onto the image sensor
of the camera. (B, C) The pattern drawn on the spinning disk. The pattern has slit
openings of width w and pitch p (c). The slit orientation is modified to avoid stripe
pattern artifacts caused by overlap in the stripe orientation and disk rotation.
13Figure 3. Proof of concept experiments for the SR effect by SDSRM on microtubules in
PtK2 cells. (A-C) Conventional WF image with an NA 0.5 objective (UPLFL20X,
Olympus). (D-F) CF image with the NA 0.5 objective followed by deconvolution with
Richardson-Lucy algorithm. See supplement Fig S4 for results with other deconvolution
algorithms. (G-I) SDSRM image with the NA0.5 objective. (J-L) Conventional WF
image with an NA 0.95 objective (UPLSAPO40X2, Olympus). Panels B, E, H and K
show higher magnification views of panels A, D, G and J for the areas inside the
rectangle in (A). Panels C, F, I and L show pixel intensity across the microtubule bundle
14shown between the arrows in (B), and the corresponding Gaussian fits with estimated
full width at half maximum. Bars, 1 µm for A, D, G, J and 0.5 µm for B, E, H, K.
15Figure 4. SR live imaging of microtubules. (A) Conventional WF image of Vero cell
expressing tubulin-EYFP. A 60x objective with NA 1.35 (UPLSAPO60XO,
Olympus) was used for imaging. (B) SDSRM image of the same view field. The
excitation laser power on the sample was 20 W/cm2. The exposure time was 200 ms
with a conventional CCD camera, CoolSNAP HQ. The raw images were high pass
filtered to enhance the SR components. (C) Sectional plots of pixel intensities across a
single microtubule (1 in panel A). (D) Sectional plots of pixel intensities across a
microtubule doublet with an interval of 250 nm (2 in panel A). Bar, 2 µm. See Movie
1for movie.
16Figure 5. SDSRM images of rapidly moving lysosomes stained with Lamp1-EYFP.
Time lapse images were taken with a 60x NA 1.3 silicone oil immersion objective
(UPLSAPO60XS, Olympus), and a sCMOS camera (ORCA FLASH4.0 v2). The
excitation laser power on the sample was 100 W/cm2. The frame rate was 10 FPS with
20 ms exposure and 80 ms interval. The raw images were high pass filtered to enhance
the SR components, followed by deconvolution by CMLE algorithm (Huygens) to
reduce noise. The dynamics of two lysosomes are shown in the insets. Bars, 5 µm and 2
µm (insets). See Movie 2 for movie.
17Figure 6. SDSRM images of rapid dynamics of recycling endosomes stained with
Rab11a-venus. The images were taken with a 60x NA 1.3 silicone oil immersion
objective (UPLSAPO60XS, Olympus). The excitation laser power on the sample was
100 W/cm2. The frame rate was 100 FPS with 10 ms exposure. The raw images were
high pass filtered to enhance the SR components, followed by deconvolution by CMLE
algorithm (Huygens) to reduce noise. Seven consecutive frames of the yellow region in
panel A are shown in panel B, which shows the fusion and the following movement of
recycling endosomes. Bars, 5 µm (A) and 0.5 µm (B). See Movie 3 for movie.
18Figure 7. The outer membrane of mitochondria stained with anti-TOMM20 antibody.
(A) Conventional WF image. (B) SDSRM image. (C) STED image. (D, E) Sectional
plots of pixel intensities across thick mitochondria region (red, D), and thin protrusion
(yellow, E). Black, red and blue curves show conventional WF, SDSRM and STED,
respectively. WF (A) and SDSRM (B) images were taken with a 60x NA 1.3 silicone oil
immersion objective (UPLSAPO60XS, Olympus), STED image (C) were taken with a
100x NA1.40 objective (HC PL APO 100x/1.40 OIL STED WHITE, Leica). SDSRM
and STED images were post-processed by deconvolution (CMLE, Huygens) to reduce
noise and enhance contrast. Bar, 5 µm.
19Figure 8. Time lapse SDSRM images of the dynamics of the outer membrane of
mitochondria stained with TOMM20-mEmelard. The lumen of mitochondria is clearly
imaged during the fusion of two mitochondria (white arrow). The rapid dynamics of the
outer membrane protrusion (red arrow) and tubular vesicles released from the outer
membrane protrusion (yellow arrowhead) are also clearly recorded. The images were
taken with a 60x NA 1.3 silicone oil immersion objective (UPLSAPO60XS, Olympus).
The excitation laser power on the sample was 20 W/cm2. The frame rate was 10 FPS
20with 30 ms exposure and 70 ms interval. The raw images were high pass filtered to
enhance the SR components, followed by deconvolution by CMLE algorithm
(Huygens) to reduce noise (Fig S6). Bar, 2 µm. See Movie 4 for movie.
21You can also read