Knockdown of NANOG Reduces Cell Proliferation and Induces G0/G1 Cell Cycle Arrest in Human Adipose Stem Cells - MDPI
←
→
Page content transcription
If your browser does not render page correctly, please read the page content below
International Journal of
            Molecular Sciences

Article
Knockdown of NANOG Reduces Cell Proliferation
and Induces G0/G1 Cell Cycle Arrest in Human
Adipose Stem Cells
Maria Pitrone 1 , Giuseppe Pizzolanti 1,2, * , Antonina Coppola 1 , Laura Tomasello 1 ,
Stefania Martorana 3 , Gianni Pantuso 3 and Carla Giordano 1,2, *
 1    Aldo Galluzzo Laboratory of Regenerative Medicine, Department of Health Promotion Sciences,
      Maternal and Infant Care, Internal Medicine and Medical Specialties, PROMISE, University of Palermo,
      90127 Palermo, Italy; maria.pitrone@unipa.it (M.P.); antonina.coppola02@unipa.it (A.C.);
      laura.tomasello@unipa.it (L.T.)
 2    ATeN (Advanced Technologies Network Center), University of Palermo, 90127 Palermo, Italy
 3    Department of Surgical, Oncological and Oral Sciences, Division of General and Oncological Surgery,
      University of Palermo, 90127 Palermo, Italy; stefania.martorana@unipa.it (S.M.);
      gianni.pantuso@unipa.it (G.P.)
 *    Correspondence: giuseppe.pizzolanti@unipa.it (G.P.); carla.giordano@unipa.it (C.G.);
      Tel.: +39-091-6552138 (G.P.); +39-091-6552110 (C.G.); Fax: +39-091-6552138 (G.P.); +39-091-6552123 (C.G.)

 Received: 23 April 2019; Accepted: 23 May 2019; Published: 26 May 2019

 Abstract: The core components of regenerative medicine are stem cells with high self-renewal
 and tissue regeneration potentials. Adult stem cells can be obtained from many organs and
 tissues. NANOG, SOX2 and OCT4 represent the core regulatory network that suppresses
 differentiation-associated genes, maintaining the pluripotency of mesenchymal stem cells. The roles
 of NANOG in maintaining self-renewal and undifferentiated status of adult stem cells are still
 not perfectly established. In this study we define the effects of downregulation of NANOG in
 maintaining self-renewal and undifferentiated state in mesenchymal stem cells (MSCs) derived
 from subcutaneous adipose tissue (hASCs). hASCs were expanded and transfected in vitro with
 short hairpin Lentivirus targeting NANOG. Gene suppressions were achieved at both transcript
 and proteome levels. The effect of NANOG knockdown on proliferation after 10 passages and
 on the cell cycle was evaluated by proliferation assay, colony forming unit (CFU), qRT-PCR and
 cell cycle analysis by flow-cytometry. Moreover, NANOG involvement in differentiation ability
 was evaluated. We report that downregulation of NANOG revealed a decrease in the proliferation
 and differentiation rate, inducing cell cycle arrest by increasing p27/CDKN1B (Cyclin-dependent
 kinase inhibitor 1B) and p21/CDKN1A (Cyclin-dependent kinase inhibitor 1A) through p53 and
 regulate DLK1/PREF1. Furthermore, NANOG induced downregulation of DNMT1, a major DNA
 methyltransferase responsible for maintaining methylation status during DNA replication probably
 involved in cell cycle regulation. Our study confirms that NANOG regulates the complex transcription
 network of plasticity of the cells, inducing cell cycle arrest and reducing differentiation potential.

 Keywords: human adipose stem cell; NANOG; cell cycle regulation; DNMT1; lentiviral transduction

1. Introduction
    OCT4, SOX2 and NANOG are the actors in the complex machinery that regulate pluripotency of
mesenchymal stem cells [1]. Expression of OCT4 and NANOG is restricted to pluripotent cells,
and they are downregulated upon differentiation [2,3]. OCT4 and NANOG work together to
maintain pluripotency without LIF (Leukemia inhibitory factor) [4] and studies confirm that NANOG

Int. J. Mol. Sci. 2019, 20, 2580; doi:10.3390/ijms20102580                             www.mdpi.com/journal/ijms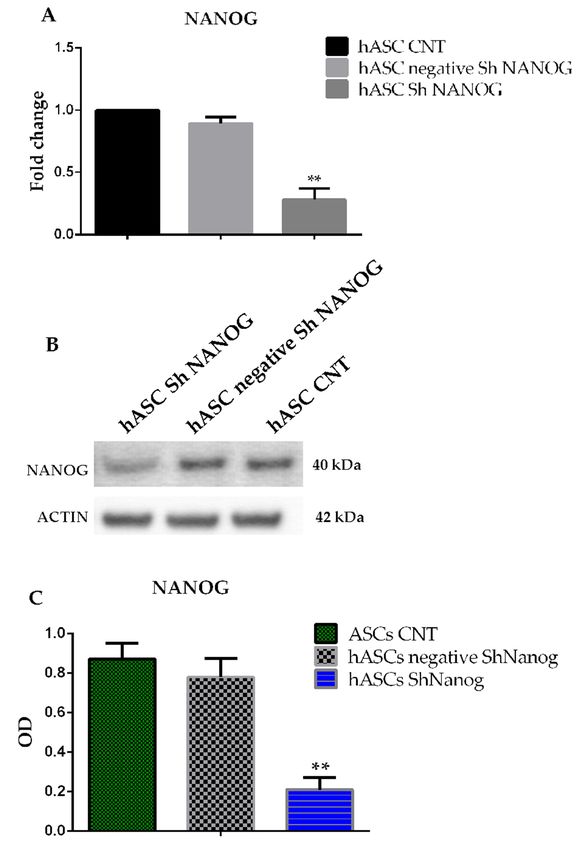
Int. J. Mol. Sci. 2019, 20, 2580                                                                     2 of 12

downregulation induces ESCs (Embryonic stem cell) differentiation into extraembryonic lineages [5,6].
Wang et al. showed that OCT4 and NANOG maintain self-renewal and block differentiation in ESCs [7];
however, little is known about their mechanism in adult mesenchymal stem cells. Adipose stem cells
(ASCs) represent an alternative source of mesenchymal stem cells that can be easily and safely obtained
from adipose tissue, growing under appropriate culture conditions for a long time [8–10]. As previously
shown, ASCs express CD29, CD90, CD105 and CD73 and are negative for the hematopoietic endothelial
markers CD34, CD45, CD117, and HLA-DR [11–14]. Nowadays, it is more important to understand
the mechanisms through which maintain the proliferation, differentiation and heterogeneity of these
cells [15,16]. OCT4, SOX2 and NANOG have also been suggested to play a similar role as embryonic
stem cells in adult mesenchymal cells, including human Adipose Stem Cells (hASCs). In our previous
studies, we found that the embryonic stem cell marker NANOG is over-expressed in MSCs derived
from adipose tissue and its silencing with a RNA interference technology causes downregulation of
OCT4 and SOX2 gene expression [13], confirming recent studies that have demonstrated a central role
of NANOG in regulating stem cells’ multipotent properties [15,17].
      DLK1 (PREF1) is a marker used to characterized mouse preadipocyte progenitors which inhibits
adipogenesis, suppressing C/EBPβ and C/EBPδ gene expression [18–23]. Recently, DLK1 (PREF1) proved
to be a useful marker for human ASCs [24,25] and methylation regulates its expression. One of the
DNA methyltransferase that regulates the DNA methylation during replication is the DNMT1 [25] and
ESCs differentiation and embryo development are regulate by DNA methylation. A recent study [26]
demonstrated that NANOG directly binds to the promoter of DNMT1 [26] and enhances its expression.
In this study, our aim was to investigate the role of NANOG in maintaining the proliferation and
differentiation potential of ASCs after downregulation of NANOG with a Lentivirus system and to
examine the expression of some important genes related to cell growth control such as p27/CDKN1B,
p21/CDKN1A, CCDN1 and PREF1. We show that NANOG downregulation induced a decrease in the
proliferation rate and differentiation potential and led to cell cycle arrest in G0/G1 by regulating CCDN1,
p21/CDKN1A and p27/CDKN1B through p53 and a PREF1 inhibition, inducing loss of pluripotency
via DNMT1.

2. Results

2.1. hASC Isolation and Characterization
     Enzymatic digestion of biopsied human adipose tissue was obtained after consent from 20 patients
(nine men and 11 women; age 45 ± 10 years; with body mass index (BMI) range 28 ± 3) undergoing
elective open-abdominal surgery. As previously published, hASC highly expressed THY1, CD105
and CD73 and all of the ESC markers SOX-2, OCT4 and NANOG (see Table S1 in Supplementary).
When cultured in adhesion we observed the formation of colonies of fibroblastic-like cells, whereas in
low-adhesion culture conditions spheres were formed (Figure 1).

2.2. Knockdown of NANOG Silencing by Lentivirus
     To evaluate the roles of NANOG in maintaining stem cell properties we studied changes in
stem cell marker gene expression in hASCs lentiviral transducted with shRNA against NANOG.
The mRNA and protein expression level of NANOG after 10 and 15 days of antibiotic selection
after shRNA infection was evaluated by quantitative PCR and western blot analysis. As observed
in Figure 2A, the NANOG mRNA level decreased by almost 90 ± 3.5% in cell lines infected with
NANOG shRNA lentivirus as compared to the control group (hASCs CNT, freshly isolated hASCs at
passage 4, and hASCs transducted with scrambled shRNA against NANOG, hASC negative shRNA
NANOG). Furthermore, Figure 2B showed the downregulation of NANOG protein expression after
15-day antibiotic selection, by almost 76 ± 2.3% in hASCs infected with NANOG shRNA lentivirus
(Optical Density (OD) = 0.87 ± 0.9 versus 0.2 ± 0.06). The quantitative analysis of western blot bands
was performed using ImageJ. In our previous studies we found that the embryonic stem cell marker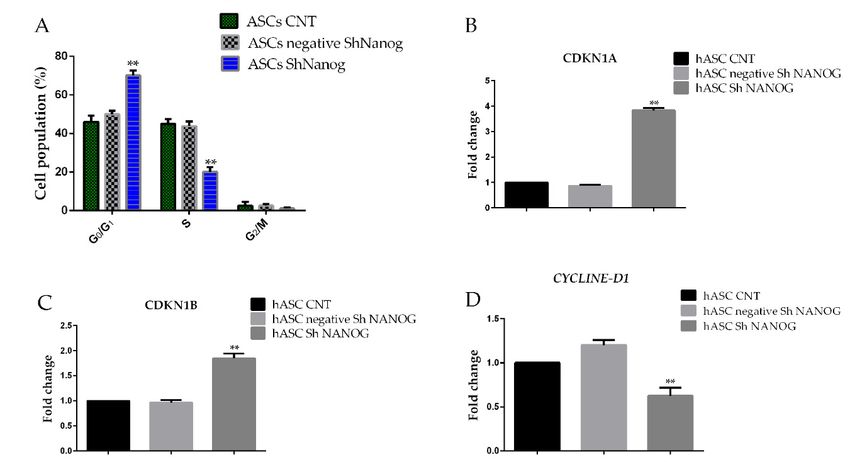
Int. J. Mol. Sci. 2019, 20, 2580                                                                            3 of 12

        NANOG is over-expressed in hASCs and its silencing causes downregulation of the OCT4 and SOX2
        genes. As assessed by real-time RT-PCR, we confirm that NANOG mRNA in freshly hASC is highly
        expressed
Int. J. Mol.            20, xNANOG
             Sci. 2019,and    FOR PEERknockdown
                                       REVIEW   induces OCT4 and SOX2 downregulation, indicating loss 3ofof 13
        pluripotency in hASCs (data shown in Supplementary Materials).

           Figure 1. hASC morphology on day 5 (A) of expansion culture observed under light microscopy (10×)
     Figure   1. phase
           with  hASCcontrast
                         morphology      on day
                                 with a Nikon     5 (A)CCD
                                                DS-FI1   of expansion
                                                            camera. Scale  bar = 10µm.
                                                                         culture  observed   underthe
                                                                                        (B) Shows   light microscopy
                                                                                                       formation of
     (10×) hASC
            with colonies   when cultured
                  phase contrast      with ina adhesion, Scale bar
                                               Nikon DS-FI1     CCD= 10µm,  whileScale
                                                                       camera.    (C) shows
                                                                                        bar =spheres
                                                                                               10μm.which   formed the
                                                                                                       (B) Shows
           when   hASCs   were  cultured  in low adhesion  culture conditions, Scale bar = 10µm.  A
     formation of hASC colonies when cultured in adhesion, Scale bar = 10μm, while (C) shows spheres representative
     whichexperiment
             formed whenreferring to 23 samples studied. (D) qRT-PCR analysis in freshly isolated hASCs at passage
                              hASCs were cultured in low adhesion culture conditions, Scale bar = 10μm. A
           4 of THY1, CD73, CD105, OCT4, SOX2 and NANOG gene expression compared to ASC52telo, hTERT
     representative experiment referring to 23 samples studied. (D) qRT-PCR analysis in freshly isolated
           immortalized adipose-derived mesenchymal stem cells. Data shown are relative to an endogenous
     hASCs at passage 4 of THY1, CD73, CD105, OCT4, SOX2 and NANOG gene                      expression compared to
           control (beta-Actin). Relative expression levels were assessed using the 2−∆∆Ct method. Values are
     ASC52telo,
           shown hTERT      immortalized
                   as the mean               adipose-derived
                                 ± SE. Data are                 mesenchymal
                                                representative of               stemexperiments.
                                                                  three independent   cells. Data shown are relative
     to an endogenous control (beta-Actin). Relative expression levels were assessed using the 2−ΔΔCt
     method. Values are shown as the mean ± SE. Data are representative of three independent
     experiments.

2.2. Knockdown of NANOG Silencing by Lentivirus
    To evaluate the roles of NANOG in maintaining stem cell properties we studied changes in
stem cell marker gene expression in hASCs lentiviral transducted with shRNA against NANOG.
The mRNA and protein expression level of NANOG after 10 and 15 days of antibiotic selection after
shRNA infection was evaluated by quantitative PCR and western blot analysis. As observed in
Figure 2A, the NANOG mRNA level decreased by almost 90 ± 3.5% in cell lines infected with
NANOG shRNA lentivirus as compared to the control group (hASCs CNT, freshly isolated hASCs
at passage 4, and hASCs transducted with scrambled shRNA against NANOG, hASC negative
shRNA NANOG). Furthermore, Figure 2B showed the downregulation of NANOG protein
expression after 15-day antibiotic selection, by almost 76 ± 2.3% in hASCs infected with NANOG
shRNA lentivirus (Optical Density (OD) = 0.87 ± 0.9 versus 0.2 ± 0.06). The quantitative analysis of
Int. J. Mol. Sci. 2019, 20, 2580 4 of 12
Int. J. Mol. Sci. 2019, 20, x FOR PEER REVIEW 4 of 13
Figure 2. Freshly isolated hASCs at passage 4 (hASCs CNT), hASCs lentivirally transducted with
Figure 2. Freshly isolated hASCs at passage 4 (hASCs CNT), hASCs lentivirally transducted with
scrambled (negative) or shRNA against NANOG. (A) qRT-PCR analysis for NANOG gene expression
scrambled (negative) or shRNA against NANOG. (A) qRT-PCR analysis for NANOG gene
after 10-day antibiotic
expression selection.
after 10-day Relative
antibiotic expression
selection. Relativelevels were levels
expression assessed
wereusing the 2−∆∆Ct
assessed using the method.
Data are2 representative
−ΔΔCt of three independent experiments with the fold change compared
method. Data are representative of three independent experiments with the fold change to expression
levels in a commercial
compared humanlevels
to expression adipose
in a stem cell line
commercial (ASC52telo,
human hTERT
adipose stem cellimmortalized
line (ASC52telo,adipose-derived
hTERT
immortalized
mesenchymal stemadipose-derived
cells). Values aremesenchymal
shown asstem cells). Values
the mean ± SE, ** < 0.01.as(B,C)
arepshown the mean ± SE, **
Western p < analysis
blot
0.01. (B,C) Western blot analysis for protein expression of NANOG after 15 days
for protein expression of NANOG after 15 days of antibiotic selection. Values are shown as mean ± SE, of antibiotic
selection. Values are shown as mean ± SE, ** p < 0.01.
** p < 0.01.
2.3. Analysis of PREF1
In order better to understand the differentiation potential of hASCs biology, we studied the effect
of NANOG shRNA knockdown on DLK1/PREF1 gene expression. We found that PREF1 mRNA was
downregulated (0.8 ± 0.03 versus 0.3 ± 0.06, p < 0.01) in hASCs with NANOG downregulated (Figure 3).2.3. Analysis of PREF1
In order better to understand the differentiation potential of hASCs biology, we studied the
effect of NANOG shRNA knockdown on DLK1/PREF1 gene expression. We found that PREF1
mRNA was downregulated (0.8 ± 0.03 versus 0.3 ± 0.06, p < 0.01) in hASCs with NANOG
downregulated
Int. J. Mol. Sci. 2019,(Figure
20, 2580 3). 5 of 12
qRT-PCR
Figure 3.3.qRT-PCR
Figure analysis
analysis of PREF1
of PREF1 genegene expression
expression in freshly
in freshly isolated
isolated hASCshASCs at passage
at passage 4 (hASCs4
(hASCs CNT), hASCs lentivirally transducted with scrambled (negative) and shRNA against NANOG
CNT), hASCs lentivirally transducted with scrambled (negative) and shRNA against NANOG
(hASCs sh NANOG). PREF1 was significantly downregulated in hASCs sh NANOG. Relative expression
(hASCs sh NANOG). PREF1 was significantly downregulated in hASCs sh NANOG. Relative
levels were assessed using the 2−∆∆Ct method. Data are representative of three independent experiments
expression levels were assessed using the 2−ΔΔCt method. Data are representative of three
with the fold change compared to expression levels in a commercial human adipose stem cell line
independent experiments with the fold change compared to expression levels in a commercial
(ASC52telo, hTERT immortalized adipose-derived mesenchymal stem cell). The experiment was
human adipose stem cell line (ASC52telo, hTERT immortalized adipose-derived mesenchymal stem
repeated at least three times ** p < 0.01.
cell). The experiment was repeated at least three times ** p < 0.01.
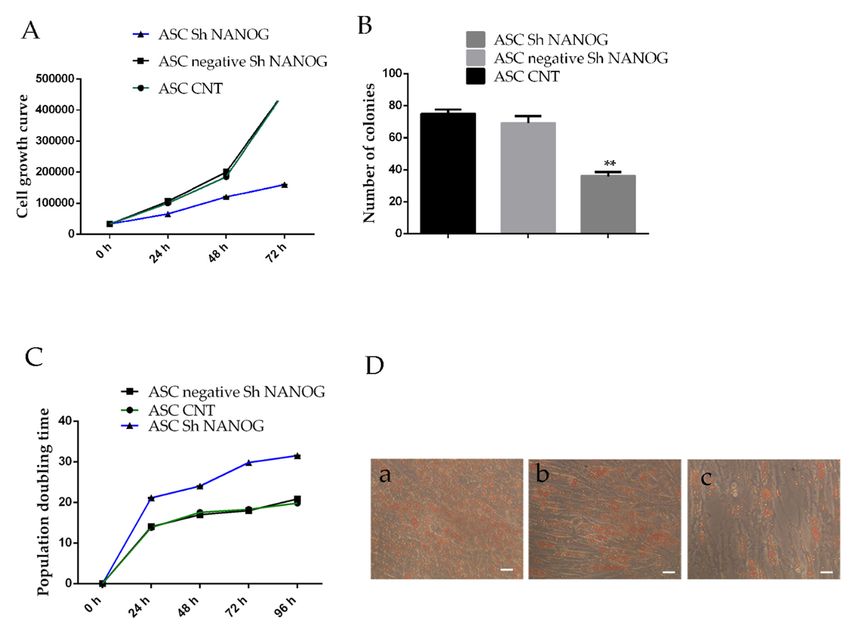
2.4. Downregulation of NANOG Inhibited Cell Proliferation, Increased Population Doubling Time and Reduced
2.4. Downregulation
Differentiation of NANOG Inhibited Cell Proliferation, Increased Population Doubling Time and
Potential
Reduced Differentiation Potential
The effects of NANOG knockdown on ASCs proliferation were assessed using trypan blue assay
The effects
and Colony of NANOG
Forming knockdown
Unit ability. on ASCs analysis
Cell proliferation proliferation
showswere that assessed
the hASCs using trypan blue
transducted with
assay and Colony Forming Unit ability. Cell proliferation analysis shows
shRNA against NANOG grew significantly more slowly than wild-type cells and control cells, and after that the hASCs
transducted with
three days, this shRNA against
difference became NANOG
more evident grew(Figure
significantly more slowly than
4A). Downregulation wild-type
of NANOG cells and
reduces the
control cells, and after three days, this difference became more
number of the colonies. As shown in Figure 4B, the clonogenicity of ASCs transfected with shRNAevident (Figure 4A).
Downregulation
lentivirus NANOG ofdecreased,
NANOG reduces
accordingthe number
to the numberof of
thecell
colonies.
colonies.As Theshown
colonyinformation
Figure 4B, ratethe
of
clonogenicity of ASCs transfected
NANOG shRNA-infected cells was 8.5with shRNA
± 3.6%, lowerlentivirus
than thatNANOG
of freshlydecreased, according
isolated hASCs to the4
at passage
number of cell and
(hASCs CNT) colonies. The colony
scrambled sh NANOGformation rate ofcells
tranfected NANOG(hASCsshRNA-infected cells was(**
negative sh NANOG) 8.5p±Int. J. Mol. Sci. 2019, 20, 2580 6 of 12
negative sh NANOG and freshly isolated hASCs at passage 4 (hASCs CNT) (0.85 ± 0.05). Significant
downexpression CYCLINE
of 20,
Int. J. Mol. Sci. 2019, D1
x FOR PEER in mRNA levels was detected (0.63 ± 0.09-fc, ** p < 0.01).6 of 13
REVIEW
Figure 4. Time-dependent
Figure 4. Time-dependent effects of downregulation
effects of downregulationof NANOG
of NANOG on hASCs growth,
on hASCs colonycolony
growth, formation
ability,
formation ability, population doubling time and differentiation potential. (A) Shows the cell growthover a
population doubling time and differentiation potential. (A) Shows the cell growth rate
72-h rate
period
overinafreshly isolated
72-h period hASCsisolated
in freshly at passage
hASCs4 (ASC CNT),4hASCs
at passage lentivirally
(ASC CNT), hASCstransduced
lentivirally with
transduced
scrambled with NANOG)
(negative scrambled or (negative
shRNANANOG) or shRNA
against NANOG against
using theNANOG
trypan blueusing the trypan
viability assay.blue
(B) The
cloneviability
numbers assay. (B) The
(more thanclone numbers
50 cells) (more
of the thanisolated
freshly 50 cells) hASCs
of the freshly isolated
at passage hASCsCNT)
4 (ASC at passage 4
and hASCs
(ASCSh
negative CNT)
NANOGand hASCs negative
were much Sh NANOG
higher were
than that much
of the higher
hASCs than that (75
sh NANOG of the
± 5hASCs
versussh40NANOG
± 5). (C) The
(75 ± 5 doubling
population versus 40 ±time
5). (C) The population
analysis. (D) Showsdoubling time analysis.potential
the differentiation (D) Shows theadipogenic
into differentiation
lineage:
potential into adipogenic lineage: (a) hASCs at passage 4 differentiated into adipocytes, (b) hASCs
(a) hASCs at passage 4 differentiated into adipocytes, (b) hASCs scrambled sh NANOG tranfected cells
scrambled sh NANOG tranfected cells (hASCs negative sh NANOG) differentiated into adipocytes
(hASCs negative sh NANOG) differentiated into adipocytes and (c) hASCs lentivirally transducted with
and (c) hASCs lentivirally transducted with shRNA against NANOG differentiated into adipocytes.
shRNA against NANOG differentiated into adipocytes. Cultures were observed under light microscopy
Cultures were observed under light microscopy (10×) with phase contrast with a Nikon DS-FI1 CCD
(10×)camera.
with phase
scale contrast
bar=10μmwith a Nikon
(Values DS-FI1
are mean CCD
± SD, ** camera.
p < 0.01).scale bar=10µm (Values
A representative photograph of the ± SD,
are mean
** pdependent kinase inhibitor 1B) p21/CDKN1A (Cyclin-dependent kinase inhibitor 1A) and CYCLINE
D1 by qRT-PCR. Interestingly, as shown in Figure 5, knockdown of NANOG in hASCs increased
expression of the CDKN1B and CDKN1A (1.8 ± 0.08-fc and 3.8±0.05-fc, respectively, ** p < 0.01)
mRNA level when compared to the negative sh NANOG and freshly isolated hASCs at passage 4
(hASCs CNT) (0.85 ± 0.05). Significant downexpression of CYCLINE D1 in mRNA levels was
Int. J. Mol. Sci. 2019, 20, 2580 7 of 12
detected (0.63 ± 0.09-fc, ** p < 0.01).
Figure 5. Changes
Figure 5. Changes in hASCs cellcell
in hASCs cycle distribution
cycle distributionas as
a result of NANOG
a result of NANOG downregulation.
downregulation.(A) (A)Shows
cell Shows cell cycle distribution
cycle distribution of hASCsofaccording
hASCs according to Nicoletti’s
to Nicoletti’s protocol.
protocol. (B) (C)
(B) and andReal-time
(C) Real-time
PCRPCRanalyses
analyses showed that expression of the cell cycle protein CDKN1A and CDKN1B
showed that expression of the cell cycle protein CDKN1A and CDKN1B were significantly increased in were significantly
hASCs increased in hASCsdownregulated
with NANOG with NANOG downregulated while the
while the expression expressionD1
of CYCLINE of was
CYCLINE D1 was (D).
downregulated
downregulated (D). Flow cytometry analyses showed that downregulation of NANOG induced a
Flow cytometry analyses showed that downregulation of NANOG induced a decrease in the proportion
decrease in the proportion of G2/M + S phase cells in hASCs sh NANOG as compared to freshly
of G2/M + S phase cells in hASCs sh NANOG as compared to freshly isolated hASCs at passage 4
isolated hASCs at passage 4 (hASCs CNT). All experiments were repeated at least three times.
Int. J. Mol.CNT).
(hASCs Sci. 2019,
All20,experiments were repeated at least three times. (Values are mean ± SD, ** pInt. J. Mol. Sci. 2019, 20, 2580 8 of 12
3. Discussion
The properties of stem cells are indicated as the ability to proliferate and to preserve an
undifferentiated state and the capacity to differentiate toward multiple cell lineages. It is well
known that SOX2 OCT4 and NANOG are the core of “pluripotency” machinery. Our previous study
suggested that NANOG is an essential transcriptional regulator of genes involved in maintaining
undifferentiated pluripotent state of hASCs, but few data exist to conclude that the hASCs fate and
differentiation potential are regulated by this protein. In this study hASCs were isolated from biopsies
of subcutaneous adipose tissue undergoing elective open-abdominal surgery and were characterized
for stem cell markers CD90, CD105 and CD73, and then, cells were transducted with short hairpin
Lentivirus system targeting NANOG, which resulted in significant downregulation of NANOG gene
and protein expression. Inhibition of NANOG led to a significant downregulation of OCT4 and
SOX2, as previously demonstrated [13], and we were able to detect a decrease in expression of the
adipose stem cell marker DLK/PREF1. Knockdown of NANOG in hASCs reduced cell proliferation
rate and differentiation potential, inducing cell cycle arrest in G0/G1. p21/CDKN1A and p27/CDKN1B
are proteins of the Cip/Kip family that act as key cell cycle regulators by inhibiting CDK [27,28].
To understand the roles of NANOG in cell cycle arrest, we examined p21 and p27 gene expression.
We demonstrate that downregulation of NANOG in hASCs induced an increase of p27 and p21
gene expression. Recent studies have identified CDK1 as an essential in vivo target of p27 [29] and
our in vitro study confirms that CCND1 gene expression is reduced. It is well known that p21 and
p27 expression is regulated largely at the transcriptional level by a p53-dependent mechanism [30],
which suggests that NANOG may regulate expression of these “player” genes through the p53 tumor
suppressor gene. Our experiments confirmed that NANOG downregulation induced a reduction of
p53 gene expression, suggesting that NANOG can regulate p21 and p27 activity through p53 activity.
Furthermore, it is well known that p21 and p27 are regulated by methylation [31,32] and DNA
methylation regulate the expression of appropriate genes in ESCs [31]. Previous experiments have
shown in methylation-deficient mouse embryos (DNMT1−/− , DNMT3a−/− and DNMT3b−/− ) that the
restoring of DNA methylation is essential for development [31–33]. One of the most important DNA
methyltransferases is DNMT1, which is responsible for maintaining methylation status during DNA
replication, and a recent study demonstrated that NANOG directly binds to the promoter of DNMT1
in ESCs and enhances its expression [26]. To determine whether NANOG-mediated maintenance of
stem cell properties in hASC came about through regulation of DNMT1, we evaluated DNMT1 protein
expression. The results confirm that NANOG downregulation induced a reduction of DNMT1 protein
expression. In conclusion, our results demonstrate that inhibition of NANOG not only decreased
hASCs growth and induced the arrest of the cell cycle, but also induced a reduction of differentiation
ability. Moreover, our results confirm that the stem cell transcription factor NANOG regulated cell
cycle progression probably via p53, which directly controls p21 and p27, key regulator factors of
cell cycle machinery. Furthermore, through DNMT1 NANOG can methylate PREF1, which induces
differentiation and can modulate the methylation status of p21 and p27 as previously described.
All these data suggest that NANOG is essential for maintaining hASCs properties.
4. Materials and Methods
4.1. Cell Culture and Cell Infection with Lentiviral Particles
Subcutaneous (SAT) adipose tissue biopsies were obtained from 23 consenting patients (10 men,
13 women; age 40 ± 10; BMI range between 28 ± 3) undergoing elective open-abdominal and laparoscopy
surgery. The protocol was approved by the Independent Ethical Committee (no. 08/2018; 27 August
2018) at the P. Giaccone Azienda Ospedaliera Universitaria Policlinico, Palermo, Italy. All patients gave
their written informed consent. Adipose tissue was processed as previously described [13]. Primary
cells were used at passage 4 for all experiments. The commercial primary cell line immortalized
with a human telomerase reverse transcriptase (ASC52telo, hTERT) (ATCC®SCRC-4000™, AmericanInt. J. Mol. Sci. 2019, 20, 2580 9 of 12
Type Culture Collection, Manassas, VA, USA) was cultured in Mesenchymal Stem Cell Basal Medium
(ATCC PCS-500-030).supplemented with Mesenchymal Stem Cell Growth Kit (ATCC PCS-500-040,
LGC Standards, Milan, Italy). For lentivirus infection, 2 × 10⁴ hASCs were seeded in six-well plates, and
infected with lentivirus (sc-43958-V, Santa Cruz Biotechnology, DBA, Milan, Italy with a the multiplicity
of infection (MOI) 10 in the presence of 8 µg/mL polybrene (sc-134220, Santa Cruz Biotechnology).
At 24 h after infection, the media were removed and replaced with fresh growth media. After 48 h
the media were replaced with fresh growth media containing puromycin (1 µg/mL, cod. P9620,
Sigma Aldrich, Milan, Italy) to select for infected cells. All experiments were performed 10–15 days
after puromycin selection.
4.2. RNA Isolation and Quantitative RT-PCR
RNA was isolated in columns from subconfluent cultures of hASC by RNeasy kit (Qiagen,
Hamburg, Germany) as previously described [13]. Gene expression was normalized for the
housekeeping gene beta-actin (Invitrogen, Milan, Italy). Amplification of specific transcripts was
confirmed by melting curve profiles at the end of each PCR. PCR primers NANOG (QT01844808), OCT3/4
(QT00210840), SOX2 (QT00237601), THY1 (QT00023569), CD105 (QT00013335), CD73 (QT00027279), p53
(QT00060235), CCDN1 (QT00495285), CDKN1A (QT00062090), CDKN1B (QT00998445) were purchased
from Qiagen (QuantiTect ®Primer Assays, Qiagen, Hamburg, Germany), β-Actin (FORWARD:
50 -GGACTT CGA GCA AGA GAT GG-30 REVERSE: 50 -AGC ACT GTG TTG GCG TAC AG-30 )
was purchased from Invitrogen. All reactions were performed using the Quantitect SYBR Green
PCR Kit (cod. 204243, Qiagen) on the RotorGene Q Instrument (Qiagen) as previously described.
Gene expression of primary cells was compared with a commercial primary cell line immortalized
with a human telomerase reverse transcriptase (ASC52telo, hTERT) ATCC®SCRC-4000™, American
Type Culture Collection, Manassas, VA, USA), as positive cell controls. Relative expression levels for
each gene were assessed using the 2−∆∆Ct method. The results were represented as histograms with
GraphPad Prism 6 Software (GraphPad Software, Inc., La Jolla, CA, USA). qRT-PCR analyses for the
stem gene were also performed after lentivirus infection experiments.
4.3. Western Blot Analysis
Proteins were extracted from adherent cultured cells and separated as previously
described [13,34,35]. The antibodies used are as described in Table 1. The secondary antibody was
goat anti-mouse IgG-HRP (Amersham, GE Healthcare Europe GmbH, Milan, Italy). Antigen-antibody
complexes were visualized using the ECL prime (Amersham, GE Healthcare Europe GmbH, Milan,
Italy) on a CCD camera (Chemidoc, Bio-Rad, Milan, Italy). Western blot bands were quantified
with ImageJ 1.48 software (National Institutes of Health, Bethesda, MD, USA) and the results were
represented as histograms with GraphPad Prism 6 Software (GraphPad Software, Inc., La Jolla,
CA, USA).
Table 1. Primary antibodies used.
Primary Antibody/Localization Marker Code Number Diluition Incubation
NANOG, nuclear and cytoplasmatic sc-293121, Santa Cruz Biotechnology 1:500 o/n, 4 ◦ C
DNMT1, nuclear sc-271729, Santa Cruz Biotechnology 1:500 o/n, 4 ◦ C
B-Actin clone AC-74 A5316, Sigma Aldrich 1:10,000 o/n, 4 ◦ C
4.4. Analysis of Cell Cycle Status of MSCs with Lentivirus
Single-cell suspensions of control samples and transfected samples were obtained and seeded
at a density of 2 × 10³ cells/cm2 (passage 3), and the DNA content was assessed according to
Nicoletti’s protocol [36] as previously described [13]. Data were acquired with CellQuest Pro softwareInt. J. Mol. Sci. 2019, 20, 2580 10 of 12
(Becton Dickinson, Milan, Italy) and the percentages of G1, S and G2 phase cells were calculated with
the MODFIT-LT 5.0 software program (Verity Software House Inc., Topsham, ME, USA).
4.5. Colony-Forming Assay
Single-cell suspension ASCs cell lines were seeded in a six-well culture in DMEM/Ham’s F12 1:1
supplemented with 100 unit/mL penicillin, 0.1 mg/mL streptomycin and 10% fetal calf serum (FCS) at
a density of 300 cells/well and cultured at 37 ◦ C in 5% CO2 . After 14 days, the cells were fixed in 4%
paraformaldehyde (Sigma Aldrich) and stained with 0.1% crystal violet (Sigma Aldrich). Only the
cell groups containing more than 50 cells were considered as colonies. Numbers of colonies were
quantified with ImageJ 1.48 software (National Institutes of Health, Bethesda, MD, USA).
4.6. Population Doubling and Cell Proliferation Curve
Cell proliferation curve and population doubling time were assessed as previously described [35].
The doubling time (DT) was calculated in accordance with the literature data (http://www.doubling-
time.com/compute.php). Three sets of experiments for each sample were used for calculations.
5. Conclusions
We examined whether NANOG contributes to maintaining cells in an undifferentiated, pluripotent
state by activating certain key genes and by silencing others. For this purpose, hASCs were transfected
with a lentivirus with shRNA targeting NANOG and our results suggest that NANOG plays a key
role in the hASCs proliferation rate by increasing the expression of p21 and p27 and by modulating
PREF1. In conclusion, we confirm that NANOG is an important player in the complex transcription
network that regulates pluripotency. We hypothesized that p21, p27 and PREF1 may be regulated by
DNMT1, a promotor that is directly bound by NANOG, as demonstrated by Tsai et al. [26]. Further
experiments are needed to establish the pathway to explain the involvement of NANOG in the control
of cell cycle progression.
Supplementary Materials: Supplementary Materials can be found at http://www.mdpi.com/1422-0067/20/10/
2580/s1.
Author Contributions: M.P. was responsible for the conception of the work and the design, collection and
assembly of data, data analysis and interpretation and manuscript writing. G.P. (Giuseppe Pizzolanti) was
responsible for acquisition of data and revision of the manuscript. S.M. and G.P. (Gianni Pantuso) were responsible
for provision of biopsies. M.P., G.P. (Giuseppe Pizzolanti), L.T. and A.C. were responsible for data analysis and
interpretation and drafting of the manuscript. C.G. was responsible for the conception of the work and the design,
data analysis and interpretation, manuscript writing and final approval of the manuscript, manuscript drafting,
and critically revision for important intellectual content and financial support. All authors agree to be accountable
for all aspects of the work in ensuring that questions related to the accuracy or integrity of any part of the work
are appropriately investigated and resolved. All authors read and approved the final manuscript.
Funding: FFR2018 to C.G.
Acknowledgments: This work is dedicated to our laboratory staff.
Conflicts of Interest: The authors declare no conflict of interest.
Abbreviations
MSC Mesenchymal Stem Cell
hASC human Adipose Stem Cell
p21/CDKN1A Cyclin-dependent kinase inhibitor 1A
p27/CDKN1B Cyclin-dependent kinase inhibitor 1BInt. J. Mol. Sci. 2019, 20, 2580 11 of 12
References
1. Boyer, L.A.; Lee, T.I.; Cole, M.F.; Johnstone, S.E.; Levine, S.S.; Zucker, J.P.; Guenther, M.G.; Kumar, R.M.;
Murray, H.L.; Jenner, R.G.; et al. Core transcriptional regulatory circuitry in human embryonic stem cells.
Cell 2005, 122, 947–956. [CrossRef] [PubMed]
2. Pan, G.; Thomson, J.A. Nanog and transcriptional networks in embryonic stem cell pluripotency. Cell Res.
2007, 17, 42–49. [CrossRef]
3. Kim, J.; Chu, J.; Shen, X.; Wang, J.; Orkin, S.H. An Extended Transcriptional Network for Pluripotency of
Embryonic Stem Cells. Cell 2008, 132, 1049–1061. [CrossRef] [PubMed]
4. Darr, H. Overexpression of NANOG in human ES cells enables feeder-free growth while inducing primitive
ectoderm features. Development 2006, 133, 1193–1201. [CrossRef]
5. Hough, S.R.; Clements, I.; Welch, P.J.; Wiederholt, K.A. Differentiation of Mouse Embryonic Stem Cells
after RNA Interference-Mediated Silencing of OCT4 and Nanog. Stem Cells 2006, 24, 1467–1475. [CrossRef]
[PubMed]
6. Hyslop, L.; Stojkovic, M.; Armstrong, L.; Walter, T.; Stojkovic, P.; Przyborski, S.; Herbert, M.; Murdoch, A.;
Strachan, T.; Lako, M. Downregulation of NANOG Induces Differentiation of Human Embryonic Stem Cells
to Extraembryonic Lineages. Stem Cells 2005, 23, 1035–1043. [CrossRef] [PubMed]
7. Wang, Z.; Oron, E.; Nelson, B.; Razis, S.; Ivanova, N. Distinct lineage specification roles for NANOG, OCT4,
and SOX2 in human embryonic stem cells. Cell Stem Cell 2012, 10, 440–454. [CrossRef] [PubMed]
8. Li, A.I.; Hokugo, A.; Jarrahy, R.; Zuk, P.A. Human adipose tissue as a source of multipotent stem cells.
In Stem Cells in Aesthetic Procedures: Art, Science, and Clinical Techniques; Springer-Verlag GmbH: Heidelberg,
Germany, 2014.
9. Zuk, P.A.; Zhu, M.; Mizuno, H.; Huang, J.; Futrell, J.W.; Katz, A.J.; Benhaim, P.; Lorenz, H.P.; Hedrick, M.H.
Multilineage cells from human adipose tissue: Implications for cell-based therapies. Tissue Eng. 2001, 7,
211–228.
10. Gronthos, S.; Franklin, D.M.; Leddy, H.A.; Robey, P.G.; Storms, R.W.; Gimble, J.M. Surface protein
characterization of human adipose tissue-derived stromal cells. J. Cell. Physiol. 2001, 189, 54–63. [CrossRef]
11. Dominici, M.; Le Blanc, K.; Mueller, I.; Slaper-Cortenbach, I.; Marini, F.; Krause, D.; Deans, R.;
Keating, A.; Prockop, D.; Horwitz, E. Minimal criteria for defining multipotent mesenchymal stromal
cells. The International Society for Cellular Therapy position statement. Cytotherapy 2006, 8, 315–317.
[CrossRef]
12. De Francesco, F.; Tirino, V.; Desiderio, V.; Ferraro, G.; D’Andrea, F.; Giuliano, M.; Libondi, G.; Pirozzi, G.;
De Rosa, A.; Papaccio, G. Human CD34+/CD90+ ASCs are capable of growing as sphere clusters, producing
high levels of VEGF and forming capillaries. PLoS ONE 2009, 4, e6537. [CrossRef] [PubMed]
13. Pitrone, M.; Pizzolanti, G.; Tomasello, L.; Coppola, A.; Morini, L.; Pantuso, G.; Ficarella, R.; Guarnotta, V.;
Perrini, S.; Giorgino, F.; et al. NANOG plays a hierarchical role in the transcription network regulating the
pluripotency and plasticity of adipose tissue-derived stem cells. Int. J. Mol. Sci. 2017, 18, 1107. [CrossRef]
14. Potdar, P.D.; Sutar, J.P. Establishment and molecular characterization of mesenchymal stem cell lines derived
from human visceral & subcutaneous adipose tissues. J. Stem Cells Regen. Med. 2010, 6, 26–35. [PubMed]
15. Langroudi, L.; Forouzandeh, M.; Soleimani, M.; Atashi, A.; Golestaneh, A.F. Induction of differentiation by
down-regulation of Nanog and Rex-1 in cord blood derived unrestricted somatic stem cells. Mol. Biol. Rep.
2013, 40, 4429–4437. [CrossRef] [PubMed]
16. Perrini, S.; Ficarella, R.; Picardi, E.; Cignarelli, A.; Barbaro, M.; Nigro, P.; Peschechera, A.; Palumbo, O.;
Carella, M.; De Fazio, M.; et al. Differences in Gene Expression and Cytokine Release Profiles Highlight the
Heterogeneity of Distinct Subsets of Adipose Tissue-Derived Stem Cells in the Subcutaneous and Visceral
Adipose Tissue in Humans. PLoS ONE 2013, 8, e57892. [CrossRef] [PubMed]
17. Lengner, C.J.; Camargo, F.D.; Hochedlinger, K.; Welstead, G.G.; Zaidi, S.; Gokhale, S.; Scholer, H.R.; Tomilin, A.;
Jaenisch, R. Oct4 Expression Is Not Required for Mouse Somatic Stem Cell Self-Renewal. Cell Stem Cell 2007,
1, 403–415. [CrossRef]
18. Rodeheffer, M.S.; Birsoy, K.; Friedman, J.M. Identification of White Adipocyte Progenitor Cells In Vivo. Cell
2008, 135, 240–249. [CrossRef]
19. Smas, C.M.; Sul, H.S. Pref-1, a protein containing EGF-like repeats, inhibits adipocyte differentiation. Cell
1993, 73, 725–734. [CrossRef]Int. J. Mol. Sci. 2019, 20, 2580 12 of 12
20. Tang, W.; Zeve, D.; Suh, J.M.; Bosnakovski, D.; Kyba, M.; Hammer, R.E.; Tallquist, M.D.; Graff, J.M. White fat
progenitor cells reside in the adipose vasculature. Science 2008, 322, 583–586. [CrossRef]
21. Tseng, Y.H.; Butte, A.J.; Kokkotou, E.; Yechoor, V.K.; Taniguchi, C.M.; Kriauciunas, K.M.; Cypess, A.M.;
Niinobe, M.; Yoshikawa, K.; Patti, M.E.; et al. Prediction of preadipocyte differentiation by gene expression
reveals role of insulin receptor substrates and necdin. Nat. Cell Biol. 2005, 7, 601–611. [CrossRef] [PubMed]
22. Wang, Y.; Hudak, C.; Sul, H.S. Role of preadipocyte factor 1 in adipocyte differentiation. Clin. Lipidol. 2010, 5,
109–115. [CrossRef]
23. Wang, Y.; Kim, K.-A.; Kim, J.-H.; Sul, H.S. Pref-1, a Preadipocyte Secreted Factor That Inhibits Adipogenesis.
J. Nutr. 2018, 136, 2953–2956. [CrossRef] [PubMed]
24. Mitterberger, M.C.; Lechner, S.; Mattesich, M.; Kaiser, A.; Probst, D.; Wenger, N.; Pierer, G.;
Zwerschke, W. DLK1(PREF1) is a negative regulator of adipogenesis in CD105+/CD90+/CD34+/CD31-/FABP4-
adipose-derived stromal cells from subcutaneous abdominal fat pats of adult women. Stem Cell Res. 2012, 9,
35–48. [CrossRef]
25. Biniszkiewicz, D.; Gribnau, J.; Ramsahoye, B.; Gaudet, F.; Eggan, K.; Humpherys, D.; Mastrangelo, M.-A.;
Jun, Z.; Walter, J.; Jaenisch, R. Dnmt1 overexpression causes genomic hypermethylation, loss of imprinting,
and embryonic lethality. Mol. Cell. Biol. 2002, 22, 2124–2135. [CrossRef] [PubMed]
26. Tsai, C.C.; Su, P.F.; Huang, Y.F.; Yew, T.L.; Hung, S.C. Oct4 and Nanog Directly Regulate Dnmt1 to Maintain
Self-Renewal and Undifferentiated State in Mesenchymal Stem Cells. Mol. Cell 2012, 47, 169–182. [CrossRef]
27. Wade Harper, J.; Adami, G.R.; Wei, N.; Keyomarsi, K.; Elledge, S.J. The p21 Cdk-interacting protein Cip1 is a
potent inhibitor of G1 cyclin-dependent kinases. Cell 1993, 75, 805–816. [CrossRef]
28. Xiong, Y.; Hannon, G.J.; Zhang, H.; Casso, D.; Kobayashi, R.; Beach, D. P21 is a universal inhibitor of cyclin
kinases. Nature 1993, 366, 701–704. [CrossRef]
29. Aleem, E.; Kiyokawa, H.; Kaldis, P. Cdc2-cyclin E complexes regulate the G1/S phase transition. Nat. Cell
Biol. 2005, 7, 831–836. [CrossRef]
30. Gartel, A.L.; Tyner, A.L. Transcriptional regulation of the p21((WAF1/CIP1)) gene. Exp. Cell Res. 1999, 246,
280–289. [CrossRef]
31. Fouse, S.D.; Shen, Y.; Pellegrini, M.; Cole, S.; Meissner, A.; Van Neste, L.; Jaenisch, R.; Fan, G. Promoter CpG
Methylation Contributes to ES Cell Gene Regulation in Parallel with Oct4/Nanog, PcG Complex, and Histone
H3 K4/K27 Trimethylation. Cell Stem Cell 2008, 2, 160–169. [CrossRef]
32. Lei, H.; Oh, S.P.; Okano, M.; Jüttermann, R.; Goss, K.A.; Jaenisch, R.; Li, E. De novo DNA cytosine
methyltransferase activities in mouse embryonic stem cells. Development 1996, 122, 3195–3205. [PubMed]
33. Okano, M.; Bell, D.W.; Haber, D.A.; Li, E. DNA methyltransferases Dnmt3a and Dnmt3b are essential for de
novo methylation and mammalian development. Cell 1999, 99, 247–257. [CrossRef]
34. Coppola, A.; Tomasello, L.; Pitrone, M.; Cillino, S.; Richiusa, P.; Pizzolanti, G.; Giordano, C. Human limbal
fibroblast-like stem cells induce immune-tolerance in autoreactive T lymphocytes from female patients with
Hashimoto’s thyroiditis. Stem Cell Res. Ther. 2017, 8, 154. [CrossRef] [PubMed]
35. Tomasello, L.; Mauceri, R.; Coppola, A.; Pitrone, M.; Pizzo, G.; Campisi, G.; Pizzolanti, G.; Giordano, C.
Mesenchymal stem cells derived from inflamed dental pulpal and gingival tissue: A potential application
for bone formation. Stem Cell Res. Ther. 2017, 8, 179. [CrossRef] [PubMed]
36. Riccardi, C.; Nicoletti, I. Analysis of apoptosis by propidium iodide staining and flow cytometry. Nat. Protoc.
2006, 1, 1458–1461. [CrossRef] [PubMed]
© 2019 by the authors. Licensee MDPI, Basel, Switzerland. This article is an open access
article distributed under the terms and conditions of the Creative Commons Attribution
(CC BY) license (http://creativecommons.org/licenses/by/4.0/).You can also read