Canadian Passenger Vehicle Scrappage Policy Analysis - Author: Jameel Shaikh Prepared for the International Council on Clean Transportation ...
←
→
Page content transcription
If your browser does not render page correctly, please read the page content below
Canadian Passenger Vehicle Scrappage Policy Analysis

Author: Jameel Shaikh

Prepared for the International Council on Clean Transportation

October 2020
Canadian Passenger Vehicle Scrappage Policy Analysis

Executive Summary
To support the reduction of CO2 emissions from the Canadian automotive fleet, while stimulating
automotive sales; vehicle scrappage programs options are examined. New vehicle purchase scenarios as
replacements for higher CO2 emitting scrapped vehicles are explored. The scrapped vehicle is assumed to
be a 15-year-old average light-duty vehicle (passenger car or light truck) corresponding to a 2005 model
year (MY). With an assumption of a 25-year vehicle lifespan, the time frame of analysis is 2021 to 2030,
representing the 10 years remaining life of the scrapped vehicle. A new vehicle is assumed to drive 20,000
km per year each year throughout the 2021 – 2030 timeframe. It is also assumed that the scrapped vehicle
would have also driven 20,000 km/year in this timeframe had the vehicle remained on the road.

The analysis looks at various scenarios for what types of new vehicles are eligible to be purchased as part
of the scrappage program. In Scenario 1, incentive funds can be applied towards an electric vehicle (EV)
or plug-in-electric vehicle (PHEV) only. In Scenario 2 consumers can direct program funds towards an EV,
PHEV or an internal combustion engine vehicle (ICEV), provided that the ICEV CO2 emissions are below a
certain threshold. In Scenario 3, funds can be used for an EV, PHEV or ICEV purchase; however, for an ICEV
to be eligible for incentive funding, it must be 30% more fuel efficient than that of the scrapped vehicle.
Finally, a fourth scenario that is a variant of Scenario 1 (“Scenario 1A”) was analyzed to consider a situation
in which program incentive funds are offered only towards the purchase of an EV.

The analysis was performed on a per-vehicle basis to quantify the net CO2 removed under each scenario
for a single vehicle scrapped and replaced by a new vehicle. The emissions of the scrapped vehicle is
assumed to be that of an average 2005 model year (MY). The new vehicle exhibits characteristics as per
the 4 scenarios described. Each scenario is compared against a baseline that represents a scrappage
program in which there are no restrictions on the new vehicle purchase, and it is therefore assumed that
in this base case the new vehicle will exhibit characteristics of an average 2020 vehicle. The scrapped
vehicle will also be 2005 MY vehicle under the baseline scenario.

Table 1: Key Assumptions
              Input Variable                            Assumption                            Comments
                                                All Scenarios & Baseline
 Scrapped vehicle age/MY                      15 years old/ MY 2005 for all
                                              scenarios
 Vehicle lifespan                             25 years
 Timeframe of study                           10 years; 2021-2030               Represents the 10 years of residual life
                                                                                of the scrapped vehicle
 Kilometers driven per year                   20,000 km                         Assumes no degradation in annual km
                                                                                over vehicle lifetime. Per-vehicle
                                                                                activity is assumed to be 20,000
                                                                                km/year
 CO2 emissions rate of scrapped vehicle      Average MY 2005 emissions at       Derivation described below
                                             269 g CO2/km
                                           New Vehicle Scenario Assumptions
 New Vehicle                                 MY 2020 for all scenarios with a
                                             unique average g CO2/km value
                                             calculated for each scenario.
 Scenario 1 new vehicle CO2 emissions rate   56.7 g CO2/km                      Derivation described in Annex 1
 Scenario 2 new vehicle CO2 emissions rate   94.7 g CO2/km                      Derivation described in Annex 1
 Scenario 3 new vehicle CO2 emissions rate   101.4 g CO2/km                     Derivation described in Annex 1
 Scenario 1A new vehicle CO2 emissions rate 29.9 g CO2/km                       Emissions of average MY 2020 EV
 Baseline                                    230.7 g CO2/km                     Emissions of average MY 2020 vehicle

2|Page
Canadian Passenger Vehicle Scrappage Policy Analysis
Input Variable Assumption Comments
Other Assumptions:
Electricity grid carbon intensity for 2019 EV 15.7 g CO2/km Weighted average based on 2019 EV
analysis registrations in Canada and provincial
grid carbon intensities
Electricity grid carbon intensity for 2021 – 169.5 g CO2/km Weighted average based on all
2030 analysis provincial vehicle registrations in 2019
across Canada and respective
provincial grid carbon intensities
Conversion of L/100km to g CO2/kg 2,348 g CO2/Liter gasoline From the EPA specified 8,887 g CO2/
gallon gasoline. This value is used in all
cases throughout paper to covert fuel
consumption figures to emissions
except where diesel vehicles are
segmented out. In this case, the value
of 10,180 g CO2/ gallon diesel equal to
2,689 g CO2/liter diesel is used.
All dollar ($) figures in CAD unless otherwise specified
Table 2 below illustrates the net CO2 reduction over the 10-year timeframe on a per-vehicle basis for the
4 scenarios as well as the base case. The scrapped vehicle is assumed to be identical in each of the four
scenarios, so the avoided CO2 emissions are equal in all cases. The CO2 added under each scenario is the
distinguishing factor that varies across each scenario (values in red). The CO2 added over the 10-year
timeframe includes the CO2 emissions due to early production of the respective vehicle. In comparison to
the baseline, each scenario displays an overall benefit in terms of additional CO2 removed. The EV-only
scenario (Scenario 1A) demonstrates a more than 10-fold improvement compared to the baseline.
Table 2: Summary of Results
While clearly an environmental benefit, the economic benefit of generating additional EV sales will be
skewed towards dealers that sell electric vehicles; and ultimately OEMs that produce these electric
vehicles, along with the respective manufacturing locations. With policy and investment attraction
initiatives to draw more EV manufacturing to Canada, these initiatives could indirectly benefit from
scrappage policies designed to encourage increased local EV demand.
The analysis is on a per vehicle basis and does not consider the total number of incremental vehicles that
incentives will yield. An EV-only option would likely result in fewer incremental new vehicles than if ICEVs
are permitted – most certainly if per-vehicle incentive funding is equal for EVs and ICEVs. Traditional
impediments to EV consumer adoption continue to exist. While EV driving ranges continue to improve,
corresponding government initiatives to expand the charging infrastructure and increase charging
locations will make EVs more attractive to an increasing number of consumers.
3|PageCanadian Passenger Vehicle Scrappage Policy Analysis Finally, the benefits of EVs with respect to CO2 emissions is directly dependent on the mix of feedstocks feeding the electricity grid. Thus, corresponding policies to promote clean energy generation sources will reduce the carbon intensity of the grid and improve the effectiveness of introducing more EVs to the fleet. Introduction At the onset of the COVID 19 pandemic and the ensuing demand shock across the global economy, the automotive sector in Canada has been impacted significantly. In the month of March as lockdowns went into effect, Canadian new vehicle sales exhibited significant declines. An opportunity exists to both stimulate the economy through new car sales, while also implementing environmentally prudent measures aimed at reducing carbon emissions. Encouraging new purchases of fuel-efficient low CO2 emitting vehicles; contingent upon the removal older higher CO2 emitting vehicles; will serve to drive a net reduction of this key greenhouse gas from the environment, while stimulating new vehicle sales. This paper will assess the outcome of various scrappage scenarios to support recommendations for a scrappage policy. Prior scrappage programs will be summarized; as well as more recent initiatives, and proposed initiatives in the wake COVID 19. The current state of the Canadian auto market will be examined with an analysis on 2019 sales data, identifying key trends and determining the average CO2 emissions of these 2019 vehicles. Average CO2 emissions of prior year model years are sourced from multiple data sources. With the model year mix of the Canadian fleet, an average vehicle age, and average g CO2/km of all Canadian registered vehicles is determined. Four scrappage scenarios are examined and compared to a baseline. Each scenario assesses the impact of replacing a scrapped vehicle with a new vehicle. The permitted new vehicle or choice of vehicle in each scenario is restricted and differs across each scenario. A fleet model is developed to determine the net tonnes CO2 removed in each of the 4 scenarios as well as in a baseline scenario. All vehicles are assumed to have a 25-year lifespan and assumed to be driven 20,000 km/year. The scrapped vehicle is assumed to be 2005 model year (MY) vehicle, and at 15 years old, to have 10 years of useful life remaining. With this assumption the time period of the study is from 2021-2030 inclusive representing the years the scrapped vehicle would have remained on the road, but instead is replaced by the new vehicle under each scenario. The study is for a current one time scrappage program’s impact on this timeframe, and does not consider any impact of future scrappage initiatives that may occur in subsequent year during this timeframe. In closing the outcomes of the 4 scenarios are analyzed and discussed and compared against the baseline scenario. Items of consideration are raised, and policy recommendations are presented. Scrappage Schemes Scrappage programs incentivize owners of older vehicles to retire, or scrap, their vehicle. Removing these older polluting vehicles from to road, as opposed to selling them on the secondary market as a used car prevents emissions from being released into the environment. As such it is pertinent that such older high emitting vehicle actually be removed from circulation, and a scrappage program can facilitate this. Programs are often conditional upon the purchase of a new vehicle and coupled with additional incentives towards the purchase of a new fuel-efficient/low CO2 emitting vehicles as a replacement vehicle. Such situations can serve the dual purpose of a favorable environmental impact by inducing a net decrease in CO2 emissions, and an economic impact of stimulating auto sales. 4|Page
Canadian Passenger Vehicle Scrappage Policy Analysis

Incentives can however include other options designed to discourage the purchase of a new vehicle all
together, while still prompting the removal of an older polluting vehicle. Such incentives can include
transit passes, discounts on bikes, and car share service memberships. In these cases, although the net
CO2 removal will be significantly higher and therefore more environmentally beneficial, it would not
provide economic stimulus to the automotive sector through new vehicle sales.

Canadian Scrappage Programs
There have been previous scrappage and incentive programs in Canada, most notably the national
program known as Retire Your Ride. Other programs include various provincial programs, key amongst
them the current BC’s Scrap It program; which is also the oldest and longest running program in the
country; and the current Ontario Plug’n Drive program which incentivizes purchases of used electric
vehicles, recently adding a scrappage component to the program.

Retire your Ride
Retire your Ride was a nationwide scrappage program, also known as the National Vehicle Scrappage
Program. The 2007 Federal Budget targeted investments in clean air, greenhouse gas reduction and
overall climate change mitigation; and the removal of older polluting vehicles from the road was
specifically cited as a measure to achieve the clean air objective.1

The program was launched in January 2009 targeting the removal of vehicles from the 1995 model year
and earlier. These vehicles were higher polluting as emissions standards were tightened in 1996. It was
estimated that as of 2007 there were approximately 4.6 million 1995 model year or earlier vehicles on
Canada’s roads which were said to be 19 times more polluting than 2004 model year vehicles; the year in
which emissions standards were again tightened.2 These 1995 or earlier model year vehicles were
therefore targeted to remove and scrap.

Environment Canada operated the program and partnered with the Non-Profit, Clean Air Foundationi. The
cash incentive for scrapping an old vehicle was $300. The main goal of the program was the removal of
high polluting vehicles from the road, with a secondary objective of greenhouse gas emission reduction
through the promotion of sustainable transportation adoption, and vehicle recycling best practices. As
such the program did not solely focus on generating new vehicles sales. In addition to rebates on new
vehicles, incentives also included transit passes, discounts on bicycles and e-bikes, and memberships in
car sharing programs. The program ended in March 2011, and from the period of Jan 2009 to March 2011
a total of 138,600 vehicles were removed from the road. An additional benefit of the program was greater
awareness and compliance with environmentally safe recycling practices abiding by the Automotive
Recyclers of Canada code.3

Prior programs had existed at a national level such as Car Heaven, which although had received
operational support from Environment Canada, was not federally funded.4 This program targeted
functioning and non-functioning vehicles, the latter of which were not at the time emitting CO2 while in
a dormant state5. Car Heaven was also run by the Clean Air Foundation and as such served to provide

i   Currently Summerhill Impact

5|Page
Canadian Passenger Vehicle Scrappage Policy Analysis

insights and lessons learned when designing the Retire Your Ride program. At the termination of the
Retire Your Ride program the Clean Air Foundation opted to relaunch the Car Heaven program.

Scrap It (BC)
As the first scrappage program in Canada, BC’s Scrap-It program is a provincial initiative which has
scrapped 49,747 vehicles from April 1996 to Aug 20206. Scrapped vehicles must be registered in the name
of the applicant, must be delivered intact without any parts removed, and must be a gasoline, diesel
natural gas or propane vehicle in order to claim an EV purchase incentive. The vehicle purchase incentives
are towards the purchase of new or used EVs. No incentives are offered towards PHEVs or ICEV vehicles.ii

For qualifying new EVsiii a $6000 rebate is offered, and a $3000 rebate is offered towards qualifying used
EVsiv. Other incentive choices include BC Transit passes (an $880 value), rebates of $1,050 towards an
electric bike, car share credits of $500, cash rebates of $200 and, $100 rebates for non-qualifying scrapped
vehicles. Perks also include free home charging kits. The program has recently announced an expansion
into Alberta attempting to mimic the favorable results in BC7.

Plug’n Drive (Ontario)
The Ontario Plug’n Drive program launched in April 2019 offering incentives of $1000 only towards the
purchase used EVs or PHEV). A scrappage incentive component was added in Feb 2020. This enhancement
to the programs offers an additional $1000 to scrap an old gasoline powered vehicle. The program is run
by the non-profit ‘Plug n Drive’, is privately funded by the M.H. Brigham Foundation, and operates in
collaboration with the Clean Air Partnershipv

Global Scrappage Schemes
United States:
A 2009 program commonly known as ‘Cash for Clunkers’ or the Car Allowance Rebate System (CARS)
program was introduced in the aftermath of the global financial crisis. The $3 billion program was
launched in July 2009 and offered $3500- $4500 for trade-in vehicles of 18mpg or less8. The program came
to an end in August 2009 with 685,000 vehicles scrapped. Scrapped vehicles averaged 15.8 mpg with the
new vehicle replacement averaging 24 mpg.9

There has been consideration of another such automotive stimulus program. In the fall of 2019, a Senate
proposal ‘Clean Cars for America’ suggested a $454 Billion plan to increase the affordability of EVs, PHEVs
and HEV vehicles, improve the accessibility of charging infrastructure, and promote US based
manufacturing of clean vehicles10. The objective of the plan is to remove 63 million gasoline powered
vehicles from US roads over 10 years. This plan and has been embraced by Presidential Candidate Joe
Biden as part of his clean energy and infrastructure vision11.

ii
 https://scrapit.ca/faqsinfo/programpolicies/
iii
 A qualifying new or used vehicle is defined as “A car, truck, van or other motor vehicle with an electric
engine/motor that is highway capable and has 4 wheels” (https://scrapit.ca/qualifyingevs/ )
iv
       https://scrapit.ca/evincentivechoices/
v     https://www.plugndrive.ca/canadas-only-privately-funded-electric-vehicle-incentive-is-helping-car-buyers-make-the-switch/

6|Page
Canadian Passenger Vehicle Scrappage Policy Analysis France France introduced a scrappage scheme in the wake of the global financial crises offering €1,000 to scrap old higher polluting vehicles. An increase in new vehicle sales in 2009 was evident and thought to be attributable to this program12. In May 2020, during the initial COVID 19 lockdown in France, the Macron government announced an €8 Billion support package which included subsidies for the purchase of electric cars, and funds for scrapping older vehicles13. Of the €8 Billion package €1.3 Billion was set aside for EV subsidies to increase the existing €6,000 incentive to €7,000 and offer up to €5,000 for a scrapped vehicle14. A consumer could therefore receive up to €12,000 toward the purchase of an electric vehicle.15 The plan also supports research on self driving and hydrogen powered vehicles, and aims to promoting local manufacturing of clean vehicles16. The program, which was intended to remove 200,000 vehicles from French roads, reached this threshold within 2 months17. In June 2020, light vehicle sales did in fact increase by 2.4% yoy and forecasted sales for full year 2020 were revised upwards from 1.82 million(-32% yoy) to 2.17 million (-19% yoy) 18. With the 200,000 vehicle threshold met, a new plan was announced and implemented August 3rd19. This subsequent program was structured to better benefit lower income earners with a tiered incentive approach on scrapped vehicles; inversely corresponding to a participant’s income. New BEV & PHEV Vehicle incentives remained unchanged20. Scrapped vehicle incentive funds are received for gasoline vehicles registered before 2006 and diesel vehicles before 201121. Current State of Canada’s Auto Market 2019 Light Vehicle sales in Canada totaled 1,930,120 according to data provided by DesRosiers Automotive Consultants (DesRosiers). Sales peaked in 2017 at 2,036,647 with a steady upward trend from the trough of 2009 in the aftermath of the global financial crisis. From 2010 to 2017 sales grew at a compound annual growth rate (CAGR) of 3.9%. Since 2017 however there has been a downward trajectory to 201922. In 2020, January and February sales exhibited modest yoy gains at +0.8% & +1.7% respectively, before the COVID-19 induced lockdown decline began in March; driving sales down 48.5% yoy. April exhibited a 74.5% decline while May, June and July came in a - 47.2%, -21.5% and -10.5% yoy respectively. While a partial rebound has been evident in May through July, year to date (YTD) sales are down 32%.23 Full year estimates point to a 22% decline in 2020 with 1.51 million units anticipated to be sold; the lowest annual sales since 2009.vi vi Internal estimate based on Jan-July 2020 actual sales data from Statistics Canada. August through December sales are based on an August yoy growth estimate of -9% from Scotiabank Economics which was applied to August through September 2019 to arrive at an estimated 1.51million vehicles for 2020 representing a 22% yoy decline on the 2019 DesRosiers sales figure. Statistics Canada sales data from Table 20-10-0001-01 New motor vehicle sales (https://www150.statcan.gc.ca/t1/tbl1/en/tv.action?pid=2010000101, accessed Sept 19, 2020). Scotiabank data from: Young, Rebekah. Canadian and US Vehicle Sales (August 2020): Auto News Flash. Sept 1, 2020, https://www.scotiabank.com/ca/en/about/economics/economics-publications/post.other-publications.autos.auto-news- flash.september-1--2020.html 7|Page
Canadian Passenger Vehicle Scrappage Policy Analysis

Table 3: Year to Date 2020 Canadian New Vehicle Sales
          2020 YTD         Jan-20    Feb-20      Mar-20     Apr-20       May-20     Jun-20       Jul-20 YTD July            Full Year 2020
                                                                                                          2020                 Estimate
       Monthly Sales       112,845   126,224       96,147   47,168       109,173    149,079    158,678        799,314                 1,508,672
        year-over-year %     0.8%       1.7%      -48.45%       -74.6%    -47.2%      -21.5%     -10.5%           -32.4%                 -21.8%
Source: Statistics Canada: New motor vehicle sales (Passenger Cars & Trucks) Table: 20-10-0001-01
In Table 4 below are the sales by OEM for 2019 with a comparison to 2016; both datasets of which are
based on DesRosiers sales data. A slight drop in sales of -0.9% is evident across these subject years on
either side of the 2017 peak noted above. More notable however is the shift in market share, with the
North American OEMs Ford and GM, as well as Fiat Chrysler Automotive (FCA) exhibiting a declining share;
while Toyota and Volkswagen made notable market share gains. Perhaps the most compelling metric is
the growth of Tesla sales in this 3-year span, from under 2500 vehicles in 2016 to 18,850 vehicle sales in
2019; a 671% increase and a respectable 1% 2019 market share for a solely EV manufacturer. The EV
segment as a whole grew 626% from 2016 to 2019, representing 2% of the new vehicle sales market in
2019 with 35,305 EV units sold.

Table 4: Sales by OEM 2019 vs 2016
              OEM               Units Sold     2019 CY Market     Units Sold     2016 CY Market Change in   Change Units %Change
                                 CY 2019           Share           CY 2016           Share     Market Share     Sold
                                                                                                            2019 vs 2016

FORD                          283,268                  14.7%           300,769           15.4%            -0.8%            (17,501)      -5.8%
GM                            256,789                  13.3%           267,339           13.7%            -0.4%            (10,550)      -3.9%
TOYOTA                        237,091                  12.3%           217,659           11.2%             1.1%             19,432        8.9%
FCA                           224,174                  11.6%           278,223           14.3%            -2.7%            (54,049)     -19.4%
KIA/HYUNDAI                   211,431                  11.0%           209,839           10.8%             0.2%              1,592        0.8%
HONDA                         188,828                   9.8%           186,668            9.6%             0.2%              2,160        1.2%
NISSAN                        134,729                   7.0%           133,926            6.9%             0.1%                803        0.6%
VOLKSWAGEN                    111,856                   5.8%            97,862            5.0%             0.8%             13,994       14.3%
MAZDA                          66,421                   3.4%            69,210            3.6%            -0.1%             (2,789)      -4.0%
SUBARU                         57,524                   3.0%            50,190            2.6%             0.4%              7,334       14.6%
MERCEDES-BENZ                  46,090                   2.4%            48,320            2.5%            -0.1%             (2,230)      -4.6%
BMW                            42,792                   2.2%            44,714            2.3%            -0.1%             (1,922)      -4.3%
MITSUBISHI                     25,535                   1.3%            22,292            1.1%             0.2%              3,243       14.5%
TESLA                          18,850                   1.0%             2,442            0.1%             0.9%             16,408      671.9%
JLR                            13,927                   0.7%            12,174            0.6%             0.1%              1,753       14.4%
VOLVO                          10,155                   0.5%             6,103            0.3%             0.2%              4,052       66.4%
FERRARI                           333                   0.0%               199            0.0%             0.0%                134       67.3%
MCLAREN AUTOMOTIVE                209                   0.0%               108            0.0%             0.0%                101       93.5%
ASTON MARTIN                      108                   0.0%                53            0.0%             0.0%                 55      103.8%
LOTUS                              10                   0.0%                 0            0.0%             0.0%                 10
TOTAL                       1,930,120                 100.0%         1,948,090          100.0%             0.0%            (17,970)       -0.9%
Source: DesRosiers Automotive

Figure 1 below illustrates the sales-weighted OEM average CO2 emissions in gCO2/km, as well as the
overall Canada fleet average. The 2019 Canadian average CO2 emissions per vehicle on a g CO2/km basis
is estimated at 231 g CO2/km.vii Consumers must be encouraged to purchase low CO2 emitting vehicles
from the available models to bring down this average. In 2019 CO2 emissions from vehicles purchased
ranged from 2.4 g CO2/km (Hyundai Ioniq EV) to 510 g CO2/km (Lamborghini Aventador). Thus, increasing
demand of low emitting vehicles will serve to lower the average g CO2/km of the Canadian fleet. This
favourable effect will carry through during the lifetime of the vehicle on the road.

vii
      Based on DesRosiers Automotive 2019 Sales Data and fuel consumption by vehicle line

8|Page
Canadian Passenger Vehicle Scrappage Policy Analysis Electric vehicles have zero tailpipe emissions and the CO2 footprint is limited to emissions from the electricity grid’s power generation source from which the EV is charged. Therefore, electric vehicles within OEM fleets do indirectly generate CO2 emissions as power drawn when charging from the grid does result in some CO2 emissions. The power grid’s CO2 intensity from electricity generation by province was considered (in g CO2/kWh) and examined. When looking at historic data, such as the case in Figure 2 for 2019, the weighted average CO2/kWh output was calculated based on 2019 EV registrations in each province24. The bulk of 2019 EVs registrations were in Ontario, Quebec, and BC; all three of which have low CO2 intensity grids (at 40, 1.2 and 12.9 g CO2/kWh respectively) 25. This weighted average figure is 15.66 g CO2/kWh and represents the CO2 emitted per kWh drawn from the grid when a 2019 vehicle was charged. To determine the CO2 emissions by vehicle line, each 2019 electric vehicle’s energy consumption figure in kWh/100 kmviii was multiplied by this 15.66 g CO2/kWh figure to arrive at a unique emission figure in gCO2/km for a given EV model sold in 2019. As such the figure for Tesla for example, a pure EV OEM with an average of 2.64gCO2/km, reflects this estimation. It is worth noting that when looking at electricity grid data for all provinces, the CO2 emissions vary from a low of 1.2 gCO2/kWh in Quebec to 790 gCO2/kWh in Alberta26. If a weighted average were based on all registered vehicles (EV or otherwise, less than 4500kg); this weighted average Canada wide grid CO2 output would be 169.5 gCO2/kWh27. This is the figure used in a forward-looking analysis to be elaborated on below. Calculated from the L/100km equivalent provided by the DesRosiers data and multiplying by 8.9 kWh/L gasoline; the energy viii equivalent of 1 liter of gasoline; Natural Resources Canada, https://www.nrcan.gc.ca/energy/efficiency/energy-efficiency- transportation-and-alternative-fuels/choosing-right-vehicle/tips-buying-fuel-efficient-vehicle/energuide-vehicles/energuide- label-battery-electric-vehicles/21379 9|Page
Canadian Passenger Vehicle Scrappage Policy Analysis

Figure 1: 2019 Sales by OEM and Fleet Average CO2 emissions (gCO2/km)

Evident in Figure 2 and 3 below is the increased prevalence of Light Truck sales relative to Passenger Cars
between 2016 and 2019. This has indeed been a trend from as far back as 2010 with trucks representing
55% of sales units in 2010, 67% in 2016 and 76% in 201928. When examining Figure 3 in more detail, it is
notable that with the exception of FCA, all OEMs that produce trucks experienced an increase in Light
Truck sales between 2016 and 2019.

10 | P a g e
Canadian Passenger Vehicle Scrappage Policy Analysis

Figure 2: 2016 & 2019 Car-Truck Sales Split by OEM

Figure 3 2016 to 2019 Car and Truck growth

In Figure 4 below, the Passenger Car and Light Truck subcategories are segmented to show their CO2
emissions per km on a weighted average basis for each OEM, as well as a Canada fleet average. The higher
emissions values for trucks amongst OEMs is evident with the exception of Subaru. The spread is also
evident in the Canada wide figures at 253.6 g CO2/km for Light Trucks and 175.9 g CO2/km for Passenger
Cars.

11 | P a g e
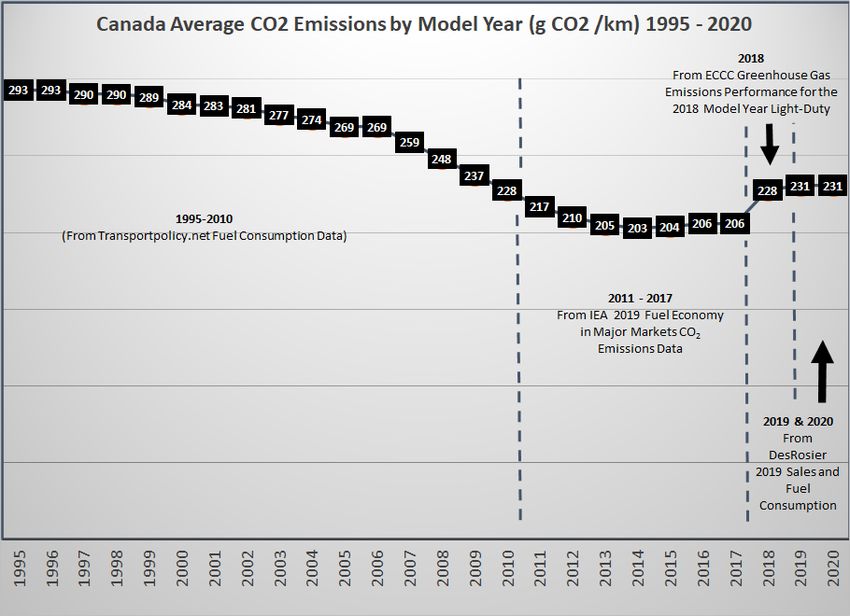
Canadian Passenger Vehicle Scrappage Policy Analysis

Figure 4 Emissions in g CO2/km for Passenger Cars and Trucks by OEM and Canada Fleet Average

Fleet Model
Emissions by Model Year
The CO2 emissions by model year for MY 1995 to 2020 was obtained from various sources. Estimates of
either the average Canada wide fuel consumption, or CO2 emissions for a given model year were sourced.
Fuel consumption data was converted from L/100km to g CO2/km using 2348 g CO2/ Liter for gasoline
vehicle lines or 2689 g CO2/Liter diesel vehicle lines.ix

For 1995 through 2010, the CO2 emissions by model year was calculated based on fleet average fuel
consumption data for Canadian vehicles in L/100km as per Transport Policy.net for both Passenger Cars
and Light Duty Trucks (less than 8501lbs).29 This fuel consumption data is based on the US Federal Test
Procedure (FTP) which uses a 2-cycle testing process. As such this data was adjusted upward by a factor
of 25%x to arrive at real world emissions levels for vehicles of these respective model years.

Model year 2011 to 2017 data was from an IEA 2019 Fuel Economy in Major Markets report which
included data on Canada on a g CO2/km basis30. This data was as per the Worldwide Harmonised Light
Vehicle Test Procedure (WLTP). WLTP is deemed to be more representative of real world driving as it

ixBased on the EPA specified 8,887 g CO2/ gallon gasoline or 10,180 g CO2/ gallon diesel converted to metric. Where L/100km
data was sourced, the gasoline and diesel conversion constants were applied in proportion to the % diesel in fleet within a model
year (with the residual taken at the gasoline conversion constant). This diesel percentage was drawn from DesRosiers’s vehicle
registration data by model year.
x
  Based on US EPA real world adjustment factor: ICCT whitepaper: Mock, Peter et al. From Laboratory to Road International, A
Comparison of Official and Real-World Consumption and CO2 Values for Passenger Cars in Europe, The United States, China, and
Japan, Nov 2017

12 | P a g e
Canadian Passenger Vehicle Scrappage Policy Analysis

examines 4 driving profiles described as “low, medium, high and extra high”, each of which contains
acceleration, braking and hard stop componentsxi. Therefore, WLTP measures are taken to be
representative of real-world driving, and therefore a real-world multiple was not applied.

For model year 2018, data for tailpipe emissions from the 2018 Environment and Climate Change Canada
(ECCC) report for the overall fleet average tailpipe emissions was used, sourcing both passenger vehicle
and light truck data.31 A weighted average was determined based on the split of passenger vehicle and
light truck sales in 2018 as per Statistics Canada Sales data32. To adjust for real world conditions this figure
was adjusted upwards by 25% similar to the 1995 to 2010 data.

DesRosiers sales data for 2019, was used to determine an average 2019 g CO2/km emissions value as
described above, and also serves as a proxy for 2020. The 2019 data set was broken out into a greater
level of detail with fuel consumption data in L/100km available by vehicle line and fuel source/powertrain.
This data was therefore analyzed in more granular detail. With diesel powered vehicles for example
(representing 1.94 % of 2019 vehicle sales), the diesel specific multiplier of 2689 g CO2/Liter diesel was
applied to these vehicle lines when converting data from L/100km to g CO2/km. In the case of EVs, the
fuel consumption equivalent was first converted to a kWh/100 km by using the conversion factor of 8.9
kWh/L gasoline. In order to determine a g CO2/km value for each electric vehicle line, a forward-looking
estimate of a Canada wide electricity grid carbon intensity figure of 169.5 g CO2/kWh was used. This
Canada wide figure is used as an electric vehicle purchase could happen in any province under a national
program

Table 5: 2019 actual and 2020 estimated CO2 fleet emissions in g CO2/km by Fuel Type or Powertrain

With regards to PHEV vehicles the L/100km figures in the 2019 sales data was based on an estimation of
usage in battery mode and gasoline mode. PHEV vehicles have 2 fuel consumption figures; one for battery
mode (in equivalent liters /100km by applying 8.9 kWh/L to the a kWh/100km figure) and one for gasoline
mode. The battery range in kilometers was used as the basis of the weighting applied to determine an
average. For example, for a vehicle with a battery range of 32km, a weighting of 32 % would be applied
to the battery fuel consumption figure and 68% to the gasoline fuel consumption figure. This battery mode
percentage was capped at 80%. Further when converting the L/100km figure to a CO2/km figure, the
gasoline multiplier of 2348 gCO2/L was applied. While appropriate for the gasoline portion it represents
an overstatement of the electricity portion, implying 263 g CO2/kWh (2348 gCO2/L gasoline divided by 8.9
kWh/ L gasoline); in other words implying the vehicle battery charging occurs from a hypothetical gasoline
powered electricity grid emitting 263 g CO2/kWh.xii

The estimated emissions figures for the 1995 through 2020 model years in g CO2/km is summarized below
in Figure 5

xihttps://www.wltpfacts.eu/what-is-wltp-how-will-it-work/
xii
  Hybrid Electric Vehicles (HEV) were also converted from L/100km using the gasoline vehicle multiplier of 2348 gCO2/L and
similar to the case of PHEVs also overstates the CO2 emissions from the type of vehicle. In this case no consideration was made
for the percentage battery usage vs gasoline usage as was the case for the PHEV estimate. HEVs represented 2% of sales in
2019

13 | P a g e
Canadian Passenger Vehicle Scrappage Policy Analysis

Figure 5: Real World Estimates of CO2 emission for Model Years 1995 - 2020

Model Year Mix
Using an additional data set from DesRosiers of vehicle registrations by model yearxiii , the proportion of
vehicles by model year was used to determine the average age of the Canadian fleet at 9.9 years. Along
with this CO2 emissions per kilometer of the fleet was on average estimated at 235.4 gCO2/km.

Scenario Development
Four scenarios were developed to determine i) the removal of CO2 emissions by scrapping an older vehicle
early and ii) emissions added by purchasing a new vehicle. The new vehicle is assumed to be a 2020 model
year and deemed to have the same characteristics as that of a 2019 vehicle which was analyzed in detail
above. Therefore, as with a 2019 vehicle a 2020 vehicle on average is assumed to emit 230.7 g CO2/km as
illustrated in Figure 5 above. Further this data is segmented into subsets as per Table 5 with 2020 EVs
emitting on average 29.9 g CO2/km; PHEV emitting on average 104.3 g CO2/km and ICEVs on average
emitting 237.2 g CO2/km (assumed to be gasoline powered vehicle). Hybrid Electric Vehicles (HEV) are
omitted from this analysis as they are not considered in the new vehicle purchase scenarios discussed
below.

xiii
       DesRosiers data for the distribution of vehicle populations by model year is through July 2019.

14 | P a g e
Canadian Passenger Vehicle Scrappage Policy Analysis A scrapped vehicle is assumed to be a 2005 vehicle with the assumption that a scrapped vehicle would be at least 15 years old. Other key input assumptions were that a vehicle lifespan is 25 years and the average kilometers driven per year at 20,000km/year for each year in the 2021 to 2030 timeframe. With an estimated maximum lifespan of 25 years, there is 10 years of remaining life. It is assumed the driver of a new vehicle purchase begins driving in 2021 so the 10-year period of assessing the removal of emissions from the scrapped vehicle and the added emissions from the new vehicle is 2021 to 2030 inclusive. Under scenario 1 the scrapping of a vehicle would result in incentives towards only an EV or PHEV vehicle. Under scenario 2 an ICEV vehicle purchase would be permitted, however at no more than half the funding that would be received towards a new EV/PHEV purchase. Should an ICEV vehicle purchase be opted for, the vehicles would be required to have a fuel consumption figure of no more than 8 L/100km; and should a vehicle be below 7 L/100km, a higher premium would be received than that of a vehicle with fuel consumption ranging from 7.1 L/100km to 8 L/100km. Under scenario 3, similar to scenario 2, both PHEV/EV purchases and ICEV would be permitted, however should an ICEV vehicle be purchased it must be at least 30% more fuel efficient than that of the scrapped vehicle. An additional scenario 1A is also examined to consider a situation when the new vehicle purchase must be an EV without the option to purchase a PHEV as in scenario 1. The emissions of the 15-year-old, 2005 model year scrapped vehicle in all 4 scenarios was estimated at 269 g CO2/km as per the analysis above and illustrated in Figure 5. Scenario 1 At an average of 20,000 km/yr and 269 g CO2/km emitted over the 2021 to 2030 period 53.8 tonnes of CO2 is deemed to be removed from the atmosphere by retiring this vehicle 10 years early (5.38 tonnes/yr over 10 years). To this value the forecasted emissions from the new vehicle purchase was added along with a pro-rated CO2 output from the early production of the vehicle; 10 years earlier than otherwise.xiv The new vehicle in the case of scenario 1 would be either an electric vehicle (EV) or a Plug in Hybrid Electric Vehicle (PHEV). It is assumed that the new vehicle uptake would be in the same proportion as demonstrated by 2019 sales, which was at a 64% to 36% ratio for EV to PHEV purchase respectively. Correspondingly with unique values of EV and PHEV g CO2/km emissions in Table 3 above; a weighted average emissions figure was applied to the new vehicle at 56.7 gCO2/km.xv This represents on average what a new vehicle replacing the scrapped vehicle would emit per kilometer driven. At 20,000 km/yr this yields an addition of 11.4 tonnes (1.14 tonnes a year over 10 years). The impact of early production adds an additional 2.2tonnes (also at a EV/PHEV weighted avg) for a total of 13.6 tonnes added from the new vehicle over the 10 year period. This is a net carbon reduction of approximately 40.2 tonnes over the 10 years timeframe under this scenario and associated assumptions. Scenario 1 A To build upon Scenario 1 above a more stringent Scenario 1A was developed. In this scenario the new vehicle purchase must be an EV. With the same assumptions on the scrapped vehicle, the net impact of xivThe impact of early production is calculated by using data from Bieker and Mock (2020) for CO2 emissions emitted during manufacturing of and ICEV, EV and PHEV vehicle as well as the kWh from battery production in the case of EVs and PHEV (converted to CO2 emissions). Source: https://theicct.org/publications/vehicle-replacement-programs-covid-19-may2020 xv See Annex 1 for full calculations of all new car emission estimates for all scenarios. 15 | P a g e
Canadian Passenger Vehicle Scrappage Policy Analysis

scrapping a 2005 model year vehicle and replacing with a 2020 EV is 45.7 tonnes of CO2 removed over
the 10-year 2021 to 2030 timeframe.

Scenario 2
Scenario 2 took the same approach with the same assumption on the scrapped vehicle. With regards to
the new vehicle purchase it was assumed with the incentive doubled on the purchase of an EV/PHEV the
uptake would also be double and thus at a 2:1 ratio (66% of consumers would opt for the EV/PHEV option
and 34% would opt for the ICEV option). This weighting was applied in determining the weighted average
CO2 emission figure of a new vehicle under this scenario. Further, with a higher premium on ICEV vehicles
with fuel consumption of 7 L/100km or lower; than those 7.1L/100km – 8L/100km (taken as 7.5 L/100km),
it is assumed this 34% for an ICEV uptake is split 22% and 12% respectively (also at a 2:1 ratio). Thus, the
weighted average CO2 emissions figure of a new vehicle in scenario 2 was calculated as 94.7 g CO2/km for
a total CO2 emissions of 18.9 tonnes CO2 added over 10 years (1.89 tonnes/yr over 10 years). With the
early production factor added for an additional 2.1 tonnes, this results in a total of 21.1 tonnes added
from the new vehicle over the 10-year period. With 53.8 tonnes of CO2 removed from the scrapped
vehicle this results in a net carbon reduction of approximately 32.7 tonnes

Scenario 3
Scenario 3 is similar to scenario 2 with the option of an EV/PHEV purchase or an ICEV purchase; with a
lower incentive applied to in the case an ICEV new vehicle is opted for. In this case however it is required
that the ICEV purchase is at least 30% more fuel efficient than that of the scrapped vehicle. With the 2005
model year scrapped vehicle as per scenario 1 & 2 deemed to emit 269 gCO2/km; equivalent to 11.39
L/100km; a vehicle that is 30% more fuel efficient would have a fuel consumption value that is at most
7.97 L/100km. This equates to CO2 emissions of 188 gCO2/kmxvi. Again, with an assumption of a 2:1 uptake
split of new purchases towards an EV or PHEV versus the ICEV vehicle (66 % EV/PHEV and 34% ICEV), on
average a new vehicle would have a CO2 emissions figure of 101.4 g CO2/km. Therefore, the CO2 emitted
over the 10-year span would be 20.3 tonnes added before early production and 22.4 tonnes added after
accounting for early production. With the removal of CO2 from the Scrapped vehicle at 53.8 tonnes the
net reduction would be 31.3 tonnes

A comparison of scenarios 1-3 compared to scenario 1A is below in tonnes per vehicle over 10-year
timeframe is illustrated below in Table 6.

16 | P a g e
Canadian Passenger Vehicle Scrappage Policy Analysis

Table 6: Comparison of Scenarios
                                                                  Scenario 1 Scenario 1A Scenario 2 Scenario 3

Tonnes CO2 Removed from Scrapped Vehicle                                53.8           53.8           53.8           53.8
Tonnes CO2 Added from New Vehicle
(including early production impact)
                                                                        13.6           8.0            21.1           22.4

                              Net Tonnes CO2 Emission Reduction         40.2           45.7           32.7           31.3
                                                 vs Scenario 1A         5.53                          13.08          14.41
                       % underperformance to Scenario 1A                -12%                          -29%           -31%

Baseline Comparison
The above scenarios were all compared against a baseline which assumes no restrictions on the new
vehicle purchase. As such a new vehicle would be assumed to be an average 2020 vehicle which is
estimated to emit 230.7 g CO2/km. The scrapped vehicle assumption remains the same at a 2005 MY
vehicle. Table 7 below is a comparison of the average CO2 emissions of a given new vehicle under the 4
scenarios compared to the baseline.

Table 7: CO2 emissions of new vehicle in each scenarios versus Baseline

Below in Table 8 are the results the scenarios versus the baseline case.

Table 8: Summary of Results = Table 1
                                                          BASELINE      Scenario 1 Scenario 1A Scenario 2 Scenario 3

         Tonnes CO2 Removed from Scrapped Vehicle              53.8             53.8           53.8           53.8       53.8
                Tonnes CO2 Added from New Vehicle
                                                               49.4             13.6            8.0           21.1       22.4
                    (including early production impact)
Net Tonnes CO2 Emission Reduction                                 4.3           40.2           45.7           32.7       31.3
              Incremental Tonnes Removed vs Baseline                            35.9           41.4           28.3       27.0
                            % improvement to Baseline                          827%           954%           653%       622%

It is evident and with no surprise that mandating a new vehicle purchase be an EV as Scenario 1A, yields
the best outcome in terms of net CO2 removed from the environment over a given timeframe. The greater
than 10-fold improvement however is quite compelling with more than 40 additional tonnes of CO2
removed from the environment per vehicle over a 10-year timeframe (greater than 4 tonnes per year, per
vehicle)

The total CO2 removed is a function of the assumed model year of the scrapped vehicle, the lifespan of
the vehicle, and the average number of kilometers driven per year; which in turn determines the
remaining life of the scrapped vehicle and the emissions prevented by scrapping the vehicle. Also
determined by the assumptions is the CO2 expected to be emitted by the new vehicle over this timeframe.
These variables however are held constant across all three scenarios so the improvement of Scenario 1A
vs the other scenarios will remain under different input assumptions.

17 | P a g e
Canadian Passenger Vehicle Scrappage Policy Analysis
Annex 1: Calculation of new vehicle emission values
Scenario 1 New Vehicle emissions 56.7 g CO2/km
Scenario 2 New Vehicle emissions 94.7 g CO2/km
Scenario 3 New Vehicle emissions 101.4 g CO2/km
Scenario 1A New Vehicle emissions 29.89 g CO2/km
Baseline: 230.7 CO2/km; 2020 Canadian fleet average estimate
Scenario 1:
EV or PHEV permitted as new vehicle
§ With 2019 EV and PHEV Sales at 35,305 units and 20,261 respectively; a 64% 36% split
§ 2019 EVs average to 29.9 g CO2/km
§ 2019 PHEVs average to 104.3 g CO2/km
Ø Weighted Average emissions for a given vehicle in Scenario 1:
(64%*29.9) + (36%*104.3)= 56.7 g CO2/km
Scenario 2:
EV or PHEV receives double the incentive of an ICEV less than 8.0 L/100km. Within the ICEV a higher
level of funding would be applied for the purchase of a vehicle 7.0 L/100km of lower versus an vehicle
7.1 L/100km to 8.0 L/100km
- It is assumed that with double the funding towards the purchase of an EV or PHEV that twice as
many consumers would opt for this choice over an ICEV
o Therefore 66% of consumers would opt for a EV or PHEV
o Amongst the remining 34%, it is assumed that vehicles 7.0 L/100km or lower will receive
twice the funding of a vehicle between 7.1 L/100km and 8.0 L/100km (a figure of 7.5
L/100km is chosen as representative of this range)
o It is therefore assume that of the remaining 22% of consumers will opt for a vehicle with
fuel consumption of 7.0 L/100km and 12 % will opt for a vehicle of 7.5 L/100km
§ 7.0L/100km vehicle option = 7/100 x 2348 g CO2/L gasoline = 164.36 g CO2/km
§ 7.5 L/100km vehicle option = 7.5/100 v 2348 g CO2/L gasoline = 176.08 g CO2/km
§ EV /PHEV option: as calculated in scenario 1 = 56.7 g CO2/km
Ø Weighted Average emissions for a given new vehicle in Scenario 2:
(66%* 56.7 g CO2/km) + (22% * 164.36) + (12%* 176.08) = 94.70 g CO2/km
Scenario 3:
EV or PHEV receives double the incentive of an ICEV. The ICEV must be at least 30% more fuel efficient
than the scrapped vehicle
18 | P a g eCanadian Passenger Vehicle Scrappage Policy Analysis
- ICEV Vehicle calculation:
o Scrapped vehicle: 2005 MY vehicle fuel efficiency 11.4 L/100km = 268.8 g CO2/km
o 30% fuel efficiency improvement = 7.97 L/100km = 187.1 g CO2/km
ICEV Vehicle = 187.1 g CO2/km
EV /PHEV option: as calculated in scenario 1 = 56.7 g CO2/km
With funding double for the EV/PHEV option it is also assumed that twice as many consumers will opt
for this option over the ICEV.
Ø Weighted Average emissions of a given vehicle in scenario 3:
(66%* 56.7g CO2/km) + (34% * 187.1 g CO2/km) = 101.4 gCO2/km
Scenario 1 A
New vehicle must be an EV
Ø Emissions of a given vehicle in Scenario 1A: 29.9 g CO2/km
Baseline
No restrictions on New Vehicle
Ø Emissions of an average 2020 vehicle: 230.7 g CO2/km
19 | P a g eCanadian Passenger Vehicle Scrappage Policy Analysis References 1Department of Finance Canada; Budget 2007; https://www.budget.gc.ca/2007/plan/bpc3-eng.html 2 Environment and Climate Change Canada; Evaluation of the National Vehicle Scrappage Program; July 12, 2011; https://www.ec.gc.ca/ae-ve/default.asp?lang=En&n=CD4EC913-1&printfullpage=true#wsDA566A19 ; Section 2.1 3 Evaluation of the National Vehicle Scrappage Program; Environment and Climate Change Canada; July 12 , 2011; https://www.ec.gc.ca/ae-ve/default.asp?lang=En&n=CD4EC913-1&printfullpage=true#wsDA566A19; Executive Summary 4 Evaluation of the National Vehicle Scrappage Program; Environment and Climate Change Canada; July 12 , 2011; https://www.ec.gc.ca/ae-ve/default.asp?lang=En&n=CD4EC913-1&printfullpage=true#wsDA566A19 5 Evaluation of the National Vehicle Scrappage Program; Environment and Climate Change Canada; July 12 , 2011; https://www.ec.gc.ca/ae-ve/default.asp?lang=En&n=CD4EC913-1&printfullpage=true#wsDA566A19; Section 4.1 6 https://scrapit.ca/; Aug 30,2020 7 Program offering cash rebates to scrap heavy polluting vehicles comes to Alberta; rdnewsNOW, Sept 1, 2020; https://rdnewsnow.com/2020/09/01/program-offering-cash-rebates-to-scrap-heavy-polluting-vehicles-comes-to-alberta/ 8 Valdes-Dapena, Peter. “Cash for Clunkers ending.” CNN Money. 21, August 2009. money.cnn.com/2009/08/20/autos/cash_for_clunkers_end/ 9 Office of Energy Efficiency & Renewable Energy. Fact #587: September, 2009 Cash for Clunkers Program – Fuel Economy Improvement; https://www.energy.gov/eere/vehicles/fact-587-september-7-2009-cash-clunkers-program-fuel-economy- improvement 10 Clean Cars for America; https://www.democrats.senate.gov/imo/media/doc/Clean%20Cars%20for%20America%20- %201pg%20summary.pdf 11 Joselow, Maxine. E&E News, Why Biden's car plan might not be a 'clunker'; August 4, 2020; https://www.eenews.net/stories/1063680019 12Daneshkhu, Scheherazade. ; Financial Times, French car sales surge on scrappage scheme, December 29, 2009; https://www.ft.com/content/c37ca570-f475-11de-9cba-00144feab49a 13 Carmakers should emerge greener from the crisis; Editorial Board, Financial Times; May 26,2020 https://www.ft.com/content/96ae2d26-9f4f-11ea-b65d-489c67b0d85d 14 MacRae, Calum. France moves first to bolster the automotive sector; Just-Auto.com; May 29 2020; https://www.just- auto.com/comment/france-moves-first-to-bolster-the-automotive-sector_id195801.aspx 15 Sigal, Peter. France to help auto Sector with measures worth $8.8B; Automotive News Europe, May 26, 2020; https://europe.autonews.com/automakers/france-help-auto-sector-measures-worth-88b 16 Mallet, Victor. Emmanuel Macron injects €8bn to fuel French car industry revival; Financial Times; May 26, 2020, https://www.ft.com/content/8e84e13b-d02f-4d90-839d-f99c3a0c1d95 17 French coronavirus recovery incentive scheme replaced after cap reached; Autovista Group, July 28, 2020; https://autovistagroup.com/news-and-insights/french-coronavirus-recovery-incentive-scheme-replaced-after-cap- reached 18 France is reshaping its car scrapping program; FR24 News, July 30 2020; https://www.fr24news.com/a/2020/07/france-is- reshaping-its-car-scrapping-program-automotive-industry-analysis.html 19 France is reshaping its car scrapping program; FR24 News, July 30 2020; https://www.fr24news.com/a/2020/07/france-is- reshaping-its-car-scrapping-program-automotive-industry-analysis.html 20 France is reshaping its car scrapping program; FR24 News, July 30 2020; https://www.fr24news.com/a/2020/07/france-is- reshaping-its-car-scrapping-program-automotive-industry-analysis.html 21 France is reshaping its car scrapping program; FR24 News, July 30 2020; https://www.fr24news.com/a/2020/07/france-is- reshaping-its-car-scrapping-program-automotive-industry-analysis.html 22 Statistics Canada. Table 20-10-0002-01 New motor vehicle sales, by type of vehicle; https://doi.org/10.25318/2010000201- eng; accessed Sept 13, 2020 23 Statistics Canada. Table 20-10-0001-01 New motor vehicle sales; https://doi.org/10.25318/2010000101-eng; accessed Sept 19, 2020 24 Statistics Canada. Table 20-10-0021-01 New motor vehicle registrations; https://doi.org/10.25318/2010002101-eng; accessed Sept 13, 2020 25 Canada Renewable Power Landscape 2017 – Energy Markets Analysis; Canadian Energy Regulator; Figure 4 (Greenhouse gas intensity of electricity generation by province and territory); https://www.cer- rec.gc.ca/nrg/sttstc/lctrct/rprt/2017cndrnwblpwr/ghgmssn- eng.html?=undefined&wbdisable=true#:~:text=In%202015%2C%20Canada%20emitted%20722,are%20non%2Demitting%20wh en%20generating 20 | P a g e
Canadian Passenger Vehicle Scrappage Policy Analysis

26 Canada Renewable Power Landscape 2017 – Energy Markets Analysis; Canadian Energy Regulator; Figure 4 (Greenhouse gas
intensity of electricity generation by province and territory); https://www.cer-
rec.gc.ca/nrg/sttstc/lctrct/rprt/2017cndrnwblpwr/ghgmssn-
eng.html?=undefined&wbdisable=true#:~:text=In%202015%2C%20Canada%20emitted%20722,are%20non%2Demitting%20wh
en%20generating
27 2018 Registrations: StatsCan 2018; Statistics Canada. Table 23-10-0067-01 Vehicle registrations, by type of vehicle
28 Passenger Car vs Light Truck Sales: Statistics Canada. Table 20-10-0002-01 New motor vehicle sales, by type of

vehicle; https://doi.org/10.25318/2010000201-eng; accessed Sept 13, 2020
29 Canada: Light-Duty: Fuel Consumption and GHG; TransportPolicy.net; https://www.transportpolicy.net/standard/canada-

light-duty-fuel-consumption-and-ghg/
30
   International Energy Agency (IEA), 2019, (Fuel Economy in Major Car Markets: Technology and Policy Drivers 2005-2017).
Licence: Creative Commons Attribution CC BY-NC-ND 3.0 IGO for all parts of the work except chapters 4 and Annex B, and
International Energy Agency (IEA)/International Council on Clean Transportation (ICCT), 2019, (Fuel Economy in Major Car
Markets: Technology and Policy Drivers 2005-2017). Licence: Creative Commons Attribution CC BY-NC-ND 3.0 IGO for chapters
4 and Annex B of the work.
31
   Environment and Climate Change Canada: Greenhouse Gas Emissions Performance for the 2018 Model Year Light Duty
Vehicle Fleet; Table 22 & Table 23
32
   Statistics Canada. Table 20-10-0002-01 New motor vehicle sales, by type of vehicle;
https://doi.org/10.25318/2010000201-eng; accessed Sept 21, 2020

21 | P a g e
You can also read