Sustainable development in the European Union Overview of progress towards the SDGs in an EU context - 2020 edition

Page created by Dave Davidson
 
CONTINUE READING
Sustainable development in the European Union Overview of progress towards the SDGs in an EU context - 2020 edition
Sustainable development
   in the European Union
Overview of progress towards
   the SDGs in an EU context              2020 edition

                         E U R O S TAT
          S U P P O R T S T H E S D GCs
Printed by Imprimerie Bietlot in Belgium
Manuscript completed in May 2020
4th edition
The European Commission is not liable for any consequence stemming from the reuse of this publication.
Luxembourg: Publications Office of the European Union, 2020

© European Union, 2020
The reuse policy of European Commission documents is implemented based on Commission Decision 2011/833/EU of 12
December 2011 on the reuse of Commission documents (OJ L 330, 14.12.2011, p. 39).
Except otherwise noted, the reuse of this document is authorised under a Creative Commons Attribution 4.0 International
(CC-BY 4.0) licence (https://creativecommons.org/licenses/by/4.0/). This means that reuse is allowed provided appropriate credit is
given and any changes are indicated.
For any use or reproduction of elements that are not owned by the European Union, permission may need to be sought directly
from the respective rightholders.
For more information, please consult: https://ec.europa.eu/eurostat/about/policies/copyright
Theme: General and regional statistics
Collection: Compact guides
Print ISBN 978-92-76-17454-7     doi:10.2785/089        KS-01-20-192-EN-C
PDF ISBN 978-92-76-17455-4       doi:10.2785/634624     KS-01-20-192-EN-N

Acknowledgements
Markus Hametner, Mariia Kostetckaia, Ingrid Setz (WU Vienna); Simon-Johannes Bley, Fritz Gebhard,
Johanna Giczi, Christine Mayer, Ekkehard Petri, Irina Schön, Anton Steurer (Eurostat, Unit E2 —
Environmental statistics and accounts; sustainable development)
Editor
Anna Sabadash (Eurostat, Unit E2 — Environmental statistics and accounts; sustainable development)
Production
Felicity McDonald, Carolyn Avery (ENDS, Haymarket Media Group Ltd)

  Content
  Sustainable development in the EU, 1
  SDG 1: No poverty, 6
  SDG 2: Zero hunger, 8
  SDG 3: Good health and well-being, 10
  SDG 4: Quality education, 12
  SDG 5: Gender equality, 14
  SDG 6: Clean water and sanitation, 16
  SDG 7: Affordable and clean energy, 18
  SDG 8: Decent work and economic growth, 20
  SDG 9: Industry, innovation and infrastructure, 22
  SDG 10: Reduced inequalities, 24
  SDG 11: Sustainable cities and communities, 26
  SDG 12: Responsible consumption and production, 28
  SDG 13: Climate action, 30
  SDG 14: Life below water, 32
  SDG 15: Life on land, 34
  SDG 16: Peace, justice and strong institutions, 36
  SDG 17: Partnerships for the goals, 38
  Annex, 40
EU SDG indicator set

Sustainable                                                       This regular monitoring is based on the EU SDG
                                                                  indicator set, developed in cooperation with a

development                                                       large number of partners and stakeholders. The
                                                                  indicator set comprises 100 indicators distributed

in the EU                                                         over the 17 SDGs. Thirty-six of these are multi-pur-
                                                                  pose indicators and monitor more than one goal.

Sustainable development has been at the
heart of European policy for a long time, firmly
anchored in the European Treaties. The 2030
Agenda for Sustainable Development and its
17 Sustainable Development Goals (SDGs),
adopted by the UN General Assembly in 2015,
have given a new impetus to global efforts to
achieve sustainable development. The EU has
fully committed itself to delivering on the 2030
Agenda and its implementation, as outlined in
the reflection paper ‘Towards a Sustainable
Europe by 2030’ (1) and ‘The European Green
Deal’ (2). Regular monitoring of progress
towards the SDGs in an EU context is essential
for this purpose.

(1) European Commission (2019), Reflection paper: Towards a
    Sustainable Europe by 2030, COM(2019)22.
(2) European Commission (2019), The European Green Deal,
    COM(2019) 640.

                                                              1
Monitoring progress towards the SDGs in an EU context

This brochure presents a statistical overview of the                         The overall assessment of EU progress towards the
most recent trends of the EU SDG indicators over                             SDGs presented in this edition of the brochure is not
a five-year period (‘short term’); the specific years                        fully comparable with the assessment presented in
depend on data availability for the individual indi-                         previous editions due to changes in the selection
cators. It shows EU progress towards the SDGs for                            of indicators for some goals and due to the switch
the individual indicators and also presents the aver-                        from EU-28 (including the UK) to EU-27 (excluding
age progress for each of the 17 SDGs, based on the                           the UK).
mean score of the selected indicators for the respec-
tive goal, including the multi-purpose indicators (3).                       The brochure does not show any effects of the COVID-
Studies and reports that consider current status                             19 pandemic, because it covers the situation in the
rather than progress, different indicators or different                      EU and its Member States up to 2019 at the latest.
time spans may come to different conclusions.

How has the EU progressed towards the SDGs?

On average, over the last five years of available data —                     In contrast, goals dealing with environmental aspects
based on the mean scores of the selected indicators                          of sustainability indicate slow or no EU progress over
— the EU has made progress towards almost all goals.                         the past few years overall. Progress towards the EU’s
Progress in some goals has been faster than in oth-                          climate and energy targets (SDG 7 and SDG 13) has in
ers, and within goals there has been movement away                           part stalled, as has the shift towards a circular econ-
from the sustain­able develop­ment objectives in some                        omy (SDG 12). Pressures on ecosystems and biodiver-
areas. A more detailed description of each indicator                         sity (SDG 15) have therefore have been increasing in
trend can be found in the 17 thematic chapters of this                       some areas.
brochure.
                                                                             The goals on education (SDG 4), innovation (SDG 9)
Over the most recent five-year period, the EU has                            and global partnerships (SDG 17) show an equally
made strong progress towards fostering peace and                             mixed picture. The slow progress towards reduc-
personal security, access to justice and trust in insti-                     ing inequalities (SDG 10) reflects a growing divide
tutions (SDG 16). Good progress, although markedly                           between EU nationals and non-EU citizens in relation
slower, was visible in reducing certain aspects of                           to poverty and employment. Similarly, in relation to
poverty (SDG 1) and improving the health of the EU                           gender equality (SDG 5), the gap between men and
population (SDG 3). The advances in these areas have                         women in acquiring education and on the labour
also helped to increase the quality of life in cities and                    market has been widening. Since SDG 5 shows more
communities (SDG 11). These favourable trends can be                         unfavourable than favourable trends for the EU, the
seen against the background of continued improve-                            aggregate past five-year progress has been moder-
ment in the EU economy up to 2019, which was also                            ately unsustainable.
reflected in the labour market (SDG 8). Improvements
were also visible in the viability and sustainability of                     In the case of two goals — SDG 6 ‘clean water and
the EU’s agriculture sector (SDG 2), although some of                        sanitation’ and SDG 14 ‘life below water’ — overall
its environmental impacts have intensified.                                  EU trends cannot be calculated due to insufficient
                                                                             data for the past five years.
(3) For a more detailed description of the approach for assessing EU progress towards the SDGs, see the introduction chapter (section 3.3) and
    Annex III in the 2020 edition of the EU SDG monitoring report.

        Eurostat supports the SDGs                                      2
Overview of EU-27 progress towards the SDGs over the past 5 years, 2020
(Data mainly refer to 2013–2018 or 2014–2019)

                                                                                                                  significant
                                                                                                                    progress

                                                                             3
                                                                             Good health

                                                        2
                                                                             and well-being
                                                                                                                   16
                                                                                                                   Peace, justice
                                                        Zero
                                                                                                                   and strong
                                                        hunger
                                                                                                                   institutions

                                                                                         1
                              4                                                          No poverty
                              Quality                       11
                              education                     Sustainable cities
                                                            and communities
                                                                                  8
                                                                                  Decent work
                                    17                                            and economic
                                                                                  growth
                                     Partnerships
           10                        for the goals
        Reduced
     inequalities
                                               12
                                                Responsible consumption
                                                and production

                                                            7
                                                            Affordable and
                                                            clean energy

                                                                                      Goals for which trends
                     15                                                               cannot be calculated (*)
                    Life on
                       land

            13
                                       9
                                       Industry,
                                                                                                     6    Clean water
                                                                                                          and sanitation

            Climate                    innovation and
            action                     infrastructure

5                                                                                                    14         Life below
                                                                                                                water
Gender         moderate moderate
equality      movement progress
                                                                                      (*) Due to lack of time series for
                  away                                                                    more than 25 % of the indicators

                                                        3
EU indicator trends

The following thematic chapters present short-                          Significant progress towards the EU
                                                                        target
term indicator trends for each of the 17 SDGs.
                                                                        or
These trends are assessed following specific
                                                                        Significant progress towards SD
quantitative rules. For indicators with quanti-                         objectives
tative EU targets, the brochure assesses their
progress towards those targets. This applies to                         Moderate progress towards the EU
16 out of the 100 indicators, mainly in the areas                       target
of climate, energy consumption, education, pov-                         or
erty and employment. Indicators with an associ-                         Moderate progress towards SD
                                                                        objectives
ated quantitative EU target are marked with the
following symbol     .                                                  Insufficient progress towards the EU
                                                                        target
Target values for each indicator are listed in the                      or
Annex. All other indicators are analysed accord-                        Insufficient progress towards SD
                                                                        objectives
ing to the direction and speed of change.

The assessment of indicator trends is presented                         Movement away from the EU
                                                                        target
visually in the form of arrows. The direction of the
                                                                        or
arrows shows whether an indicator has moved
                                                                        Movement away from SD objectives
towards or away from the sustainable develop-
ment objectives. Depending on the presence or
absence of a quantitative EU target, the indica-                        Assessment of trend not possible (for
tors are assessed differently. The following pres-                      example, time series too short)
entation illustrates the different cases.

                                                           Eurostat’s publication ‘Sustainable development
                                                           in the European Union — 2020 monitoring report
                                                           on progress towards the SDGs in an EU context’
                                                           describes the methodology applied and provides
                                                           a detailed analysis of progress for the individual
                                                           indicators.

  Eurostat supports the SDGs                           4
The 2020 EU SDG communication package

The brochure is part of an EU SDG communication package which comprises a number
of products:

  Sustainable Development
     in the European Union
                       MONITORING REPORT ON PROGRESS
                     TOWARDS THE SDGS IN AN EU CONTEXT       2020 edition

                                                                                          What are the sustainable development                    Why do the SDGs matter to me?                            Why should I use this digital publication?
                                                                                          goals (SDGs)?
                                                                                                                                                  The topics addressed by them touch many parts of         Do you want to find out how your country fares with
                                                                                          The SDGs, adopted by the UN General Assembly in         your life, the life of your family and friends as well   regards to living and working conditions, education,
                                                                                          2015, provide a new global policy framework aiming      as your country's future.                                climate change and innovation?
                                                                                          at ending all forms of poverty, fighting inequalities
                                                                                                                                                  The subset of EU SDG indicators presented here           Our interactive visualisations shed light on these and
                                                                                          and tackling climate change.
                                                                                                                                                  shall help you to better relate to this topic and        many more aspects: explore trends & compare your
                                                                                          They are divided into 17 interconnected goals which     provide statistics so you can better understand and      country to other European countries.
                                                                                          relate to social, economic and environmental            evaluate the situation of your country today.
                                                                                          aspects.                                                                                                                   

                                                                                                                                                                                                           Explore the different goals and find out
                                                                                                                                                                                                           about the situation of your country and
                                                                                                                                                                                                           compare it to other European countries.

                                             E U R O S TAT
                             S U P P O R T S T H E S D G1S
    Eurostat supports the SDGs

Interested in obtaining all                                                 Curious why the SDGs matter to you?
the details?                                                                The 2020 EU SDG digital publication ‘SDGs & me’ presents the
The 2020 EU SDG monitoring                                                  SDGs in a visual and personalised way, based on a selection of
report provides a detailed                                                  indicators across all 17 SDGs.
description of EU progress
towards the 17 SDGs in an
EU context.

                                                                                                                                                 Looking for the full overview of all
                                                                                                                                                 Eurostat SDG products and direct
                                                                                                                                                 access to all Eurostat SDG
                                                                                                                                                 publications, indicators, key findings,
                                                                                                                                                 data and much more?
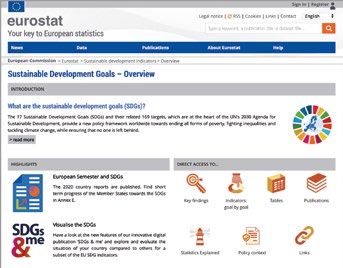
                                                                                                                                                 Eurostat SDG dedicated section
                                                                                                                                                 (https://ec.europa.eu/eurostat/web/
                                                                                                                                                 sdi/overview).

                                                                                                5
SDG 1           calls for the eradication of poverty in all its manifes-
                                                       tations. It envisions shared prosperity, a basic stand-
                                       ard of living and social protection benefits for people everywhere,
                                       including the poorest and most vulnerable. The goal seeks to
                                       ensure equal rights and access to economic and natural resources.

Indicators measuring EU progress towards SDG 1,
assessment of short-term trends

                       Material deprivation

                       Low work intensity

                       Poor dwelling conditions

                       Unmet need for medical care

                       Lack of sanitary facilities

                       Inability to keep home warm

                       Overcrowding rate

                       Risk of poverty or social exclusion

                       Income poverty

                       In work at-risk-of-poverty rate

 Eurostat supports the SDGs                          6
M U LT I D I M E N S I O N A L P O V E R T Y
 in 2018

                        Risk of poverty or social
                        exclusion                                            In work at-risk-of-poverty rate

                        94.8         million
                                     persons                                 9.2 %         of employed persons
                                                                                           aged 18 or over
                         - 11.6 % since 2013                                  + 0.1 pp since 2013

Income poverty                          Material deprivation                   Low work intensity

73.8       million
           persons                      26.7       million
                                                   persons                     28.2        million persons
                                                                                           aged less than 60
+ 0.5 % since 2013                       - 37.7 % since 2013                    - 19.1 % since 2013

 BASIC NEEDS
 in 2018

                 Poor dwelling conditions                                      Unmet need for medical care

                 13.6 %          of
                                 population                                    1.8 %          of population aged
                                                                                              16 and over
                 - 2.0 pp since 2013                                            - 2.2 pp since 2013

                Lack of sanitary facilities                                    Inability to keep home warm

                1.9 %          of
                               population                                      7.6 %         of
                                                                                             population
                 - 0.6 pp since 2013                                            - 3.2 pp since 2013

                                                      Overcrowding rate

                                                      17.1 %          of
                                                                      population
                                                       - 1.2 pp since 2013

Source: Eurostat (Online data codes: sdg_01_10, sdg_01_20, sdg_01_30, sdg_01_40, sdg_01_41, sdg_01_60, sdg_03_60, sdg_06_10,
sdg_07_60 and sdg_11_10)

                                                              7
SDG 2           seeks to end hunger and malnutrition and ensure
                                                      access to safe, nutritious and sufficient food. Realising
                                       this goal largely depends on promoting sustainable food produc-
                                       tion systems, as well as increased investment in rural infrastructure
                                       and agricultural research and development.

Indicators measuring EU progress towards SDG 2,
assessment of short-term trends

                       Agricultural factor income

                       Government support to agricultural R&D

                       Organic farming

                       Pesticides risk indicator

                       Severe soil erosion by water

                       Ammonia emissions from agriculture

                       Farmland bird index

                       Obesity rate

                       Nitrate in groundwater

 Eurostat supports the SDGs                           8
MALNUTRITION

                                                                Obesity rate in 2017

                                                                14.9 %              of population
                                                                                    aged 18 or over

 S U S TA I N A B L E AG R I C U LT U R A L P R O D U C T I O N

                    Agricultural factor income                                               Government support to
                    in 2019                                                                 agricultural R&D in 2018

                    124.5            Index,
                                     2010 = 100                                              EUR 2 828 million
                     + 12.2 index points since 2014                                          + 10.0 % since 2013

                    Organic farming in 2018                                                 Pesticides risk indicator in 2017

                    8.0 %            of utilised
                                     agricultural area                                       80    Index,
                                                                                                   2011–2013 = 100
                     + 2.1 pp since 2013                                                     - 20 % since 2011–2013

 E N V I R O N M E N TA L I M PAC T S O F AG R I C U LT U R A L P R O D U C T I O N

                    Ammonia emissions                                                        Nitrate in groundwater in 2017
                    from agriculture in 2017

                    3.4       million tonnes
                                                                                             19.1 mg           NO3 per litre

                     + 3.0 % since 2012

                   Severe soil erosion by water                                              Farmland bird index i n 2018
                   in 2016

                   5.3 %           of the total non-
                                   artificial erosive area
                                                                                             83.1       Index, 2000 = 100
                                                                                             - 1.5 index points since 2013
                    - 0.01 pp since 2010

(1) Indicators assessed against a quantitative policy target. See Annex for target values.

Source: Eurostat (Online data codes: sdg_02_10, sdg_02_20, sdg_02_30, sdg_02_40, sdg_02_51, sdg_02_60, sdg_06_40, sdg_15_50
and sdg_15_60)

                                                                     9
SDG 3          aims to ensure health and promote well-being for all
                                                     at all ages by improving reproductive, maternal and
                                      child health; ending epidemics of major communicable diseases; and
                                      reducing non-communicable and mental diseases. It also calls for
                                      reducing behavioural and environmental health-risk factors.

Indicators measuring EU progress towards SDG 3,
assessment of short-term trends

                       Suffering from noise

                       Concentration of particulate matter

                       Avoidable mortality

                       Deaths due to tuberculosis, HIV and hepatitis

                       People killed in accidents at work

                       Unmet need for medical care

                       Life expectancy at birth

                       Self-perceived health

                       Smoking prevalence

                       People killed in road accidents

                       Obesity rate

 Eurostat supports the SDGs                         10
H E A LT H Y L I V E S
 in 2018
                     Life expectancy at birth                                          Self-perceived health

                     81.0       years                                                  68.6 %             of population
                                                                                                          feeling in (very)
                                                                                                          good health
                      + 0.5 years since 2013
                                                                                        + 2.1 pp since 2013

 H E A LT H D E T E R M I N A N T S

                     Obesity rate in 2017                                             Smoking prevalence in 2017

                     14.9 %             of population
                                        aged 18 or over                                27 %          of population aged
                                                                                                     15 or over
                                                                                        - 1.0 pp since 2012

                     Concentration of                                                   Suffering from noise in 2018
                     particulate matter in 2017 (1)
                     smaller than 2.5 μm                                                18.2 %             of
                                                                                                           population

                     15.0 μg/m3                                                          - 0.9 pp since 2013

                      - 14.3 % since 2012

 C AU S E S O F D E AT H

                     Avoidable mortality in 2016                                        Deaths due to tuberculosis, HIV

                     253.5          per 100 000 persons
                                    aged less than 75 years
                                                                                         and hepatitis in 2016

                                                                                         2.8      per
                                                                                                  100 000 persons
                      - 9.2 % since 2011
                                                                                          - 24.3 % since 2011

                     People killed in accidents at                                       People killed in road
                     work in 2017                                                       accidents in 2018

                     1.8     per
                             100 000 employees                                           5.2      per
                                                                                                  100 000 persons
                      - 16.4 % since 2012                                                 - 5.5 % since 2013

 ACC E S S T O H E A LT H C A R E

                    Unmet need for medical care in 2018                    (1) It should be noted that although the average
                                                                                concentrations of fine particulate matter have

                    1.8 %          of population aged
                                   16 and over
                                                                                decreased during the past five years, the overall
                                                                                adverse health impacts of urban population exposure
                                                                                to air pollution by particulate matter PM2.5 remain
                     - 2.2 pp since 2013                                        significant. The annual mean for fine particulate
                                                                                matter continues to be above the World Health
                                                                                Organization’s recommended level.

Source: Eurostat (Online data codes: sdg_03_10, sdg_03_20, sdg_02_10, sdg_03_30, sdg_11_50, sdg_11_20, sdg_03_42, sdg_03_41,
sdg_08_60, sdg_11_40 and sdg_03_60)

                                                              11
                                                                                                                    Indicator for which a trend
                                                                                                                    cannot be calculated
SDG 4           seeks to ensure access to equitable and quality
                                                        education through all stages of life, as well as to
                                        increase the number of young people and adults having relevant
                                        skills for employment, decent jobs and entrepreneurship. The goal
                                        also envisages the elimination of gender and income disparities in
                                        access to education.

Indicators measuring EU progress towards SDG 4,
assessment of short-term trends

                       Early school leavers

                       Early childhood education

                       Tertiary educational attainment

                       Employed recent graduates

                       Adult learning

                       Underachievement in reading

                       Underachievement in maths

                       Underachievement in science

 Eurostat supports the SDGs                          12
B A S I C E D U C AT I O N

                       Early school leavers in 2019                                 Early childhood education in 2018

                       10.2 %            of population
                                         aged 18 to 24                               94.8 %            of children
                                                                                                       between 4 and
                                                                                                       the starting age
                        - 0.9 pp since 2014                                                            of compulsory
                                                                                                       education
                                                                                      + 0.9 pp since 2013

Underachievement in reading, maths and science in 2018
% of 15-year-old students who fail to reach level 2 in PISA

                     22.5 %                                     22.9 %                                      22.3 %
                      + 2.5 pp since 2015                        + 0.7 pp since 2015                        + 1.2 pp since 2015

 T E R T I A R Y E D U C AT I O N
 in 2019
                       Tertiary educational attainment                                     Employed recent graduates

                       40.3 %            of population
                                         aged 30 to 34                                     80.9 %           of population
                                                                                                            aged 20 to 34
                                                                                                            who completed
                        + 3.8 pp since 2014                                                                 ISCED 3–8
                                                                                            + 5.9 pp since 2014

 A D U LT L E A R N I N G

                                                      Adult learning in 2019

                                                      10.8 %            of population
                                                                        aged 25 to 64
                                                       + 0.7 pp since 2014

Source: Eurostat (Online data codes: sdg_04_10, sdg_04_30, sdg_04_40, sdg_04_20, sdg_04_50 and sdg_04_60)

                                                           13
SDG 5             aims to achieve gender equality by ending all forms
                                                        of discrimination, violence and any harmful practices
                                      against women and girls in the public and private spheres. It also
                                      calls for the full participation of women and equal opportunities for
                                      leadership at all levels of political and economic decision-making.

Indicators measuring EU progress towards SDG 5,
assessment of short-term trends

                       Gender pay gap

                       Women in parliaments

                       Women in senior management

                       Gender employment gap

                       Gender gap for employed recent graduates

                       Gender gap for early school leavers

                       Gender gap for tertiary educational attainment

                       Inactivity due to caring responsibilities

                       Physical and sexual violence

 Eurostat supports the SDGs                           14
GENDER-BASED VIOLENCE

                                                             Physical and sexual violence
                                                             in 2012

                                                             8%        of women
                                                                       aged 15 to 74

E D U C AT I O N
in 2019
                    Gender gap for early school                                      Gender gap for tertiary
                    leavers                                                          educational attainment

                    3.5 pp           to the disadvantage
                                     of men                                          10.5 pp             to the disadvantage
                                                                                                         of men
                     + 0.2 pp since 2014                                              + 1.5 pp since 2014

                                                       Gender gap for employed recent
                                                       graduates

                                                       4.6 pp          to the disadvantage
                                                                       of women
                                                        + 0.8 pp since 2014

E M P L OY M E N T

                     Gender employment                                                    Gender pay gap
                     gap in 2019                                                         in 2018

                     11.7 pp            to the disadvantage
                                        of women                                          14.8 %            of average
                                                                                                            gross hourly
                                                                                                            earnings of men
                      + 0.1 pp since 2014
                                                                                           - 1.2 pp since 2013

                     Inactivity due to caring responsibilities in 2019

                              32.2 %            of inactive women
                                                aged 20 to 64                       4.5 %          of inactive men
                                                                                                   aged 20 to 64
                               + 4.1 pp since 2014                                   + 1.1 pp since 2014

LEADERSHIP POSITIONS
in 2019

                     Women in parliaments                                                Women in senior management

                     32.1 %           of seats                                            28.4 %            of board
                                                                                                            members
                      + 4.3 pp since 2014                                                  + 8.6 pp since 2014

Source: Eurostat (Online data codes: sdg_05_10, sdg_04_10, sdg_04_20, sdg_04_50, sdg_05_20, sdg_05_30, sdg_05_40, sdg_05_50 and
sdg_05_60)

                                                             15
SDG 6         calls for ensuring universal access to safe and
                                                     affordable drinking water, sanitation and hygiene,
                                       and ending open defecation. It also aims to improve water quality
                                       and water-use efficiency and to encourage sustainable abstractions
                                       and supply of freshwater.

Indicators measuring EU progress towards SDG 6,
assessment of short-term trends

                       Lack of sanitary facilities

                       Phosphate in rivers

                       Bathing water quality

                       Biochemical oxygen demand in rivers

                       Population connected to wastewater treatment

                       Nitrate in groundwater

                       Water exploitation

 Eurostat supports the SDGs                          16
S A N I TAT I O N

                     Lack of sanitary facilities                                        Population connected to
                     in 2018                                                           wastewater treatment

                     1.9 %         of population
                                                                                        in 2017

                                                                                        ≥ 80 %             in 15 reporting
                                                                                                           Member States
                      - 0.6 pp since 2013

WAT E R Q UA L I T Y

                     Biochemical oxygen demand                                          Nitrate in groundwater
                     in rivers in 2017                                                 in 2017

                     2.0 mg            O2 per litre                                     19.1 mg             NO3 per litre
                      - 2.9 % since 2012

                     Phosphate in rivers i n 2017                                      Bathing water quality in 2018

                     0.09 mg               PO4 per litre                                80.9 %            of inland water
                                                                                                          bathing sites with
                                                                                                          excellent water
                      - 3.1 % since 2012                                                                  quality
                                                                                         + 4.2 pp since 2013

 WAT E R U S E E F F I C I E N C Y

                                                            Water exploitation in 2017

                                                            24     of the 27 Member States
                                                                   used water sustainably

Source: Eurostat (Online data codes: sdg_06_10, sdg_06_20, sdg_06_30, sdg_06_40, sdg_06_50, sdg_14_40 and sdg_06_60)

                                                              17
SDG 7           calls for ensuring universal access to modern energy
                                                     services, improving energy efficiency and increas-
                                     ing the share of renewable energy. To accelerate the transition
                                     to an affordable, reliable and sustainable energy system that ful-
                                     fils these demands, countries need to facilitate access to clean
                                     energy research and technology and to promote investment in
                                     resource- and energy-efficient solutions and low-carbon energy
                                     infrastructure.

Indicators measuring EU progress towards SDG 7,
assessment of short-term trends

                       Energy consumption in households

                       Energy productivity

                       Renewable energy

                       Inability to keep home warm

                      GHG intensity of energy consumption

                      Primary energy consumption

                      Final energy consumption

                      Energy dependency

 Eurostat supports the SDGs                        18
ENERGY CONSUMPTION
 in 2018
                   Primary energy                                                  Final energy
                   consumption                                                     consumption

                   1 376 Mtoe                                                      990 Mtoe
                    - 0.7 % since 2013                                              + 1.1 % since 2013

                        Energy consumption                                         Energy productivity 
                        in households

                        549 kgoe                                                   EUR 8.1            per kgoe
                                                                                    + 11.2 % since 2013
                         - 8.3 % since 2013

                                                       GHG intensity of energy
                                                       consumption

                                                       85.7        Index,
                                                                   2000 = 100
                                                        - 3.5 index points since 2013

 E N E R G Y S U P P LY
 in 2018

                        Renewable energy                                           Energy dependency

                        18.9 %           of gross
                                         final energy
                                         consumption
                                                                                   58.2 %            of imports in total
                                                                                                     energy consumption
                                                                                    + 4.3pp since 2013
                         + 2.2 pp since 2013

 ACC E S S T O A F F O R DA B L E E N E R G Y

                                                   Inability to keep home warm in 2017

                                                   7.6 %          of population
                                                    - 3.2 pp since 2013

Source: Eurostat (Online data codes: sdg_07_10, sdg_07_11, sdg_07_20, sdg_07_30, sdg_13_20, sdg_07_40, sdg_07_50 and sdg_07_60)

                                                             19
SDG 8           recognises the importance of sustained economic
                                                      growth and high levels of economic productivity for
                                      the creation of well-paid quality jobs, as well as resource efficiency
                                      in consumption and production. It calls for opportunities for full
                                      employment and decent work for all alongside the eradication of
                                      forced labour, human trafficking and child labour, and the promotion
                                      of labour rights and safe and secure working environments.

Indicators measuring EU progress towards SDG 8,
assessment of short-term trends

                       Real GDP per capita

                       Investment share of GDP

                       Not in employment, education or training

                       Long-term unemployment rate

                       Fatal work accidents

                       Resource productivity

                       Employment rate

                       In work at-risk-of-poverty rate

                       Inactivity due to caring responsibilities

 Eurostat supports the SDGs                         20
S U S TA I N A B L E E C O N O M I C G R O W T H

                      Real GDP per capita                                           Investment share of GDP
                      in 2019                                                       in 2019

                      EUR 27 990                                                    22.4 %            of GDP
                       + 10.2 % since 2014                                           + 2.2 pp since 2014

                                                           Resource productivity
                                                           in 2018

                                                           EUR 1.92              per kg DMC
                                                            + 4.3 % since 2013

E M P L OY M E N T
in 2019

                      Employment rate                                               Not in employment,

                      73.1 %            of population
                                        aged 20 to 64
                                                                                    education or training

                                                                                    12.6 %            of population
                                                                                                      aged 15 to 29
                       + 4.9 pp since 2014
                                                                                     - 3.1 pp since 2014

                      Long-term                                                     Inactivity due to caring
                      unemployment rate                                             responsibilities

                      2.8 %         of active
                                    population                                      22.2 %            of inactive population
                                                                                                      aged 20 to 64
                       - 2.7 pp since 2014                                           + 3.0 pp since 2014

DECENT WORK

                      Fatal work accidents in 2017                                  In work at-risk-of-poverty rate

                      1.8      per
                               100 000 employees
                                                                                    in 2018

                                                                                    9.2 %         of population aged
                                                                                                  18 or over
                       - 16.4 % since 2012
                                                                                     + 0.1 pp since 2013

Source: Eurostat (Online data codes: sdg_08_10, sdg_08_11, sdg_12_20, sdg_08_30, sdg_08_20, sdg_08_40, sdg_05_40, sdg_08_60 and
sdg_01_41)

                                                             21
SDG 9           calls for building resilient and sustainable infra-
                                                     structure and promotes inclusive and sustainable
                                     industrialisation. It also recognises the importance of research and
                                     innovation for finding lasting solutions to social, economic and envi-
                                     ronmental challenges.

Indicators measuring EU progress towards SDG 9,
assessment of short-term trends

                       Science and technology personnel

                       R&D personnel

                       Patent applications

                       R&D expenditure

                       Collective passenger transport

                       CO2 emissions from new passenger cars

                       Rail and waterways freight transport

 Eurostat supports the SDGs                        22
R & D A N D I N N O VAT I O N

                      R&D expenditure in 2018                                      R&D personnel in 2018

                      2.2 %          of GDP                                        1.3 %          of active population
                       + 0.1 pp since 2013                                          + 0.2 pp since 2013

                      Science and technology                                       Patent applications in 2019 
                      personnel in 2019 

                      46.9 %            of active
                                        population
                                                                                   66 459             applications to
                                                                                                      the EPO
                                                                                    + 6.1 % since 2014
                       + 3.9 pp since 2014

 S U S TA I N A B L E T R A N S P O R T

                      CO2 emissions from new                                        Collective passenger
                      passenger cars in 2018                                       transport in 2017

                      119.6 g           of CO2 per km                               17.1 %          of total inland
                                                                                                    passenger-km
                       - 5.4 % since 2013                                           - 0.6 pp since 2012

                                                        Rail and waterways freight transport
                                                        in 2018

                                                        24.7 %             of total inland
                                                                           freight tonne-km
                                                         - 1.4 pp since 2013

Source: Eurostat (Online data sources: sdg_09_10, sdg_09_30, sdg_09_21, sdg_09_40, sdg_12_30, sdg_09_50 and sdg_09_60)

                                                             23
SDG 10            addresses inequalities within and among coun-
                                                        tries. It calls for nations to reduce inequalities in
                                      income as well as those based on age, sex, disability, race, ethnicity,
                                      origin, religion or economic or other status within a country. The
                                      Goal also addresses inequalities among countries, including those
                                      related to representation, and calls for the facilitation of orderly and
                                      safe migration and mobility of people.

Indicators measuring EU progress towards SDG 10,
assessment of short-term trends

                       Urban-rural gap for people at risk of poverty or social exclusion

                       Disparities in disposable household income

                       Citizenship gap for early school leavers

                       Citizenship gap for NEET rate

                       Income distribution

                       Income share of bottom 40 %

                       Disparities in GDP per capita

                       At-risk-of-poverty gap

                       Citizenship gap for income poverty

                       Citizenship gap for employment rate

                       Asylum applications

 Eurostat supports the SDGs                            24
I N E Q UA L I T I E S W I T H I N C O U N T R I E S
 in 2018
                    Income distribution                                           At-risk-of-poverty gap

                    5.1      income quintile
                             share ratio                                          24.5 %            distance to poverty
                                                                                                    threshold
                     ± 0.0 points since 2013                                       + 0.1 pp since 2013

                   Income share of bottom 40 %                                     Urban-rural gap for risk of poverty

                   21.2 %           of income
                                                                                   or social exclusion

                                                                                   2.2 pp           higher rate in rural
                                                                                                    areas
                    ± 0.0 pp since 2013
                                                                                    - 2.1 pp since 2013

 I N E Q UA L I T I E S B E T W E E N C O U N T R I E S
 in 2018

                   Disparities in GDP                                            Disparities in disposable
                   per capita                                                   household income

                   42.1 %           variation
                                    coefficient                                  25.2 %            variation
                                                                                                   coefficient
                    - 0.5 pp since 2013                                           - 4.7 pp since 2013

 M I G R AT I O N A N D S O C I A L I N C L U S I O N

                   Asylum applications                                           Citizenship gap for income
                   in 2019                                                      poverty in 2018

                   1 371          per million
                                  inhabitants                                    23.5 pp             to the disadvantage
                                                                                                     of non-EU citizens
                                                                                  + 0.1 pp since 2013

                   Citizenship gap for early                                     Citizenship gap for NEET rate
                   school leavers in 2019                                        in 2019

                   18.1 pp            to the
                                      disadvantage of
                                      non-EU citizens
                                                                                 12.4 pp             to the disadvantage
                                                                                                     of non-EU citizens
                                                                                  - 0.3 pp since 2014
                    - 0.4 pp since 2014

                                                       Citizenship gap for employment
                                                       rate in 2019

                                                       13.8 pp              to the disadvantage
                                                                            of non-EU citizens
                                                        + 0.8 pp since 2014

Source: Eurostat (Online data sources: sdg_01_10a, sdg_01_20a, sdg_04_10a, sdg_08_20a, sdg_08_30a, sdg_10_30, sdg_10_41,
sdg_10_50, sdg_10_10, sdg_10_20 and sdg_10_60)

                                                              25
SDG 11           aims to renew and plan cities and other human
                                                       settle­ments in a way that offers opportunities for
                                      all, with access to basic services, energy, housing, transportation
                                      and green public spaces, while reducing resource use and environ-
                                      mental impact.

Indicators measuring EU progress towards SDG 11,
assessment of short-term trends

                       Overcrowding rate

                       Suffering from noise

                       Concentration of particulate matter

                       Poor dwelling conditions

                       Reported occurrence of crime

                       Recycling of municipal waste

                       People killed in road accidents

                       Collective passenger transport

                       Settlement area

                       Population connected to wastewater treatment

 Eurostat supports the SDGs                         26
Q UA L I T Y O F L I F E I N C I T I E S A N D C O M M U N I T I E S

                   Overcrowding rate in 2018                                        Poor dwelling conditions in 2018

                   17.1 %           of
                                    population                                       13.6 %             of
                                                                                                        population
                    - 1.2 pp since 2013                                               - 2.0 pp since 2013

                   Suffering from noise in 2018                                     Reported occurrence of crime in 2018

                   18.2 %            of
                                     population                                      11.5 %             of
                                                                                                        population
                    - 0.9 pp since 2013                                               - 2.6 pp since 2013

                   Concentration of particulate
                   matter (1) in 2017 
                                                              (1) It should be noted that although the average concentrations of fine
                   smaller than 2.5 μm                            particulate matter have decreased during the past five years, the

                   15.0 μg/m3                                     overall adverse health impacts of urban population exposure to air
                                                                  pollution by particulate matter PM2.5 remain significant. The annual
                                                                  mean for fine particulate matter continues to be above the World Health
                    - 14.3 % since 2012                           Organization’s recommended level.

 S U S TA I N A B L E M O B I L I T Y

                       People killed in road                                         Collective passenger transport
                       accidents in 2018                                             in 2017

                       23 339            persons                                     17.1 %            of total inland
                                                                                                       passenger-km
                        - 3.6 %    since 2013                                         - 0.6 pp since 2012

 E N V I R O N M E N TA L I M PAC T S

                   Recycling of municipal waste                                      Population connected to
                   in 2018                                                          wastewater treatment in 2017

                   47.4 %           of total waste
                                    generated                                        ≥ 80 %                in 15 reporting
                                                                                                           Member States
                    + 5.9 pp since 2013

                                                  Settlement area in 2018

                                                  703.4 m2                 per
                                                                           capita
                                                   + 3.4 % since 2015

Source: Eurostat (Online data sources: sdg_11_50, sdg_11_10, sdg_01_60, sdg_11_20, sdg_16_20, sdg_11_40, sdg_09_50, sdg_11_60,
sdg_06_20 and sdg_11_31)

                                                              27
SDG 12            envisions sustainable production and consump-
                                                        tion based on advanced technological capacity,
                                      resource efficiency and reduced global waste. It calls on research-
                                      ers, businesses and policy to develop sustainable production meth-
                                      ods and promotes responsible consumption among consumers.

Indicators measuring EU progress towards SDG 12,
assessment of short-term trends

                       Energy productivity

                       Environmental goods and services

                       Resource productivity

                       Circular material use

                       Consumption of toxic chemicals

                       CO2 emissions from new passenger cars

                       Generation of waste

 Eurostat supports the SDGs                        28
D E C O U P L I N G E N V I R O N M E N TA L I M PAC T S F R O M E C O N O M I C G R O W T H
 in 2018

                        Consumption of toxic                                          Resource productivity
                        chemicals

                        220.7         million tonnes
                                                                                      EUR 1.92               per kg
                                                                                       + 4.3 % since 2013
                         + 1.9 % since 2013

                        Energy productivity                                          CO2 emissions from new
                                                                                      passenger cars 
                        EUR 8.1            per kgoe
                                                                                      119.6 g           of CO2 per km
                         + 11.2 % since 2013
                                                                                       - 5.4 % since 2013

GREEN GROWTH

                                                          Environmental goods and
                                                          services i n 2017

                                                          EUR 268.1                billion of value
                                                                                   added
                                                           + 10.1 % since 2012

WA S T E G E N E R AT I O N A N D M A N AG E M E N T

                        Circular material use in 2017                               Generation of waste i n 2016

                        11.2 %            of material input
                                          for domestic use                            1 765         kg per capita
                         + 0.1 pp since 2012                                           + 2.6 % since 2012

Source: Eurostat (Online data sources: sdg_12_10, sdg_12_20, sdg_07_30, sdg_12_30, sdg_12_61, sdg_12_41 and sdg_12_50)

                                                             29
SDG13              seeks to implement the commitment to the United
                                                          Nations Framework Convention on Climate Change
                                       and deliver on the Green Climate Fund. It aims to strengthen coun-
                                       tries’ resilience and adaptive capacity to climate-related hazards and
                                       the resulting natural disasters with a special focus on supporting
                                       least-developed countries.

Indicators measuring EU progress towards SDG 13,
assessment of short-term trends

                       Renewable energy

                       Covenant of Mayors for Climate and Energy signatories

                       GHG intensity of energy consumption

                       Greenhouse gas emissions

                       CO2 emissions from new passenger cars

                       Ocean acidity

                       Near surface temperature deviation

                       Climate-related economic losses

                       Climate-related expenditure

 Eurostat supports the SDGs                          30
C L I M AT E M I T I G AT I O N
in 2018

                  Greenhouse gas                                                    GHG intensity of energy
                  emissions (1)                                                     consumption

                  79.4        Index,
                              1990 = 100                                            85.7        Index,
                                                                                                2000 = 100
                   - 2.2 index points since 2013                                     - 3.5 index points since 2013

                  Renewable energy                                                 CO2 emissions from new
                                                                                    passenger cars
                  18.9 %           of gross final energy
                                   consumption
                                                                                    119.6 g           of CO₂ per km
                   + 2.2 pp since 2013
                                                                                     - 5.4 % since 2013

 C L I M AT E I M PAC T S

                                                                                    Climate-related economic
                 Near surface temperature                                           losses in 2017
                 deviation in 2009 –2018
                                                                                    EUR 12.1 billion
                                                                                     + 7.6 % since 2012

 Global:       0.91        °C deviation,
                           compared to                                              Ocean acidity in 2018

 European:     1.61        1850–1899
                           average                                                  8.06 pH             value
                                                                                     - 0.1 % since 2013

S U P P O R T T O C L I M AT E AC T I O N

                  Climate-related expenditure                                       Covenant of Mayors for Climate
                  in 2017 (2)                                                      and Energy signatories in 2019

                  EUR 19.4 billion                                                  41.6 %            of population
                                                                                     + 6.8 pp since 2014

(1) 2018 data are provisional estimates based on the EEA’s approximated GHG inventory for the year 2018.
(2) Data refer to EU Member States, the European Commission and the European Investment Bank.
Source: Eurostat (Online data sources: sdg_13_10, sdg_13_20, sdg_07_40, sdg_12_30, sdg_13_30, sdg_13_40, sdg_14_50, sdg_13_50
and sdg_13_60)

                                                             31
SDG 14              aims to protect and ensure the sustainable use
                                                         of oceans. This includes the reduction of marine
                                      pollution and the impacts of ocean acidification, the ending of over-
                                      fishing and the conservation of marine and coastal areas and ecosys-
                                      tems. SDG 14 has strong interdependencies with a broad range of
                                      other SDGs, as oceans sustain coastal economies and livelihoods and
                                      contribute to food production, while at the same time functioning as
                                      a sink for land- and sea-based pollution.

Indicators measuring EU progress towards SDG 14,
assessment of short-term trends

                        Natura 2000 marine sites

                       Bathing water quality

                       Mean ocean acidity

                       Trends in fish stock biomass

                       Overfishing

 Eurostat supports the SDGs                           32
O C E A N H E A LT H
 in 2018
                                               Bathing water quality

                                               88.1 %              of coastal bathing sites with
                                                                   excellent water quality
                                                + 2.3 pp since 2013

                                               Mean ocean acidity 

                                               8.06 pH               value

                                                - 0.1% since 2013

 M A R I N E C O N S E R VAT I O N

                                               Natura 2000 marine sites
                                               in 2019

                                               441 001 km2
                                                + 80.7 % since 2014

 S U S TA I N A B L E F I S H E R I E S
 in 2018
                                              Trends in fish stock biomass(1)

                                              148        Index, 2003 = 100
                                               + 41 index points since 2013

                                              Overfishing( 1)

                                              38.2 %                of fish stocks
                                               - 13.2 pp since 2013

(1) Data refer to the North-East Atlantic and adjacent seas.
Source: Eurostat (Online data sources: sdg_14_40, sdg_14_50, sdg_14_10, sdg_14_21 and sdg_14_30)

                                                              33
SDG 15           seeks to protect, restore and promote the conser-
                                                       vation and sustainable use of terrestrial, inland-­
                                      water and mountain ecosystems. This includes efforts to sustaina-
                                      bly manage forests and halt deforestation, combat desertification,
                                      restore degraded land and soil, halt biodiversity loss and protect
                                      threatened species.

Indicators measuring EU progress towards SDG 15,
assessment of short-term trends

                       Phosphate in rivers

                       Forest area

                       Biochemical oxygen demand in rivers

                       Severe soil erosion by water

                       Grassland butterfly index

                       All common bird index

                       Natura 2000 terrestrial sites

                       Soil sealing index

 Eurostat supports the SDGs                            34
E C O S Y S T E M S TAT U S

                     Biochemical oxygen demand                                         Phosphate in rivers in 2017 
                     in rivers in 2017 

                     2.0 mg            O2 per litre
                                                                                       0.09 mg              PO4 per litre
                                                                                        - 3.1 % since 2012
                     - 2.9 % since 2012

                                                      Forest area in 2018 

                                                      43.4 %           of total
                                                                       land area
                                                       + 0.8 pp since 2015

 L A N D D E G R A DAT I O N

                   Severe soil erosion by water                                        Soil sealing index in 2015
                   in 2016

                   5.3 %           of the total non-
                                   artificial erosive area
                                                                                       104.5           Index, 2006 = 100
                                                                                        + 2.7 index points since 2009
                    - 0.01 pp since 2010

 BIODIVERSITY

                    Natura 2000 terrestrial sites
                    in 2019                                                           All common bird index in 2018

                    763 986 km2                                                        95.7          Index, 2000 = 100
                     + 0.4 % since 2014                                                 + 0.5 index points since 2013

                                                          Grassland butterfly index in 2017

                                                          74.1       Index, 2000 = 100
                                                           + 1.9 index points since 2012

Source: Eurostat (Online data sources: sdg_06_30, sdg_06_50, sdg_15_10, sdg_15_50, sdg_15_41, sdg_15_20, sdg_15_60
and sdg_15_61)

                                                              35
SDG 16            calls for peaceful and inclusive societies based on
                                                         respect for human rights, protection of the most
                                       vulnerable, the rule of law and good governance at all levels. It also
                                       envisions transparent, effective and accountable institutions.

Indicators measuring EU progress towards SDG 16,
assessment of short-term trends

                       Homicide rate

                       Occurrence of crime

                       Expenditure on law courts

                       Perceived independence of judiciary

                       Confidence in EU institutions

                       Corruption perceptions index

 Eurostat supports the SDGs                         36
P E AC E A N D P E R S O N A L S E C U R I T Y

                      Homicide rate in 2016                                         Occurrence of crime

                      0.7      per
                               100 000 inhabitants
                                                                                     in 2018

                                                                                     11.5 %           of population
                       - 0.2 per 100 000 since 2011
                                                                                      - 2.6 pp since 2013

ACC E S S T O J U S T I C E

                                                       Expenditure on law courts
                                                       in 2018

                                                       EUR 43 156 million
                                                        + 12.8 % since 2013

                                                       Perceived independence
                                                       of judiciary in 2019

                                                       54 %          of population
                                                                     perceived it very good
                                                                     or fairly good
                                                        + 4 pp since 2016

TRUST IN INSTITUTIONS
in 2019
                                             Corruption Perceptions Index
                                             Member States                           Score scale of
                                             perceptions
                                             range from           43–87              0 (highly corrupt)
                                                                                     to 100 (very clean)

                     Confidence in EU institutions 
                     European Parliament         European Commission                      European Central Bank

                     54 %         of
                                  population            47 %         of
                                                                     population           44 %         of
                                                                                                       population
                      + 11 pp since 2014                 + 8 pp since 2014                 + 8 pp since 2014

Source: Eurostat (Online data sources: sdg_16_10, sdg_16_20, sdg_16_30, sdg_16_40, sdg_16_50 and sdg_16_60)

                                                             37
SDG 17              calls for a global partnership for sustainable
                                                         development. The goal highlights the importance
                                     of global macroeconomic stability and the need to mobilise finan-
                                     cial resources for developing countries from international sources,
                                     as well as through strengthened domestic capacities for revenue
                                     collection. It also highlights the importance of trade for developing
                                     countries and equitable rules for governing international trade.

Indicators measuring EU progress towards SDG 17,
assessment of short-term trends

                       Imports from developing countries

                       General government gross debt

                       Official development assistance

                       Financing to developing countries

                       Environmental taxes

 Eurostat supports the SDGs                        38
G L O B A L PA R T N E R S H I P

                                                           Official development
                                                           assistance in 2019 (1)

                                                           0.41 %           of gross national
                                                                            income (GNI)
                                                            + 0.03 pp since 2014

                                                           Financing to developing
                                                           countries in 2018

                                                           EUR 104.1 billion
                                                            - 2.4 % since 2013

                                                           Imports from developing
                                                           countries in 2018

                                                           EUR 894.0 billion
                                                            + 25.5 % since 2013

 FINANCIAL GOVERNANCE WITHIN THE EU

                                                           General government
                                                           gross debt in 2019

                                                           77.8 %             of GDP
                                                            - 8.8 pp since 2014

                                                           Environmental taxes
                                                           in 2018

                                                           6.0 %         of total tax revenues
                                                            - 0.2 pp since 2013

(1) Data include EU Member States and EU institutions.
Source: Eurostat (Online data sources: sdg_17_10, sdg_17_20, sdg_17_30, sdg_17_40 and sdg_17_50)

                                                              39
Annex
EU SDG indicators assessed against quantitative EU targets
 Code            Name                                                   Target value             Target year        SDGs

sdg_01_10        Risk of poverty or social exclusion                    - 20 million                2020             1

sdg_04_10        Early school leavers                                   < 10 %                      2020             4

sdg_04_20 Tertiary educational attainment                               ≥ 40 %                      2020             4

sdg_04_30 Early childhood education                                     ≥ 95 %                      2020             4
sdg_04_40 Underachievement in reading, maths                            < 15 %                      2020
          and science
                                                                                                                     4

sdg_04_50 Employed recent graduates                                     ≥ 82 %                      2020             4

sdg_04_60 Adult learning                                                > 15 %                      2020             4

sdg_07_10        Primary and final energy consumption                   + 20 %                      2020             7
sdg_07_11                                                               efficiency

sdg_07_40        Renewable energy                                       ≥ 20 %                      2020             7 13

sdg_08_30 Employment rate                                               ≥ 75 %                      2020             8

sdg_09_10        R&D expenditure                                        ≥3%                         2020             9

sdg_11_40        People killed in road accidents                        - 50 % of 2010              2020             3 11

sdg_11_60        Recycling of municipal waste                           ≥ 60 %                      2030            11

sdg_12_30        CO2 emissions from new passenger cars                  ≤ 95 g CO2                  2021             9 12 13
                                                                        per km

sdg_13_10        Greenhouse gas emissions                               - 40 % of 1990              2030            13

sdg_17_10        Official development assistance                        ≥ 0.7 %                     2030            17
Note: Assessment of the risk of poverty or social exclusion (sdg_01_10) is based on data for the EU including the UK but excluding
Croatia; assessment of primary and final energy consumption (sdg_07_10 and sdg_07_11) is based on EU-28.

  Eurostat supports the SDGs                                      40
Getting in touch with the EU
In person
All over the European Union there are hundreds of Europe Direct information centres.
You can find the address of the centre nearest you at:
https://europa.eu/european-union/contact/meet-us_en
On the phone or by email
Europe Direct is a service that answers your questions about the European Union. You
can contact this service:
— by freephone: 00 800 6 7 8 9 10 11 (certain operators may charge for these calls),
— at the following standard number: +32 22999696 or
— by email via: https://europa.eu/european-union/contact_en

Finding information about the EU
Online
Information about the European Union in all the official languages of the EU is available
on the Europa website at: https://europa.eu/european-union/index_en
EU publications
You can download or order free and priced EU publications at:
https://op.europa.eu/en/publications.
Multiple copies of free publications may be obtained by contacting Europe Direct or your
local information centre (see https://europa.eu/european-union/contact/meet-us_en).
EU law and related documents
For access to legal information from the EU, including all EU law since 1952 in all the
official language versions, go to EUR-Lex at: http://eur-lex.europa.eu
Open data from the EU
The EU Open Data Portal (http://data.europa.eu/euodp/en) provides access to datasets
from the EU. Data can be downloaded and reused for free, for both commercial and
non-commercial purposes.
PDF: KS-01-20-192-EN-N
                                                                                                   Print: KS-01-20-192-EN-C
Sustainable development in
the European Union
Overview of progress towards the SDGs in
an EU context

This brochure is a ‘light’ version of Eurostat’s publication ‘Sustainable
development in the European Union — 2020 monitoring report on progress
towards the SDGs in an EU context’, conveying its main messages in a visual
and concise way. The brochure builds on the EU SDG indicator set which
comprises around 100 indicators structured around the 17 SDGs. It presents
a statistical overview of trends for each indicator, described on the basis of a
set of specific quantitative rules and focusing on short-term trends over the
past five years. For a detailed presentation of the EU trends and a description
of the methodology, please refer to the full Eurostat SDG publication.

For more information
https://ec.europa.eu/eurostat/

                                                                                   Print: 978-92-76-17454-7
                                                                                   PDF: 978-92-76-17455-4
You can also read