Three-dimensional shape analysis of peripapillary retinal pigment epithelium-basement membrane layer based on OCT radial images
←
→
Page content transcription
If your browser does not render page correctly, please read the page content below
Nanotechnology Reviews 2021; 10: 453–464
Research Article
Junfei Tong#, Pengfei Dong#, Sachin Kedar, Deepta Ghate, and Linxia Gu*
Three-dimensional shape analysis of
peripapillary retinal pigment epithelium-
basement membrane layer based on OCT
radial images
https://doi.org/10.1515/ntrev-2021-0035 with application to six eyes from four patients, who
received May 12, 2021; accepted May 27, 2021 underwent medically necessary lumbar puncture. The
Abstract: The peripapillary retinal pigment epithelium- fitted curve from our mathematical model matched well
basement membrane (ppRPE/BM) layer angle was recently with the experimental measurements (R2 > 0.9 in most
proposed as a potential index for estimating intracranial cases). This further validated our mathematical model.
pressure noninvasively. However, the ppRPE/BM layer The proposed model in this study has elucidated the var-
angle, measured from the optical coherence tomography iations of ppRPE/BM layer angle across 2D radial scans
(OCT) scans, varied across the radial directions of the from the perspective of the ppRPE/BM layer 3D mor-
optic disc. This made the ppRPE/BM layer angle difficult phology. It is expected that the ppRPE/BM layer 3D angle
to be utilized in its full potential. In this study, we devel- developed in this study could be further exploited as a
oped a mathematical model to quantify the ppRPE/BM new biomarker for the optic disc.
layer angles across radial scans in relation to the Keywords: optical coherence tomography, retinal layer,
ppRPE/BM 3D morphology in terms of its 3D angle and tilt, ppRPE/BM layer angle, mathematical model, ima-
scanning tilt angles. Results showed that the variations of ging analysis, intracranial pressure
the ppRPE/BM layer angle across radial scans were well
explained by its 3D angle and scanning tilt angles. The
ppRPE/BM layer 3D angle was reversely fitted from the
measured ppRPE/BM layer angles across radial directions 1 Introduction
Optical coherence tomography (OCT) has been widely
used in ophthalmology for providing high-resolution
# Junfei Tong and Pengfei Dong contributed equally to this work. in vivo retinal structures [1,2]. The retinal OCT scans
have been used for the diagnosis and the assessment of
various ophthalmological diseases (e.g., glaucoma and
* Corresponding author: Linxia Gu, Department of Biomedical and
Chemical Engineering and Sciences, Florida Institute of Technology
macular edema) [3–5]. In our recent study, we found
(FIT), Melbourne, FL 32901, United States of America, that the angle of the peripapillary retinal pigment epithe-
e-mail: gul@fit.edu, tel: +1-321-674-8447 lium-basement membrane (ppRPE/BM) layer changed
Junfei Tong: Department of Mechanical and Materials Engineering, following the reduced intracranial pressure (ICP) proce-
University of Nebraska-Lincoln, Lincoln, NE 68588-0656, dure [6]. This implies that the ppRPE/BM layer angle might
United States of America
be a potential index for the noninvasive assessment of the
Pengfei Dong: Department of Biomedical and Chemical Engineering
and Sciences, Florida Institute of Technology (FIT), Melbourne, ICP, which is of great importance in clinical practice as
FL 32901, United States of America abnormal ICP is a major risk factor for ophthalmological
Sachin Kedar: Department of Neurological Sciences, University of and neurological diseases [7–10]. Such noninvasive ICP
Nebraska Medical Center, Omaha, NE 68198-8440, United States of assessment would also be highly valuable to human health
America; Stanley Truhlsen Eye Institute, University of Nebraska
countermeasures for spaceflight to mitigate microgravity-
Medical Center, Omaha, NE 68105-1119, United States of America
Deepta Ghate: Department of Ophthalmology and Visual Sciences,
induced visual impairments [11,12].
University of Nebraska Medical Center, Omaha, NE 68105-1119, Common OCT images consisted of multiple B-scans,
United States of America each of which provides a two-dimensional (2D) cross-
Open Access. © 2021 Junfei Tong et al., published by De Gruyter. This work is licensed under the Creative Commons Attribution 4.0
International License.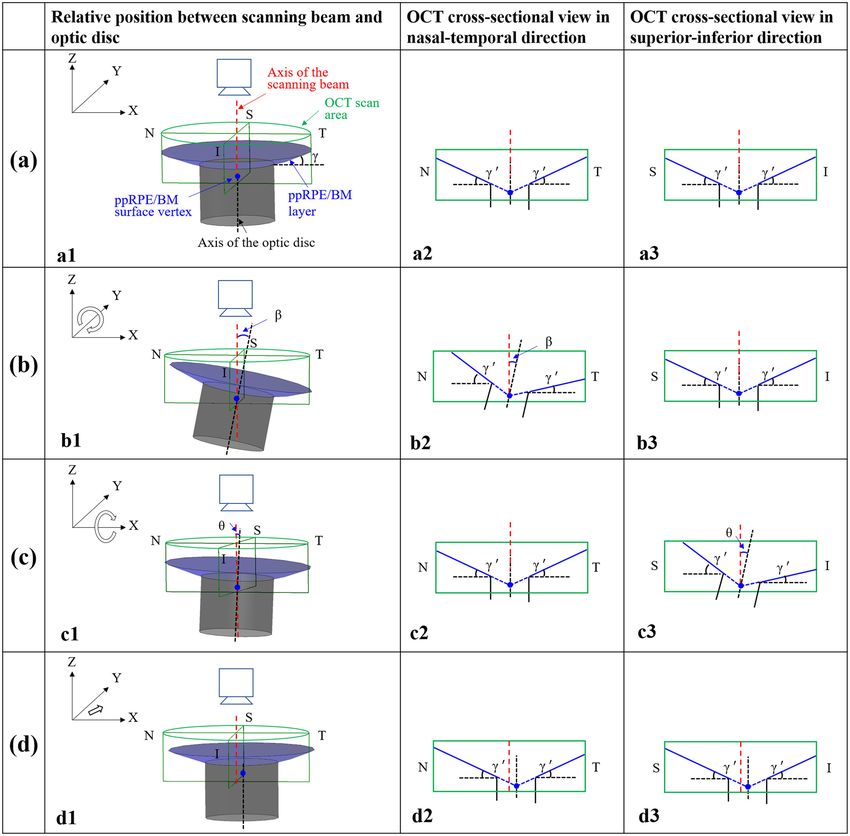
454 Junfei Tong et al.
sectional view. However, the ppRPE/BM layer angle varied of six eyes from four patients, who underwent medically
in these 2D scans due to image tilting. Sibony et al. [13] necessary lumbar puncture, were analyzed using the
have shown that such image tilting was due to the method herein.
oblique orientation of the scanning beam to the optic
disc. Symmetric and untilted OCT scans at the nasal-tem-
poral direction required the scanning beam of the OCT
machine to be perpendicular to the optic disc, e.g., par-
2 Methods
allel to the axis of the optic nerve [13,14]. In this way,
the ppRPE/BM layer angle in each radial scan is approxi- 2.1 Schematic diagrams of the 3D ppRPE/
mately the same, indicating that the 3D shape of the BM layer and its 2D radial scans
ppRPE/BM layer is conical. However, such imaging pro-
tocol is challenging to be implemented considering The image tilting contributes to the variation of the mea-
the uncontrollable eye movements and operator factors sured ppRPE/BM layer angle across different radial scans,
during the acquisition process [15]. In clinical practice, which limits its application in broader fields. It is impor-
the OCT scanning beam is oblique toward the optic disc, tant to notice the direction and location of the OCT scan-
leading to a tilted retinal image [15–18]. Specifically, ning beam is manually controlled by physicians during
Hariri et al. [15] reported that the mean inclination angle the image acquisition process, as illustrated in Figure 1
for the macular scans is 14.52 ± 2.63° at temporal posi- [25]. If the scanning beam can be positioned perpendi-
tioning. Hong et al. [16] reported a mean value of 12.62 ± cular to the optic disc or aligned with the optic nerve,
5.17° for the scanned angle of the optic nerve head the ppRPE/BM layer angle in each radial scan will be
images. Consequently, the acquired retinal images were approximately the same [13,14]. In addition, the ppRPE/
found tilted differently across the radial directions [6,19], BM layer was nearly a straight line in the 2D cross-sec-
which makes it difficult to determine the ppRPE/BM layer tional view. These observations implied that the 3D shape
angle of a 3D optic disc based on either a single or mul- of the ppRPE/BM layer is conical in the region of the optic
tiple radial OCT scans. Furthermore, the image tilt led to nerve head.
the measurement bias in the anatomical study such as A schematic diagram of the conical ppRPE/BM layer
thickness and angles [15,16,20–22]. The measurement bias was developed to illustrate variations in the ppRPE/BM
of retinal thickness caused by such image tilt can go up to layer angles in four imaging scenarios (Figure 2). The 3D
several dozens of microns, which accounts for >10% of ppRPE/BM layer is a portion of the conical surface inter-
its true thickness. This will also compromise the measure- secting with the cylindrical optic nerve and sharing the
ment reproducibility of the retinal thickness [23], which same axis of symmetry. The ppRPE/BM layer 3D angle
adversely affected the early diagnosis of optic diseases (denoted as γ, also referred to as 3D angle) was adopted
[24]. Therefore, it would be of great importance to compre- in this study to be consistent with the ppRPE/BM layer
hensively understand the tilt effect in the OCT scans to angle (denoted as γ′) commonly used in the 2D OCT
provide solutions to mitigate or even eliminate such effects. radial scans [6].
In this study, we will delineate why the measured As the axis of the scanning beam coincides with the
ppRPE/BM layer angle varies across the radial OCT scans axis of the optic nerve (Figure 2a), the acquired ppRPE/BM
from the perspective of its 3D morphology. We also pro-
posed a mathematical model to quantify the relationship
between the ppRPE/BM layer 3D morphology (in terms of
its 3D angle and scanning tilt angles) and its 2D cross-
sectional radial OCT scans (in terms of the ppRPE/BM
layer angles). The ppRPE/BM layer 3D angle could be
reversely determined from the measured ppRPE/BM layer
angles across radial directions. The impact of each factor
(e.g., ppRPE/BM layer 3D angle and scanning tilt angles)
on the measured ppRPE/BM layer angle in 2D OCT radial
scans was further characterized. To the best of our knowl-
Figure 1: Position control of the OCT scanning beam for the Cirrus
edge, this is the first study to unveil the ppRPE/BM HD-OCT machine (Carl Zeiss Meditec, Inc., Dublin, CA). The X–Y
layer angle variation across radial directions through panel controls the horizontal and vertical movement of the
mathematical modeling. Furthermore, the imaging data screening center (red circle). The Z panel controls the focus.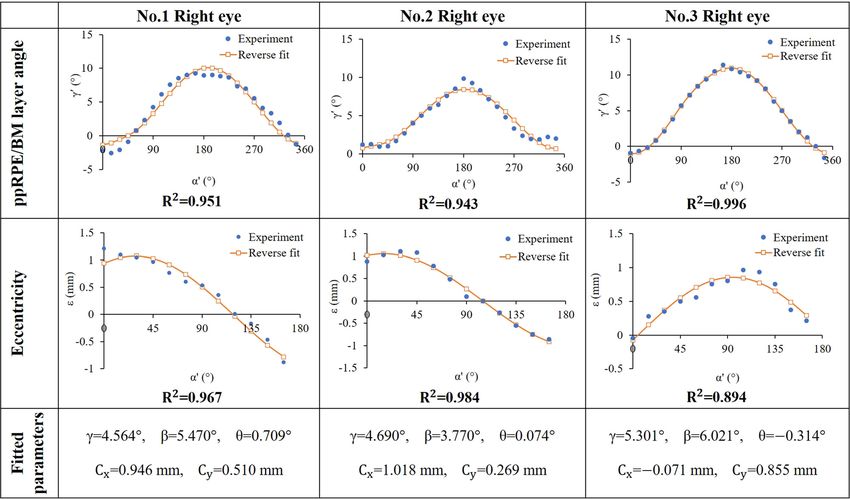
Three-dimensional shape analysis of ppRPE/BM layer 455 Figure 2: Schematic diagrams of the ppRPE/BM layer morphology with columns: relative position between the OCT scanning beam and optic disc; the OCT cross-sectional view in nasal-temporal direction; and the OCT cross-sectional view in the superior-inferior direction. The ppRPE/BM layer angle (γ′ ) refers to the angle between the ppRPE/BM layer and the horizontal plane of a 2D scan. (Row a) the axis of OCT scanning beam coincides with the axis of the optic disc; (Row b) case with a tilt angle (β) between the axis of OCT scanning beam and the axis of the optic disc in the nasal-temporal direction; (Row c): case with a tilt angle (θ) between the axis of OCT scanning beam and the axis of the optic disc in the superior-inferior direction; (Row d) the axis of OCT scanning beam is parallel with the axis of the optic disc, with the ppRPE/BM surface vertex off the axis of the scanning beam. S, I, N, and T indicate superior, inferior, nasal, and temporal, respectively. The green box marks the OCT scanning area; the blue surface represents the ppRPE/BM layer; the gray surface represents the optic nerve surface. The red dash line represents the axis of the scanning beam, and the black dash line represents the axis of the optic disc. The blue line represents the ppRPE/BM layer in the 2D view, with the blue dashed line as the extended ppRPE/BM layer. The blue dot represents the conical vertex of the ppRPE/BM surface. layer morphology would be the same across all radial the radial directions, which is equal to the ppRPE/BM directions (Figure 2a2 and a3). Thus, the measured layer 3D angle (γ). When the axis of the scanning beam ppRPE/BM layer angle (γ′) would also be the same across has a tilt angle (β) with the axis of the optic disc in the
456 Junfei Tong et al.
nasal-temporal direction (Figure 2b), the ppRPE/BM layer 2.3 Mathematical model of a conical ppRPE/
would be symmetric in the superior-inferior direction, BM layer
while it would be tilted in all other directions with the
peak tilt occurring in the nasal-temporal direction (Figure A Cartesian coordinate system was established with its
2b2 and b3). When the axis of the scanning beam has a tilt Z-axis coinciding with the axis of the OCT scanning
angle (θ) with the axis of the optic disc in the superior- beam, as shown in Figure 2a. The conical vertex of the
inferior direction (Figure 2c), the ppRPE/BM layer would ppRPE/BM surface is set to be in the global X–Y plane.
be symmetric in the nasal-temporal direction, while it The scanning tilt angle was defined as the angle
would be tilted in all other directions with the peak tilt between the axis of the scanning beam and the axis of
occurring in the superior-inferior direction (Figure 2c2 the optic disc. The conical ppRPE/BM surface, without
and c3). When the axis of the OCT scanning beam is tilt angles and vertex translation (e.g., Figure 2a1), could
parallel with the axis of the optic disc, with the ppRPE/ be described by
BM surface vertex of the axis of the scanning beam
(Figure 2d), the ppRPE/BM layer angle will still be the x = r ⁎ cos(α)
same across the radial directions. However, the intersec- y = r ⁎ sin(α) (1)
z = r ⁎ tan(γ ),
tions of the extended ppRPE/BM layer in each scan would
have an eccentric distance to the mid-line of each scan (axis where r is the distance from any point on the conical
of the scanning beam), as shown in Figure 2d2 and d3. surface to the axis of the conical surface, α is the azi-
muthal angle, and γ is the 3D angle of the ppRPE/BM
layer.
Considering a tilt angle (β) between the axis of the
2.2 Experimental data processing scanning beam and the axis of the optic disc in the nasal-
temporal direction (clockwise rotation around Y-axis)
Three right eyes and three left eyes from four patients, (Figure 2b1), the conical ppRPE/BM layer could be modi-
who underwent medically necessary lumbar puncture, fied as follows:
were analyzed in this study. The details of experimental
r ⁎ cos(α)
procedures were introduced in our previous study [6]. x cos(β) 0 sin(β)
y = 0 1 0 ⁎ r ⁎ sin(α) , (2)
Briefly, for each optic disc, 12 uniformly distributed radial
z −sin(β) 0 cos(β) r ⁎ tan(γ )
OCT scans (an angle of 15° between neighboring scans),
illustrated in Figure 3, were acquired using Cirrus HD- which could be also expressed as follows:
OCT (Carl Zeiss Meditec Inc, USA). Each OCT scan had
an anatomical size of 1,876 × 625 pixels (6 × 2 mm). x = r ⁎ [cos(α) ⁎ cos(β) + tan(γ ) ⁎ sin(β)]
Because of the discontinuity and curvature of the ppRPE/ y = r ⁎ sin(α) (3)
BM layer in the central region of the optic disc (highlighted z = r ⁎ [−cos(α) ⁎ sin(β) + tan(γ ) ⁎ cos(β)].
with a red circle in Figure 3a), we quantified the ppRPE/BM
Adding a tilt angle (θ) between the axis of the scan-
layer in the peripheral region between the radius of 1.56 mm
ning beam and the axis of the optic disc in the nasal-
(the red circle) and 3 mm (the green circle in Figure 3a).
temporal direction (clockwise rotation around X-axis)
In each OCT radial scan, the ppRPE/BM layer angle to
(Figure 2c1), the conical ppRPE/BM layer could be repre-
the horizontal plane (Figure 3b and c) was quantified using
sented as follows:
the semi-automatic method as described in our previous
study [6,26]. Here, we organized the calculated ppRPE/BM 0
x 1 0
layer angle based on their radial position from 0° to y = 0 cos(θ ) sin(θ ) ⁎
345° (denoted as α ). We calculated the eccentric dis- z 0 −sin(θ ) cos(θ )
tance (denoted as ε) of the intersection point of the (4)
r ⁎ [cos(α) ⁎ cos(β) + tan(γ ) ⁎ sin(β)]
two ppRPE/BM layers to the axis of the scanning beam r ⁎ sin(α)
in each scan (Supplement Material). The eccentricity is
r ⁎ [−cos(α) ⁎ sin(β) + tan(γ ) ⁎ cos(β)],
positive when the intersection point was closer to the
temporal side (e.g., Figure 3b). which could be also expressed as follows: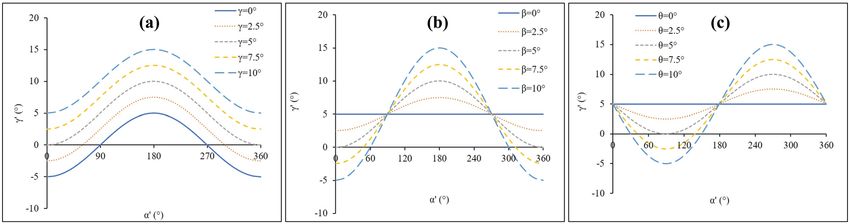
Three-dimensional shape analysis of ppRPE/BM layer 457
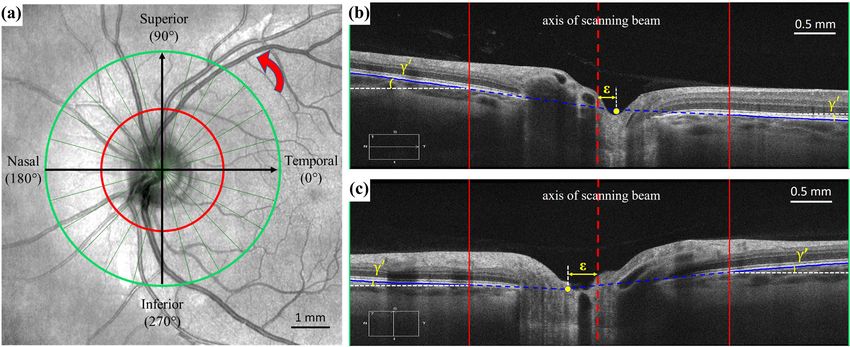
Figure 3: (a) Enface projection of the radial OCT centered over the optic disc. Twelve radial scans (green line) were acquired for each optic
disc. The insert indicates the position of the corresponding scan shown in panel b (nasal-temporal direction) and panel c (superior-inferior
direction). The red circle marks the inner boundary of the peripheral region of the optic disc for segmentation, and the green circle marks
the outer boundary of the OCT scan. The radial position of the scan was assigned counterclockwise (marked with red circle arrow) starting
from 0° at the temporal direction. (b) The ppRPE/BM layer angle (γ′ ) and the eccentric distance (ε) in OCT scan at the nasal-temporal
direction. (c) The ppRPE/BM layer angle (γ′ ) and the eccentric distance (ε) in OCT scan at the superior-inferior direction. In panels b and c,
the red line marks the inner boundary of the ppRPE/BM layer, and the green vertical boarder marks the outer boundary of the ppRPE/BM
layer. The solid blue line highlights the portion of the ppRPE/BM layer analyzed in this study, and the dashed blue line marks the extension
of the ppRPE/BM layer. The dashed red line indicates the axis of the scanning beam. The solid yellow dot is the intersection point of the two
extended lines (dashed blue line) of the ppRPE/BM layer.
x = r ⁎ [cos(α) ⁎ cos(β) + tan(γ ) ⁎ sin(β)] as radial angle, denoted as α′, ranging from 0° to 345°
y = r ⁎ sin(α) ⁎ cos(θ ) + sin(θ ) ⁎ r ⁎ with a step increase of 15°, Figure 4). To derive the rela-
[−cos(α) ⁎ sin(β) + tan(γ ) ⁎ cos(β)] (5) tionship between the ppRPE/BM layer angle (γ′) and the
z = −r ⁎ sin(α) ⁎ sin(θ ) + cos(θ ) ⁎ r ⁎ radial angle of (α′), we focused on the peripheral region of
the optic disc (the gray region in Figure 4b) to be consis-
[−cos(α) ⁎ sin(β) + tan(γ ) ⁎ cos(β)].
tent with our experimental measurements. Again, the
Adding the translation of the conical vertex (Cx , Cy ) in inner boundary radius (r0) was a constant of 1.56 mm
the X–Y plane (Figure 2d1), the conical ppRPE/BM layer and outer boundary radius (r1) was a constant of 3 mm.
could be derived as follows: The X–Y coordinates of the inner point (P0) and outer
point (P1 ) of the ppRPE/BM layer at the radial angle of
x = r ⁎ [cos(α) ⁎ cos(β) + tan(γ ) ⁎ sin(β)] + Cx
α′ can be determined from Figure 4a as follows:
y = r ⁎ sin(α) ⁎ cos(θ )
P0x(α′) = r0 ⁎ cos(α′)
+ sin(θ ) ⁎ r ⁎ [−cos(α) ⁎ sin(β) P (α′) = r ⁎ sin(α′). (7)
0y 0
+ tan(γ ) ⁎ cos(β)] + Cy (6)
P1x(α′) = r1 ⁎ cos(α′)
z = −r ⁎ sin(α) ⁎ sin(θ ) P (α′) = r ⁎ sin(α′). (8)
+ cos(θ ) ⁎ r ⁎ [− cos(α) ⁎ sin(β) 1y 1
+ tan(γ ) ⁎ cos(β)]. For (α′ , r0) in the fundus view, the corresponding
(α, r ) at the conical ppRPE/BM surface can be calculated
The common clinical data are composed of radial by substituting equation (7) to the first two equations
scans at 24 half cross-sectional angle (also referred to in equation (6), as shown in equation (9). Then, the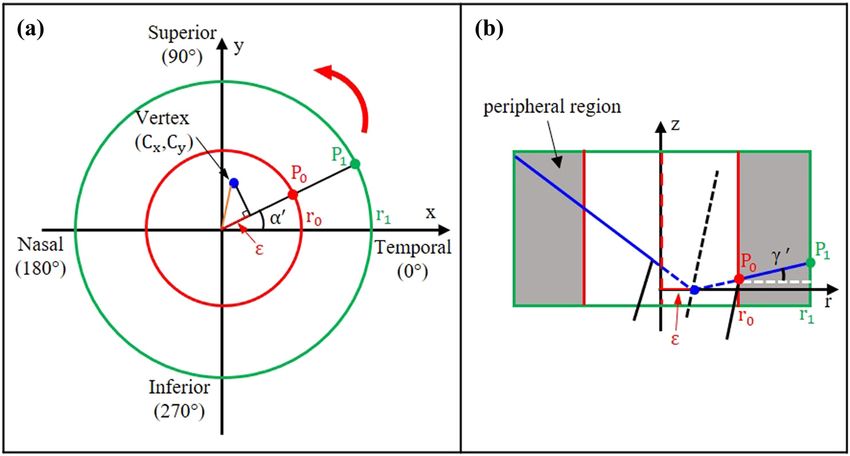
458 Junfei Tong et al.
Figure 4: The fundus view (a) and a cross-sectional view (b) of the optic disc. (a) The red circle marked the inner boundary of the ppRPE/BM
layer in the OCT scan, and the green circle marked the outer boundary. The distance of the surface vertex (Cx , Cy ) to the origin of the X–Y
coordinates (axis of scanning beam) was highlighted in orange. The eccentricity (ε) at the radial angle of α′ was highlighted in red. (b) The
cross-sectional view of the ppRPE/BM layer at a radial angle of α′ , and the peripheral region of the optic disc was highlighted in gray color.
P0 and P1 are the inner point and outer point of the ppRPE/BM layer, respectively.
Z-coordinate P0z(α′) could be calculated by substituting 2.4 The control variate method for
the solved (α, r ) to the third equation in equation (6). characterizing the ppRPE/BM layer
Similarly, for P1z(α′).
angle variation
x = r ⁎ [ cos(α) ⁎ cos(β) + tan(γ ) ⁎ sin(β)]
The measured ppRPE/BM layer angle (γ′) variation across
+ Cx = r0 ⁎ cos(α′) the radial directions was influenced by the ppRPE/BM
y = r ⁎ sin(α) ⁎ cos(θ ) (9) layer 3D angle (γ), tilt angles (β & θ), and vertex transla-
tion (Cx , Cy ), based on equations. The control variate
+ sin(θ ) ⁎ r ⁎ [− cos(α) ⁎ sin(β)
+ tan(γ ) ⁎ cos(β)] + Cy = r0 ⁎ sin(α′).
method was adopted to quantify the impact of each afore-
mentioned factor on the ppRPE/BM layer angle (γ′) [27].
Then, with Z-coordinates of P0 and P1, the ppRPE/BM Specifically, we evaluated γ′ with γ ranging from 0° to 10°
layer angle (γ′) at the radial angle of (α′) could be calcu- with a step size of 2.5°, while keeping β as 5°, θ as 0°, and
lated with equation: vertex parameters (Cx , Cy ) as (0, 0). For all other cases, we
set the control parameters: γ as 5°, β as 0°, θ as 0°, and
P (α′) − P0z(α′) 180 vertex (Cx , Cy ) as (0, 0). Then, we evaluated γ′ with either
γ′(α′) = arctan 1z ⁎ (°). (10)
r1 − r0 π β or θ ranging from 0° to 10° with a step size of 2.5°.
These equations (equations 6–10) have established The effect of vertex translation in the X–Y plane on the
γ′ variation was evaluated by varying Cx or Cy from
the relationship among the clinical measurements in
radial scans (γ′ and α′), scanning tilt angles (β and θ), −1.5 mm to 1.5 mm with a step size of 0.75 mm.
and the ppRPE/BM layer 3D angle (γ).
In addition, we can also calculate the eccentricity (ε)
based on the projection of the vertex to the fundus view 2.5 Reverse fitting for identifying the
(Figure 4a) as follows: ppRPE/BM surface and its orientation
Cy
Ε= (Cx2 + Cy2) ⁎ cos arctan − α′. (11) Given the clinical measurements of the ppRPE/BM layer
Cx angle and eccentricity, we are able to obtain individualized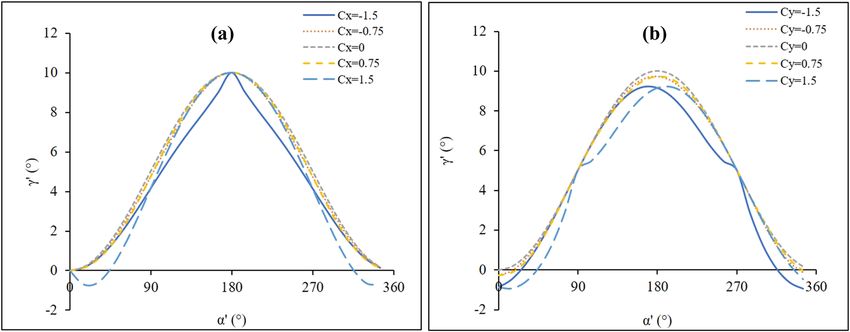
Three-dimensional shape analysis of ppRPE/BM layer 459
parameters (γ , β , θ , Cx , Cy ) for each OCT scanning data the start points number in the MultiStart procedure, a
through reverse fitting. First, we could obtain the vertex convergence study was performed considering both the
parameters (Cx , Cy ) from equation (11), which demon- accuracy and efficiency. For example, we first ran the
strated that the eccentricity was independent of other reverse fitting by using 1,000 starting points and then
parameters γ , β , θ . The vertex parameters (Cx , Cy ) were followed by another reverse fitting using 5,000 starting
calculated by the least square fitting of the 12 pairs of points. The results would be regarded as converged if
imaging data (ε, α′) using MATLAB (MathWorks, version the fitted ppRPE/BM layer parameters between the two
R2018a, USA). simulations had a difference of less than 5%. If the dif-
Then, the remaining parameters (e . g ., γ , β , θ ) could ference was greater than 5%, we would add another
be obtained by minimizing the following objective function: 5,000 starting points and rerun the fitting until the differ-
α ′= 345 ences between the consecutive simulations satisfy the
Diff(γ , β , θ ) = ∑ [γ′exp α′) – γ′mod (α′)]2 , (12) 5% criterion. Based on the converged ppRPE/BM layer
α ′= 0
parameters (γ , β , θ , Cx , Cy ), we then calculated the corre-
where the subscript exp indicates the data measured from sponding ppRPE/BM layer angle and eccentricity. The R2
OCT images and subscript mod indicates the data calcu- was then calculated to quantify the goodness of the
lated from our model – equation (10). For the ppRPE/BM reverse fitting.
layer angle (γ′), there were 24 data points corresponding
to 24 half radial scans with radial angle (α′) ranging from
0° to 345° with a step size of 15°. The unknown para-
meters are subjected to:
3 Results
0° ≤ γ ≤ 10°
3.1 The ppRPE/BM layer angle variation
0° ≤ β ≤ 10° (13)
−10° ≤ θ ≤ 10°. model
The boundary conditions of γ and β were based Based on our mathematical model, the 2D cross-sectional
on our experimental observations and the documented view of the ppRPE/BM conical surface depend on four
radial scans, which normally had a positive tilt angle factors: the ppRPE/BM layer 3D angle (γ), the tilt angle
but rarely greater than 10° [21]. The boundary conditions (β) between the axis of the OCT scanning beam and the
of θ were based on our experimental observations that axis of the optic disc in the nasal-temporal direction, the
the tilt angle difference in the superior-inferior direction tilt angle (θ) between the axis of the OCT scanning beam
was within the range of −10° and 10°. and the axis of the optic disc in the superior-inferior
The optimal solution of equation (12) was obtained direction, and the location of the ppRPE/BM layer vertex
using the fmincon function of the MultiStart procedure in to the axis of the scanning beam (Cx , Cy ).
MATLAB [28]. To accelerate the computing speed, a par- Figure 5 shows the role of the ppRPE/BM layer
allel computing toolbox using multiple cores (n = 8) was 3D angle γ and tilt angles (β and θ) on the measured
applied. To ensure the fitted results were independent of ppRPE/BM layer angle γ′ in various radial scans. The
Figure 5: The ppRPE/BM layer angle γ′ variation across the radial directions was influenced by (a) the ppRPE/BM layer 3D angle γ (constant
β = 5°), (b) the tilt angle β (constant γ = 5°), and (c) the tilt angle θ (constant γ = 5°). The remaining parameters are zero.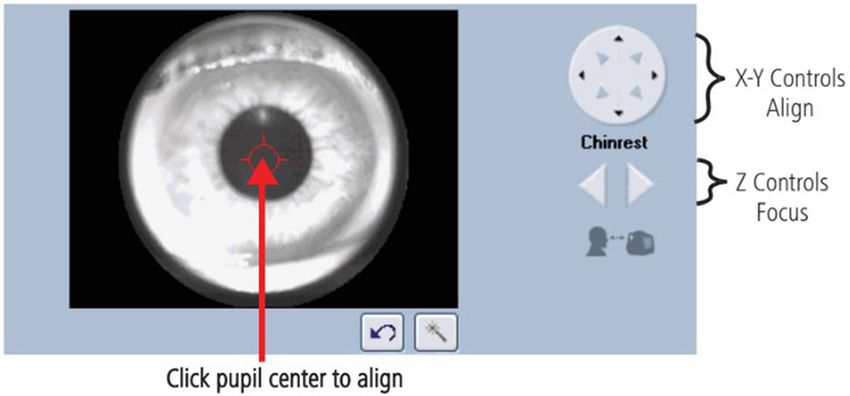
460 Junfei Tong et al.
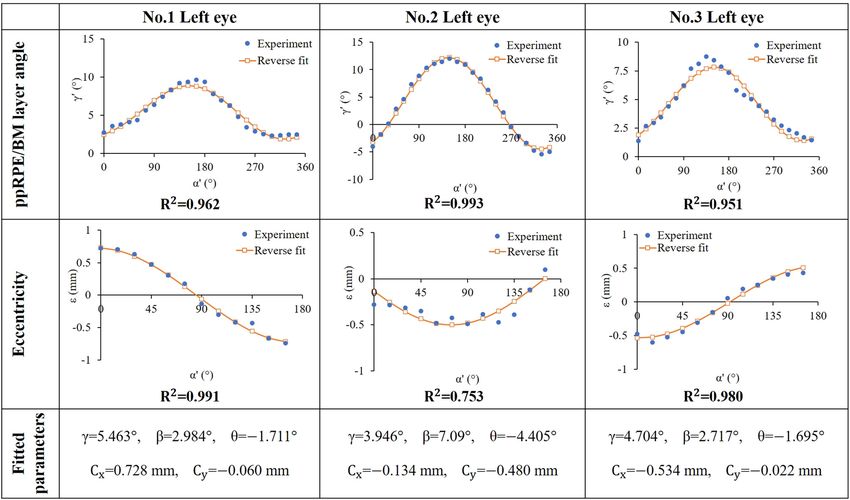
ppRPE/BM layer angle γ′ variation curve across radial BM morphology (γ , β , θ , Cx , Cy ) based on our mathematical
directions exhibited the same amplitude regardless of model. First, we use the method of least square to find the
the magnitude of the ppRPE/BM layer 3D angle γ. How- best fit for 12 measured eccentricity along 12 radial direc-
ever, a larger γ induced an upward shift of the γ′ variation tions, which was used to determine the vertex parameters
curve as shown in Figure 5a. It is clear, in Figure 5b and c, (Cx , Cy ) in equation (11), which showed that the eccentri-
that γ′ across the radial directions exhibited the shape of city is independent of the other parameters (γ , β , θ ). Then,
the cosine-like curve with a nonzero β and the shape of we are able to find the best fit for 24 measured γ′ along
sine-like curve with a nonzero θ. The amplitude of the 24 half radial directions, which was used to obtain para-
cosine-like and sine-like curves increased with a larger meters (γ , β , θ ) from equation (10) through reverse fitting.
tilt angle. As both tilt angles (β and θ) equal to zero, the The aforementioned two reverse fitting and the resulted
measured ppRPE/BM layer angles γ′ across all radial ppRPE/BM morphology parameters (γ , β , θ , Cx , Cy ) are
directions are equal to the ppRPE/BM layer 3D angle γ, shown in Figure 7 for the right eyes (n = 3) and Figure 8
shown as a straight line across all radial directions. It is for the left eyes (n = 3), respectively. It is clear that the
worth noting that β induced the valley/peak ppRPE/BM calculated ppRPE/BM layer angle γ ranged from 3.9° to
layer angle γ′ in the nasal-temporal direction (e.g., 0° and 5.5°, tilt angle β was from 2.7° to 6.0°, and θ was from
180°), while θ induced the valley/peak ones in the superior- −4.4° to 0.7°. It was observed that the variations of the
inferior direction (e.g., 90° and 270°). ppRPE/BM layer angle across the radial directions were
Figure 6 has illustrated the role of the ppRPE/BM much like cosine curve. This is expected as the optic
surface vertex translation (Cx , Cy ) on the measured ppRPE/ nerve head is naturally located at the nasal side of the
BM layer angle γ′. When the vertex was in the central region eyeball (e.g., tilt in nasal-temporal direction).
of the optic disc within a radius of 0.75 mm of the scanning The goodness of fit of our model to the measured data
center, the vertex translation has a minimal impact on the points was quantified by the coefficient of determination
ppRPE/BM layer angle variation. When the vertex was (R2). Values of R2 are larger than 0.9 in most model pre-
closed to the boundary of the optic disc (e.g., ±1.5 mm), dictions, indicating the effectiveness of the mathematical
the variation of the ppRPE/BM layer angle was slightly model developed in this study, which further illustrated
enlarged. the relationship between the ppRPE/BM 3D morphology
and its 2D cross-sectional radial scans (commonly used in
clinical practices).
3.2 Reverse fitting for determining the The convergence study using the MultiStart procedure
ppRPE/BM layer 3D parameters is illustrated in Table 1. It is clear that the ppRPE/BM layer
parameters were converged with a larger number of the
For each eye, we could measure eccentricity, γ′ and α′ at all start points (N), but in the cost of a longer computa-
radial scans, which was used for estimating the 3D ppRPE/ tion time.
Figure 6: The influence of (a) the vertex translation of the ppRPE/BM surface in X-axis (Cx ) and (b) the vertex translation of the ppRPE/BM
surface in Y-axis (Cy ) on the ppRPE/BM layer angle γ′ variation across the radial directions, with γ = 5°, β = 0°, and θ = 0°.Three-dimensional shape analysis of ppRPE/BM layer 461 Figure 7: Comparison between the experimental measurements and model fitting results of with respect to γ′ (first row) and ε (second row) of three right eyes. The fitted parameters were listed in the third row. Figure 8: Comparison between the experimental measurements and model fitting results with respect to γ′ (first row) and ε (second row) of three left eyes. The fitted parameters were shown in the third row.
462 Junfei Tong et al.
Table 1: Convergence of the fitted ppRPE/BM layer parameters using MultiStart procedure (representative data: No. 1 right eye)
Number of start points (N) Fitted ppRPE/BM layer parameters Computing time (s)
γ β θ
Value (°) Change (%) Value (°) Change (%) Value (°) Change (%)
1,000 4.439 5.506 0.499 839
5,000 4.597 3.56 5.510 0.07 0.618 23.85 3385
10,000 4.549 −1.04 5.512 0.04 0.684 10.68 6607
15,000 4.564 0.33 5.470 −0.76 0.709 3.65 9627
4 Discussion portion of the pupil [13]. Thus, the measured ppRPE/BM
layer angle variations along the different radial directions
In this study, a mathematical model has been developed exhibited as cosine-like curve, as illustrated in our OCT
to delineate the relationship between the ppRPE/BM image postprocessing (Figures 7 and 8). Our model revealed
layer 3D morphology and its 2D cross-sections in various that ppRPE/BM layer angle variations were highly depen-
radial directions. It has been found out that the measured dent on the ppRPE/BM layer 3D angle (Figure 5a) and the
ppRPE/BM layer angle variation across the radial direc- tilt angle between the axis of the OCT scanning beam and
tions depends on the ppRPE/BM layer 3D angle and the the axis of the optic disc (Figure 5b and c). Specifically, the
scanning tilt angles, which could be calculated by reverse midline of the angle variation curve depends on the ppRPE/
fitting the measured 2D data points in the radial OCT BM layer 3D angle, and the amplitude of the angle variation
scans. This study provided a mechanistic understanding curve depends on the tilt angles. Conversely, the position of
of the ppRPE/BM layer 3D morphology, which could be the ppRPE/BM surface vertex has a minimal impact on the
further exploited for the diagnosis and prevention of the measured ppRPE/BM layer angle when the vertex is within
ocular and neurological diseases [29,30]. Moreover, the the central region of the optic disc. The good match between
computational framework could be applied to other bio- the fitted curve and the clinical measurements from OCT
medical studies that integrate different 2D observations image (R2 > 0.9 in most cases) supported the aforementioned
into 3D representation [31–33]. understandings and especially indicated the capability of
The impact of the ppRPE/BM layer 3D angle and the mathematical model in relating the variation of the
scanning tilt angles on the measured ppRPE/BM layer ppRPE/BM layer angle along different radial directions
angle in radial scans was evaluated using the control with its 3D parameters.
variate method. The tilt angle (β) between the axis of the The measured ppRPE/BM layer angle in radial scans
OCT scanning beam and the axis of the optic disc in the was further reverse fitted into its 3D morphology in terms
nasal-temporal direction could be adjusted by moving of the ppRPE/BM layer 3D angle. The quantified ppRPE/
the scanning beam horizontally (X-axis in Figure 1). The BM layer 3D angle was a comprehensive description of
tilt angle (θ) between the axis of the OCT scanning beam the peripapillary geometry, compared to the single mea-
and the axis of the optic disc in the superior-inferior direc- surement from a 2D cross-sectional scan [13,14]. The
tion could be adjusted by moving the scanning beam ver- ppRPE/BM layer 3D angle could be considered as a new
tically (Y-axis in Figure 1). The relative position between biomarker for evaluating the severity of the disease (e.g.,
the vertex of the ppRPE/BM layer and the axis of the scan- papilledema or idiopathic hypertension) and the effect of
ning beam could be adjusted by moving the scanning treatment [13,34]. Besides, it can avoid the tilt artifact
center either horizontally or vertically. If the axis of the that was born with the shape analysis of 2D scans [13].
OCT scanning beam aligned with the axis of the optic disc, Generally, the OCT scanning beam was required to be
e.g., no tilting, the measured ppRPE/BM layer angle will be perpendicularly oriented over the optic nerve so as to
the same across all radial directions (Figure 5b and c). obtain the symmetrical and untilted 2D scans. There is
However, the optic nerve head is naturally located at the no need to do so by using the model developed in this
nasal side of the eyeball (e.g., tilt in nasal-temporal direc- study, as the reverse fitting will determine the ppRPE/BM
tion), which led to common image tilting during OCT layer 3D morphology parameters. In addition, the quan-
scanning. To enforce a nontilt ppRPE/BM layer, the OCT tified ppRPE/BM layer 3D angle could also be used for the
scanning beam should be positioned towards the temporal noninvasive ICP estimation since the ppRPE/BM layerThree-dimensional shape analysis of ppRPE/BM layer 463
angle in 2D radial scans was found to change in response be transformed across many different biomedical studies
to the ICP level [13,14,19]. Moreover, such biomarker that will require the integration of multifaceted observa-
shows a promising prospect for accurate noninvasive tions in its broadest sense [44].
ICP assessment as our previous study has shown that
the minimum detectable change of the ppRPE/BM layer Funding information: The authors state no funding
angle can be as low as 0.19° [6]. This could be particularly involved.
important when invasive ICP monitoring is not applicable
due to ethical or safety concerns or difficulty in mani- Author contributions: All authors have accepted respon-
pulating the test, such as for patients with normal-tension sibility for the entire content of this manuscript and
glaucoma [35] or acute mountain sickness [36–38], or for approved its submission.
astronauts in the spaceflight [12,39].
We could automatically adjust the retinal OCT radial Conflict of interest: The authors state no conflict of
scans to eliminate the tilting effect based on the mathe- interest.
matical model developed in this study. It could then
increase the accuracy and reproducibility of the retinal
nerve fiber layer (RNFL) thickness in the optic nerve head
or macula [15,16,20–23]. Hong et al. reported that dif- References
ferent scan angles could induce significant artifact (e.g.,
mean difference 13.26 ± 14.95 µm) in the measurement of [1] Fujimoto J, Swanson E. The development, commercialization,
and impact of optical coherence tomography. Investig
RNFL thickness where the adjustment is necessary [16].
Ophthalmol Vis Sci. 2016;57(9):OCT1–13.
Lee et al. observed that the RNFL thickness measured in
[2] Baghaie A, Yu Z, D’Souza RM. State-of-the-art in retinal optical
radial scans with the adjusted ppRPE/BM layer angle coherence tomography image analysis. Quant Imaging Med
showed better reproducibility [23]. Furthermore, it was Surg. 2015;5(4):603–17.
observed that the peripapillary RNFL thickness was sig- [3] Dong ZM, Wollstein G, Schuman JS. Clinical utility of optical
nificantly associated with the tilt degree of the optic disc, coherence tomography in glaucoma. Investig Ophthalmol Vis
Sci. 2016;57(9):OCT556–67.
and a larger temporally tilted optic disc led to a thicker
[4] Kansal V, Armstrong JJ, Pintwala R, Hutnik C. Optical coherence
temporal RNFL [22,40]. Considering the association between tomography for glaucoma diagnosis: an evidence based meta-
myopia and optic disc tilt [41,42], the developed model analysis. PLoS One. 2018;13(1):e0190621.
might be transformed to the myopic population [40,43]. [5] Lee CS, Tyring AJ, Deruyter NP, Wu Y, Rokem A, Lee AY. Deep-
In this study, the ppRPE/BM layer 3D morphology learning based, automated segmentation of macular edema in
optical coherence tomography. Biomed Opt Express.
was assumed as a perfect conical shape for developing
2017;8(7):3440–8.
the mathematical model that derives the ppRPE/BM layer
[6] Tong J, Dong P, Kedar S, Ghate D, Gu L. Three-dimensional
angle in 2D radial scans under different imaging scenarios. characterization of peripapillary retinal pigment epithelium-
Such an assumption was made to understand the associa- basement membrane layer in patients following lumbar
tion between 3D morphology and 2D radial scans. The puncture. Appl Sci. 2020;10(5):1559.
application of this study is limited to the straight ppRPE/ [7] Zhang X, Medow JE, Iskandar BJ, Wang F, Shokoueinejad M,
Koueik J, et al. Invasive and noninvasive means of measuring
BM layer. The patients with curved ppRPE/BM layers (two
intracranial pressure: a review. Physiol Meas.
out of 36 eyes) in our previous lumbar puncture study [6] 2017;38(8):R143.
will not be included. [8] Hua Y, Tong J, Ghate D, Kedar S, Gu L. Intracranial pressure
In conclusion, the developed mathematical model influences the behavior of the optic nerve head. J Biomech Eng.
in this study delineated how the ppRPE/BM layer angle 2017;139:3.
[9] Cardim D, Robba C, Donnelly J, Bohdanowicz M, Schmidt B,
across radial scans are related to the ppRPE/BM 3D
Damian M, et al. Prospective study on noninvasive assessment
parameters during the scanning process. The variations
of intracranial pressure in traumatic brain-injured patients:
of the ppRPE/BM layer angle in different radial scans comparison of four methods. J Neurotrauma.
depend on the 3D angle and tilt angles. The ppRPE/BM 2016;33(8):792–802.
layer 3D angle could be reversely fitted using the mea- [10] Ghate D, Kedar S, Havens S, Fan S, Thorell W, Nelson C, et al.
sured ppRPE/BM layer angles across radial directions. The effects of acute intracranial pressure changes on
the episcleral venous pressure, retinal vein diameter and
The ppRPE/BM layer 3D angle, first proposed herein,
intraocular pressure in a pig model. Curr Eye Res.
could be used to enhance the understanding of 2D radial 2020;46:1–8.
scans and to exploit its potential as biomarkers of ocular [11] Marshall-Bowman K, Barratt MR, Gibson CR. Ophthalmic
diseases. In addition, the framework of this study could changes and increased intracranial pressure associated with464 Junfei Tong et al.
long duration spaceflight: an emerging understanding. [27] Kucherenko S, Delpuech B, Iooss B, Tarantola S. Application of
Acta Astron. 2013;87:77–87. the control variate technique to estimation of total sensitivity
[12] Zhang L-F, Hargens AR. Spaceflight-induced intracranial indices. Reliab Eng Syst Saf. 2015;134:251–9.
hypertension and visual impairment: pathophysiology and [28] Moles CG, Mendes P, Banga JR. Parameter estimation in bio-
countermeasures. Physiol Rev. 2018;98(1):59–87. chemical pathways: a comparison of global optimization
[13] Sibony P, Kupersmith MJ, Rohlf FJ. Shape analysis of the peri- methods. Genome Res. 2003;13(11):2467–74.
papillary RPE layer in papilledema and ischemic optic neuro- [29] Tong J, Kedar S, Ghate D, Gu L. Indirect traumatic optic neu-
pathy. Investig Ophthalmol Vis Sci. 2011;52(11):7987–95. ropathy induced by primary blast: a fluid–structure interaction
[14] Gampa A, Vangipuram G, Shirazi Z, Moss HE. Quantitative study. J Biomech Eng. 2019;141(10):101011.
association between peripapillary Bruch’s membrane shape [30] Tong J, Ghate D, Kedar S, Gu L. Relative contributions of
and intracranial pressure. Investig Ophthalmol Vis Sci. intracranial pressure and intraocular pressure on lamina cri-
2017;58(5):2739–45. brosa behavior. J Ophthalmol. 2019;2019(3064949):3064949.
[15] Hariri A, Lee SY, Ruiz-Garcia H, Nittala MG, Heussen FM, [31] Mozafari H, Zhou C, Gu L. Mechanical contribution of vascular
Sadda SR. Effect of angle of incidence on macular thickness smooth muscle cells in the tunica media of artery.
and volume measurements obtained by spectral-domain Nanotechnol Rev. 2019;8(1):50–60.
optical coherence tomography. Investig Ophthalmol Vis Sci. [32] Lin S, Dong P, Zhou C, Dallan LAP, Zimin VN, Pereira G, et al.
2012;53(9):5287–91. Degradation modeling of poly-l-lactide acid (PLLA) bioresorb-
[16] Hong S, Kim CY, Seong GJ. Adjusted peripapillary retinal nerve able vascular scaffold within a coronary artery. Nanotechnol
fiber layer thickness measurements based on the optic nerve head Rev. 2020;9(1):1217–26.
scan angle. Investig Ophthalmol Vis Sci. 2010;51(8):4067–74. [33] Xing F, Zhou C, Hui D, Du C, Wu L, Wang L, et al. Hyaluronic acid
[17] Fan YY, Jonas JB, Wang YX, Chen CX, Wei WB. Horizontal and as a bioactive component for bone tissue regeneration: fabri-
vertical optic disc rotation. The Beijing eye study. PLoS One. cation, modification, properties, and biological functions.
2017;12(5):e0175749. Nanotechnol Rev. 2020;9(1):1059–79.
[18] Kraus MF, Liu JJ, Schottenhamml J, Chen C-L, Budai A, [34] Sibony P, Kupersmith MJ, Honkanen R, Rohlf FJ, Torab-
Branchini L, et al. Quantitative 3D-OCT motion correction with Parhiz A. Effects of lowering cerebrospinal fluid pressure on
tilt and illumination correction, robust similarity measure and the shape of the peripapillary retina in intracranial hyperten-
regularization. Biomed Opt Express. 2014;5(8):2591–613. sion. Investig Ophthalmol Vis Sci. 2014;55(12):8223–31.
[19] Malhotra K, Patel MD, Shirazi Z, Moss HE. Association between [35] Baneke AJ, Aubry J, Viswanathan AC, Plant GT. The role of
peripapillary bruch’s membrane shape and intracranial pres- intracranial pressure in glaucoma and therapeutic implica-
sure: effect of image acquisition pattern and image analysis tions. Eye. 2020;34(1):178–91.
method, a preliminary study. Front Neurol. 2018;9:1137. [36] Keyes LE, Paterson R, Boatright D, Browne V, Leadbetter G,
[20] Alonso-Caneiro D, Read SA, Vincent SJ, Collins MJ, Hackett P. Optic nerve sheath diameter and acute mountain
Wojtkowski M. Tissue thickness calculation in ocular optical sickness. Wilderness Environ Med. 2013;24(2):105–11.
coherence tomography. Biomed Opt Express. [37] DiPasquale DM, Muza SR, Gunn AM, Li Z, Zhang Q, Harris NS,
2016;7(2):629–45. et al. Evidence for cerebral edema, cerebral perfusion, and
[21] Antony BJ, Stetson PF, Abramoff MD, Lee K, Colijn JM, intracranial pressure elevations in acute mountain sickness.
Buitendijk GH, et al. Characterizing the impact of off-axis scan Brain Behav. 2016;6(3):e00437.
acquisition on the reproducibility of total retinal thickness [38] Tian X, Zhang B, Jia Y, Wang C, Li Q. Retinal changes following
measurements in SDOCT volumes. Transl Vis Sci Technol. rapid ascent to a high-altitude environment. Eye.
2015;4(4):3. 2018;32(2):370–4.
[22] Uji A, Abdelfattah NS, Boyer DS, Balasubramanian S, Lei J, [39] Vijay V, Mollan SP, Mitchell JL, Bilton E, Alimajstorovic Z,
Sadda SR. Variability of retinal thickness measurements in Markey KA, et al. Using optical coherence tomography as a surro-
tilted or stretched optical coherence tomography images. gate of measurements of intracranial pressure in idiopathic intra-
Transl Vis Sci Technol. 2017;6(2):1. cranial hypertension. JAMA Ophthalmol. 2020;138(12):1264–71.
[23] Lee K, Sonka M, Kwon YH, Garvin MK, Abramoff MD. [40] Hwang YH, Yoo C, Kim YY. Myopic optic disc tilt and the char-
Adjustment of the retinal angle in SD-OCT of glaucomatous acteristics of peripapillary retinal nerve fiber layer thickness
eyes provides better intervisit reproducibility of peripapillary measured by spectral-domain optical coherence tomography.
RNFL thickness. Investig Ophthalmol Vis Sci. J Glaucoma. 2012;21(4):260–5.
2013;54(7):4808–12. [41] How AC, Tan GS, Chan Y-H, Wong TT, Seah SK, Foster PJ, et al.
[24] Medeiros FA, Zangwill LM, Bowd C, Vessani RM, Susanna Jr R, Population prevalence of tilted and torted optic discs among
Weinreb RN. Evaluation of retinal nerve fiber layer, optic nerve an adult Chinese population in Singapore: the Tanjong pagar
head, and macular thickness measurements for glaucoma study. Arch Ophthalmol. 2009;127(7):894–9.
detection using optical coherence tomography. Am J [42] You Q, Xu L, Jonas J. Tilted optic discs: the Beijing eye study.
Ophthalmol. 2005;139(1):44–55. Eye. 2008;22(5):728–9.
[25] Meditec CZ. Cirrus HD-OCT user manual. Dublin, CA, USA: Carl [43] Shin H-Y, Park H-YL, Park CK. The effect of myopic optic disc tilt
Zeiss Meditec; 2016. on measurement of spectral-domain optical coherence tomo-
[26] Mayer MA, Hornegger J, Mardin CY, Tornow RP. Retinal nerve graphy parameters. Br J Ophthalmol. 2015;99(1):69–74.
fiber layer segmentation on FD-OCT scans of normal subjects [44] Mozafari H, Wang L, Lei Y, Gu L. Multi-scale modeling of the
and glaucoma patients. Biomed Opt Express. lamellar unit of arterial media. Nanotechnol Rev.
2010;1(5):1358–83. 2019;8(1):539–47.You can also read