F-LOAM : FAST LIDAR ODOMETRY AND MAPPING
←
→
Page content transcription
If your browser does not render page correctly, please read the page content below
F-LOAM : Fast LiDAR Odometry and Mapping
                                                                 Han Wang, Chen Wang, Chun-Lin Chen, and Lihua Xie, Fellow, IEEE

                                           Abstract— Simultaneous Localization and Mapping (SLAM)
                                        has wide robotic applications such as autonomous driving                                                     (a)                     (b)
                                        and unmanned aerial vehicles. Both computational efficiency
                                        and localization accuracy are of great importance towards a
                                        good SLAM system. Existing works on LiDAR based SLAM
                                        often formulate the problem as two modules: scan-to-scan
                                        match and scan-to-map refinement. Both modules are solved
                                        by iterative calculation which are computationally expensive. In
                                                                                                                                                                              (c)
arXiv:2107.00822v1 [cs.RO] 2 Jul 2021

                                        this paper, we propose a general solution that aims to provide
                                        a computationally efficient and accurate framework for LiDAR
                                        based SLAM. Specifically, we adopt a non-iterative two-stage
                                        distortion compensation method to reduce the computational
                                        cost. For each scan input, the edge and planar features are
                                        extracted and matched to a local edge map and a local plane
                                        map separately, where the local smoothness is also considered
                                        for iterative pose optimization. Thorough experiments are
                                        performed to evaluate its performance in challenging scenarios,            Fig. 1: Example of the proposed method on KITTI dataset.
                                        including localization for a warehouse Automated Guided                    (a) shows the mapping result on sequence 05. (b) is the
                                        Vehicle (AGV) and a public dataset on autonomous driving. The              reconstructed 3D road scenery by integrating camera view.
                                        proposed method achieves a competitive localization accuracy               (c) plots the trajectory from F-LOAM and the ground truth.
                                        with a processing rate of more than 10 Hz in the public
                                        dataset evaluation, which provides a good trade-off between
                                        performance and computational cost for practical applications.
                                        It is one of the most accurate and fastest open-sourced SLAM
                                        systems1 in KITTI dataset ranking.                                         to dynamic environments. For example, [5] showed good
                                                                                                                   performance in indoor scenario, but the localization accuracy
                                                              I. INTRODUCTION                                      drops a lot in outdoor environment. Another challenge is
                                           Simultaneous Localization and Mapping (SLAM) is one                     the computational cost. In many robotic platforms such
                                        of the most fundamental research topics in robotics. It is the             as UAVs, the computational resources are limited, where
                                        task to localize the robot and build the surrounding map in                the on-board processing unit is supposed to perform high
                                        an unknown or partially unknown environment based on on-                   frequency localization and path planning at the same time
                                        board sensors. According to the perceptual devices, it can be              [6]. Moreover, many works are not open-sourced thus it is
                                        roughly categorized as LiDAR and Visual SLAM. Compared                     difficult to retrieve the same result.
                                        to visual SLAM, LiDAR SLAM is often more accurate in                          The most classical approach to estimate the transform
                                        pose estimation and is robust to environmental variations                  between two scans is Iterative Closest Point (ICP) [7],
                                        such as illumination and weather change [1]. Therefore, Li-                where the two scans are aligned iteratively by minimizing
                                        DAR SLAM is widely adopted by many robotic applications                    point cloud distance. However, a large number of points
                                        such as autonomous driving [2], drone inspection [3], and                  are involved in optimization, which is computationally in-
                                        warehouse manipulation [4].                                                efficient. Another approach is to match features that is
                                           Although existing works on LiDAR SLAM have achieved                     more computationally efficient. A typical example is Lidar
                                        good performance in public dataset evaluation, there are                   Odometry And Mapping (LOAM) [8] that extracts edge and
                                        still some limitations in practical applications. One of the               planar features and calculates the pose by minimizing point-
                                        limitations is the robustness over different environments,                 to-plane and point-to-edge distance. However, both distortion
                                        e.g., from indoor to outdoor environments and from static                  compensation and laser odometry require iterative calculation
                                                                                                                   which are still computationally expensive.
                                          The work is supported by Delta-NTU Corporate Laboratory for Cyber-
                                        Physical Systems under the National Research Foundation Corporate Lab         In this paper, we introduce a lightweight LiDAR SLAM
                                        @ University Scheme. The demonstration video can be found at https:        that targets to provide a practical real-time LiDAR SLAM
                                        //youtu.be/QvXN5XhAYYw.                                                    solution to public. A novel framework is presented that com-
                                          Han Wang, Chun-Lin Chen, and Lihua Xie are with the School
                                        of Electrical and Electronic Engineering, Nanyang Technological            bines feature extraction, distortion compensation, pose opti-
                                        University, 50 Nanyang Avenue, Singapore 639798. e-mail:                   mization, and mapping. Compared to traditional method, we
                                        {wang.han,ChenCL,elhxie}@ntu.edu.sg                                        use a non-iterative two-stage distortion compensation method
                                           Chen Wang is with the Robotics Institute, Carnegie Mellon University,
                                        Pittsburgh, PA 15213, USA. e-mail: chenwang@dr.com                         to replace the computationally inefficient iterative distortion
                                           1 https://github.com/wh200720041/floam                                  compensation method. It is observed that edge features with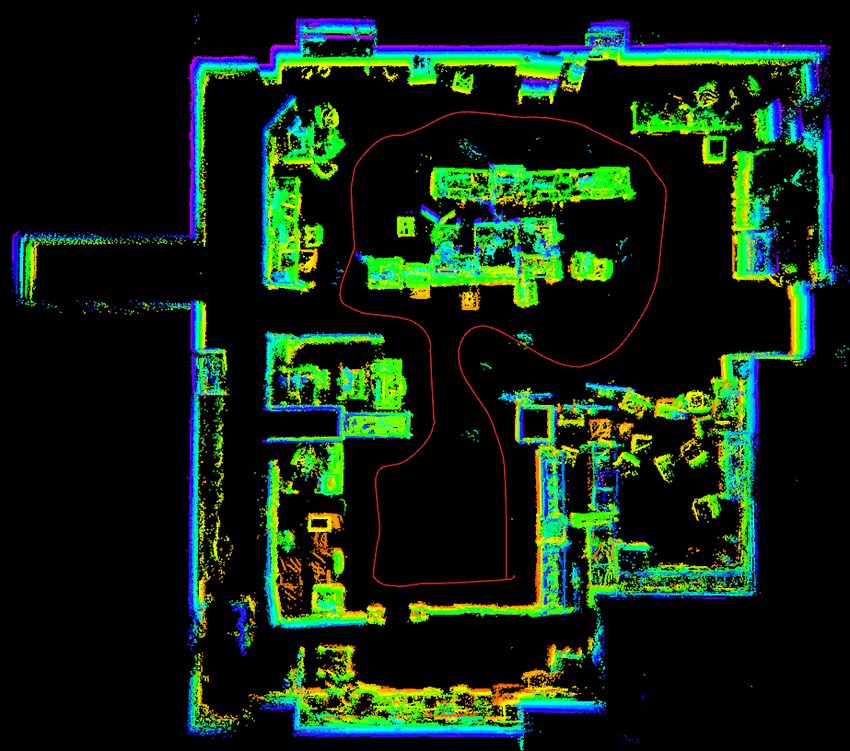
higher local smoothness and planar features with lower            component in SLAM. The LiDAR odometry often comes
smoothness are often consistently extracted over consecutive      with inevitable drifts which can be significant in long-term
scans. Those points are more important for matching. Hence        SLAM. Hence in some large scale scenarios, the loop closure
the local geometry feature is also considered for the iterative   serves in the back-end to identify repetitive places. For
pose estimation to improve the localization accuracy. It is       example, in LiDAR-only Odometry and Localization (LOL)
able to achieve real time performance up to 20 Hz on a            the author extends LiDAR odometry into a full SLAM with
low power embedded computing unit. To demonstrate the             loop closure [12]. By closing the loop, odometry drifting
robustness, a thorough evaluation of the proposed method is       error can be corrected. Fusion with Inertial Measurement
presented, including both indoor and outdoor experiments.         Unit (IMU) is an alternative solution. Shan et al propose
Compared to existing state-of-the-art methods, our method         a fusion method with IMU and GPS named LIO-SLAM
is able to achieve competitive localization accuracy at a         [13]. Different sensor inputs are synchronized and tightly-
low computational cost, which is a good trade-off between         coupled. The fused SLAM system is proven to be more
performance and speed. It is worthy noting that the proposed      accurate than LOAM in outdoor environment. Fusion-based
method is one of the most accurate and fastest open-sourced       approaches have shown improvement on the localization
methods in the KITTI benchmark.                                   accuracy. However, multi-sensor fusion requires synchroniza-
   This paper is organized as follows: Section II reviews         tion and comprehensive calibration.
the related work on existing LiDAR SLAM approaches.                  In the past few years there are also some deep learning
Section III describes the details of the proposed approach,       related works that attempt to use Convolution Neural Net-
including feature point selection, laser points alignment,        work (CNN) for point cloud processing. Rather than hand-
laser odometry estimation, and mapping. Section IV shows          crafted features, features are extracted by CNN training.
experiment results, followed by conclusion in Section V.          For example, in CAE-LO [14], the author proposes a deep-
                                                                  learning-based feature point selection rules via unsupervised
                  II. RELATED WORK                                Convolutional Auto-Encoder (CAE) [15], while the LiDAR
   The most essential step in LiDAR SLAM is the matching          odometry estimation is still based on feature points matching.
of point clouds. Existing works mainly leverage on finding        The experiment result shows that the learnt features can
the correspondence between point cloud, including two main        improve the matching success rate. Although deep learn-
categories: raw point cloud matching and feature point pairs      ing approaches have shown good performance in public
matching. For raw point cloud matching, the Iterative Closest     dataset, it is not robust in different environment such as
Points (ICP) [7] method is the most classic method. ICP           indoor/outdoor and city/rural scenarios. For example, [16]
measures the correspondent points by finding the closest          has a good performance in semantic KITTI dataset. However,
point in Euclidean space. By iteratively minimizing the           the same algorithm fails when moving to indoor environment
distance residual between corresponding points, the pose          or in some complex environment.
transition between two point clouds converges to the final
location. An improved point cloud matching is IMLS-SLAM                             III. METHODOLOGY
[9], where a weight value is assigned to each point. Each            In this section, the proposed method is described in
weight is derived by IMplicit Least Square (IMLS) method          details. We firstly present the sensor model and feature
based on the local surface normal of target point. However,       extraction. The extracted features are then calibrated with
it is often computationally costly to apply raw point cloud       distortion compensation. Then, we present general feature
matching, e.g., it takes 1.2 s to estimate one frame in IMLS-     extraction and global feature estimation. Lastly we explain
SLAM that is far from real-time performance requirement.          the calculation of laser odometry as well as mapping.
   The feature-based methods mainly leverage on point-to-
surface/edge matching and are popularly used. Introduced by       A. Sensor Model and Feature Extraction
LOAM [10], this has become the standard for the following            A mechanical 3D LiDAR perceives the surrounding envi-
work. The edges and surfaces are extracted in advance based       ronment by rotating a vertically aligned laser beam array
on local smoothness analysis, and the points from the current     of size M . It scans vertical planes with M readings in
point cloud are matched to the edges and surfaces from the        parallel. The laser array is rotating in a horizontal plane
map. The distance cost is formulated as the euclidean dis-        at constant speed during each scan interval, while the laser
tance between the points and edges and surfaces. There are        measurements are taken in clockwise or counterclockwise
also many works that extends LOAM to achieve better per-          order sequentially [17]. For a mechanical LiDAR sensor
formance, e.g., LeGO-LOAM separates ground optimization           model, we denote the k th LiDAR scan as Pk , and each point
                                                                       (m,n)
before feature extraction. For Autonomous Guided Vehicles         as pk      , where m ∈ [1, M ] and n ∈ [1, N ]. Raw point
(AGVs) [11], the z-axis is not important and most of case we      cloud matching methods such as ICP are sensitive to noise
can assume robot moving in 2D space. Hence, ground points         and dynamic objects such as human for autonomous driving.
are not contributing to the localization of x-y plane. This       Moreover, a LiDAR scan contains tens of thousands of points
approach is also widely implemented in ground vehicles.           which makes ICP computationally inefficient. Compared
   Some works attempt to improve the performance by intro-        to raw point cloud matching method such as ICP, feature
ducing extra modules. Loop closure detection is another key       point matching is more robust and efficient in practice. To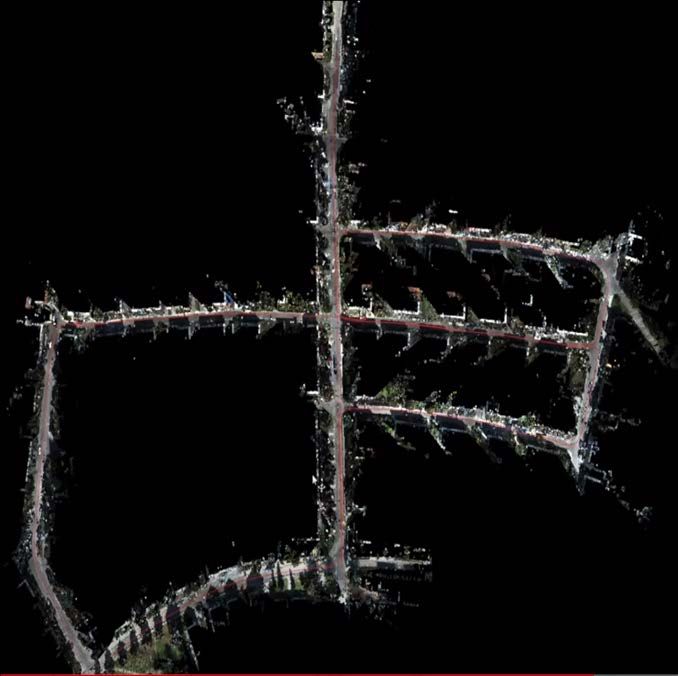
improve the matching accuracy and matching efficiency, we             can be corrected by:
leverage surface features and edge features, while discard
                                                                                                    (m,n)      (m,n)
those noisy or less significant points. As mentioned above,                      P̃k = {Tk (δt) pk          | pk       ∈ Pk }.    (4)
the point cloud returned by a 3D mechanical LiDAR is
sparse in vertical direction and dense in horizontal direction.       The undistorted features will be used to find the robot pose
Therefore, horizontal features are more distinctive and it            in the next section.
is less likely to have false feature detection in horizontal
plane. For each point cloud, we focus on horizontal plane             C. Pose Estimation
and evaluate the smoothness of local surface by
                                                                         The pose estimation aligns the current undistorted edge
    (m,n)        1           X              (m,j)    (m,n)            features E˜k and planar features S˜k with the global feature
  σk      =                             (||pk     − pk     ||), (1)
              Sk
                (m,n)
                         (m,j)    (m,n)
                                                                      map. The global feature map consists of a edge feature
                       p k     ∈S
                                k                                     map and a planar feature map and they are updated and
        (m,n)                                 (m,n)                   maintained separately. To reduce the searching computational
where  Sk      is the adjacent points of pk     in horizontal
                  (m,n)                                               cost, both edge and planar map are stored in 3D KD-trees.
direction and |Sk       | is the number of points in local            Similar to [19], the global line and plane are estimated by
               (m,n)
point cloud. Sk       can be easily collected based on point          collecting nearby points from the edge and planar feature
ID n, which can reduce the computational cost compared                map. For each edge feature point pE ∈ E˜k , we compute
to local searching. In experiment we pick 5 points along              the covariance matrix of its nearby points from the global
the clockwise and counterclockwise, respectively. For a flat          edge feature map. When the points are distributed in a
surface such as walls, the smoothness value is small while            line, the covariance matrix contains one eigenvalue that is
for corner or edge point, the smoothness value is large. For          much larger. The eigenvector ngE associated with the largest
each scan plane Pk , edge feature points are selected with            eigenvalue is considered as the line orientation and the
high σ, and surface feature points are selected with low σ.           position of the line pgE is taken as the geometric center of
Therefore, we can formulate the edge feature set as Ek and            the nearby points. Similarly, for each planar feature point
the surface feature set as Sk .                                       pS ∈ S˜k , we can get a global plane with position pgS and
                                                                      surface norm ngS . Note that different from global edge, the
B. Motion Estimation and Distortion Compensation
                                                                      norm of global plane is taken as the eigenvector associated
   In existing works such as LOAM [8] and LeGO-LOAM                   with the smallest eigenvalue.
[11], distortion is corrected by scan-to-scan match which iter-          Once the corresponding optimal edges/planes are derived,
atively estimates the transformation between two consecutive          we can find the linked global edges or planes for each feature
laser scans. However, iterative calculation is required to find       points from P̃k . Such correspondence can be used to estimate
the transformation matrix which is computationally ineffi-            the optimal pose between current frame and global map by
cient. In this paper, we propose to use two-stage distortion          minimizing the distance between feature points and global
compensation to reduce the computational cost. Note that              edges/planes. The distance between the edges features and
most existing 3D LiDARs are able to run at more than 10 Hz            global edge is:
and the time elapsed between two consecutive LiDAR scans
is often very short. Hence we can firstly assume constant                         fE (pE ) = pn • ((Tk pE − pgE ) × ngE ) ,       (5)
angular velocity and linear velocity during short period to
predict the motion and correct the distortion. In the second          where symbol   •   is the dot product and pn is the unit vector
stage, the distortion will be re-computed after the pose esti-        given by
mation process and the re-computed undistorted features will                                    (Tk pE − pgE ) × ngE
                                                                                      pn =                              .         (6)
be updated to the final map. In the experiment we find that                                   ||(Tk pE − pgE ) × ngE ||
the two-stage distortion compensation can achieve the similar
localization accuracy but at much less computational cost.            The distance between the planar features and global plane:
Denote the robot’s pose at k th scan as a 4x4 homogeneous
transformation matrix Tk , the 6-DoF transform between two                            fS (pS ) = (Tk pS − pgS ) • ngS .           (7)
consecutive frames k − 1 and k can be estimated by:
                                                                         Traditional feature matching only optimizes the geometry
                    k
                        = log Tk−2 −1 Tk−1 ,

                  ξk−1                                      (2)       distance mentioned above, while the local geometry distri-
                                                                      bution of each feature point is not considered. However, It is
where ξ ∈ se(3). The transform of small period δt between             observed that edge features with higher local smoothness and
the consecutive scans can be estimated by linear interpola-           planar features with lower smoothness are often consistently
tion:                                                               extracted over consecutive scans, which is more important
                                 N −n k
           Tk (δt) = Tk−1 exp          ξk−1 ,           (3)           for matching. Therefore, a weight function is introduced
                                  N
                                                                      to further balance the matching process. To reduce the
where function exp(ξ) transforms a Lie algebra into Lie               computational cost, the local smoothness defined previously
group defined by [18]. The distortion of current scan Pk              is re-used to determine the weight function. For each edge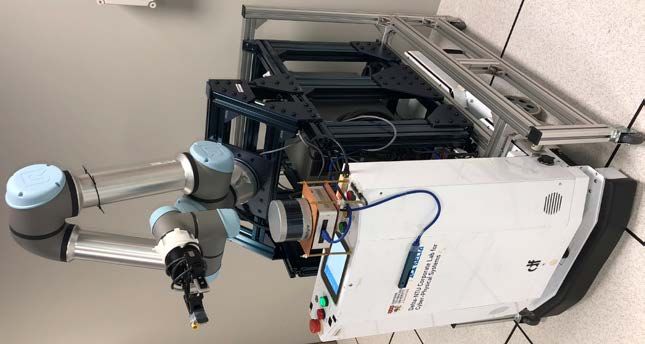
(a)                        (b)                (c)                     (d)                     (e)

                          (f)                        (g)                (h)                     (i)                     (j)

Fig. 2: Result of proposed F-LOAM on KITTI dataset. The estimated trajectory and ground truth are plotted in green and
red color respectively. (a)-(e) sequence 00-04. (f)-(j): sequence 06-10.

point pE with local smoothness σE and each plane point pS         odometry. The current pose estimation T∗k can be solved
with local smoothness σS , the weight is defined by:              by iterative pose optimization until it converges.
                                   exp(−σE )                      D. Mapping Building & Distortion Compensation Update
              W (pE ) = P
                                                (i,j)
                            p(i,j)   ˜
                                   ∈Ek exp   −σ k                    The global map consists of a global edge map and a
                                                            (8)   global planar map and is updated based on keyframes. Each
                                   exp(σS )
              W (pS ) = P                         ,             keyframe is selected when the translational change is greater
                                             (i,j)
                            p(i,j) ∈S˜k exp σk                    than a predefined translation threshold, or rotational change
                                                                  is greater than a predefined rotation threshold. The keyframe-
where Ek and Sk are the edge features and plane features at
                                                                  based map update can reduce the computational cost com-
k th scan. The new pose is estimated by minimizing weighted
                                                                  pared to frame-by-frame update. As mentioned in Section
sum of the point-to-edge and point-to-planar distance:
             X                     X                              III-B, the distortion compensation is performed based on the
        min      W (pE )fE (pE ) +    W (pS )fS (pS ).  (9)       constant velocity model instead of iterative motion estimation
        Tk
                                                                  in order to reduce the computational cost. However, this
The optimal pose estimation can be derived by solving             is less accurate than iterative distortion compensation in
the non-linear equation through Gauss-Newton method. The          LOAM. Hence, in the second stage, the distortion is re-
Jacobian can be estimated by applying left perturbation           computed based on the optimization result T∗k from the last
model with δξ ∈ se(3) [20]:                                       step by:
                    ∂Tp        (exp(δξ) Tp − Tp)                                  ∆ξ ∗ = log(Tk−1 −1 · T∗k ),         (13a)
             Jp =       = lim
                    ∂δξ   δξ→0        δξ
                                                                               N −n

                                                           (10)                              (m,n)     (m,n)
                                                                   P̃k∗ = {exp      · ∆ξ ∗ pk      | pk       ∈ Pk }. (13b)

                            I     −[Tp]×
                        = 3×3              ,                                    N
                           01×3    01×3
                                                                  The re-computed undistorted edge features and planar fea-
where [Tk pk ]× transforms 4D point expression {x, y, z, 1}       tures will be updated to the global edge map and the global
into 3D point expression {x, y, z} and calculates its skew        planar map respectively. After each update, the map is down-
symmetric matrix. The Jacobian matrix of edge residual can        sampled by using a 3D voxelized grid approach [21] in order
be calculated by:                                                 to prevent memory overflow.
                    ∂fE ∂Tp
   JE = W (pE )             = W (pE ) pn • (ngE × Jp ),    (11)               IV. EXPERIMENT EVALUATION
                    ∂Tp ∂δξ
                                                                  A. Experiment Setup
Similarly, we can derive
                                                                     To validate the algorithm, we evaluate F-LOAM on both a
                     ∂fS ∂Tp
        JS = W (pS )         = W (pS ) ngE • Jp .          (12)   large scale outdoor environment and a medium scale indoor
                     ∂Tp ∂δξ                                      environment. For the large scale experiment, we evaluate our
By solving nonlinear optimization we can derive odometry          approach on KITTI dataset [22] which is one of the most
estimation based on above correspondence. Then, we can            popular datasets for SLAM evaluation. Then the algorithm
use this result to calculate new correspondence and new           is integrated into warehouse logistics. It is firstly validated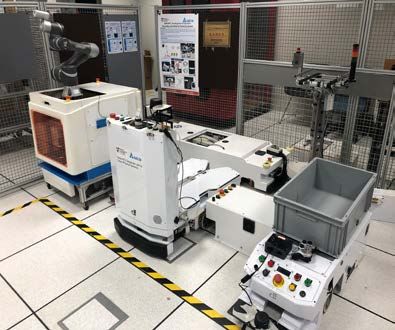
ATE & ARE                                                                                                          Computing Time (ms)
                                                                                                                                   500
 1.7
 1.5
                                                                                                                                   400
 1.3
 1.1                                                                                                                               300
 0.9
                                                                                                                                   200
 0.7
 0.5
                                                                                                                                   100
 0.3
 0.1                                                                                                                                 0
        IMLS-SLAM          F-LOAM              A-LOAM            LOAM            LeGO-LOAM        VINS-MONO         HDL-SLAM
                     Average Translational Error (%)    Average Rotational Error (x10^-2 deg/m)    Computing Time (ms)

               Fig. 3: Comparison of the different localization approaches on KITTI dataset sequence 00-10.

in a simulated warehouse environment and then is tested on                                                                           (a)
an AGV platform.

B. Evaluation on Public Dataset
   We firstly test our method on KITTI dataset [23] that
is popularly used for outdoor localization evaluation. The
dataset is collected from a driving car equipped with Velo-
dyne HDL-64 LiDAR, cameras, and GPS. Most state-of-
the-art SLAM methods have been evaluated on this dataset,
e.g., ORB-SLAM [24], VINS-Fusion [25], LIMO [26], and
LSD-SLAM [27]. To validate the robustness, we evaluate                                   (b)                                         (c)
the proposed algorithm on all sequences from the KITTI
dataset, which includes different scenarios such as high way,
city center, county road, residential area, etc. The ground                                                              Lidar Odometry
                                                                                                                          Ground Truth
truth of sequence 11-21 are not open to public and therefore,
we mainly illustrate our performance on sequence 00-11. We
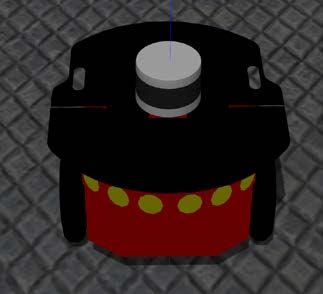
                                                                       Fig. 4: Simulated warehouse environment with both static
calculate the Average Translational Error (ATE) and Average
                                                                       and dynamic objects. (a) Simulated environment in Gazebo.
Rotational Error (ARE) which are defined by the KITTI
                                                                       (b) Simulated Pioneer robot and Velodyne LiDAR for eval-
dataset [23]:
                                                                       uation. (c) Trajectory comparison of F-LOAM and ground
                         1 X                                           truth.
            Erot (F) =            ∠[T̂j T̂i−1 Ti Tj−1 ]
                        |F|
                            i,j∈F
                                                            (14)
                         1 X
          Etrans (F) =            ||T̂j T̂i−1 Ti Tj−1 ||2 ,
                        |F|                                            as LOAM [10], A-LOAM, HDL-Graph-SLAM [28], IMLS-
                              i,j∈F
                                                                       SLAM [9], and LeGO-LOAM [11]. Noted that IMLS-SLAM
where F is a set of frames (i, j), T and T̂ are the estimated          is not open sourced and the results are collected from the
and true LiDAR poses respectively, ∠[·] is the rotation angle.         original paper [9]. In additional, the visual SLAM such as
The results are shown in Fig. 2. Our methods achieves an               VINS-MONO [29] is also compared. For consistency, the
average translational error of 0.80% and an average rotational         IMU information is not used and the loop closure detection is
error of 0.0048 deg /m over 11 sequences.                              removed. The testing environment is based on ROS Melodic
   We also compare our method with state-of-the-art meth-              [30] and Ubuntu 18.04. The result is shown in Fig. 3. IMLS-
ods, including both LiDAR SLAM and visual SLAM. In total               SLAM achieves the highest accuracy. However, all points are
there are 23,201 frames and traveled length of 22 km over 11           used in iterative pose estimation and the processing speed
sequences. The average computing time over all sequences               is slow. In terms of computational cost, LeGO-LOAM is
is also recorded. In order to have precise evaluation on the           the fastest LiDAR SLAM since it only applies optimization
computing time, all of the mentioned methods are tested on             on non-ground points. Among all methods compared, our
an Intel i7 3.2GHz processor based computer. The time is               method achieves second highest accuracy at an average
calculated from the start of feature extraction till the output        processing rate of more than 10 Hz, which is a good trade-
of estimated odometry. The proposed method is compared                 off between computational cost and localization accuracy.
with the open-sourced state-of-the-art LiDAR methods such              Our method is able to provide both fast and accurate SLAM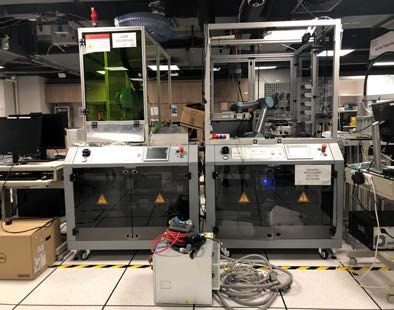
(a)                        (b)                                                                        (c)

                                               (d)                                                                        (e)

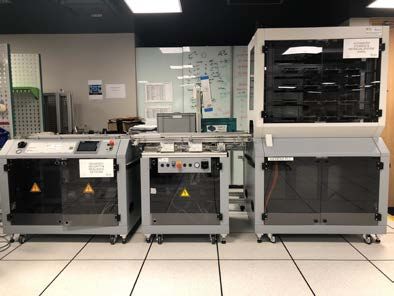
Fig. 5: F-LOAM in warehouse environment. (a) Automated Guided Vehicle used for experiment. (b-e) Advanced factory
environment built for AGV manipulation, including operating machine, auto charging station, and storage shelves. Center
image: F-LOAM result of warehouse localization and mapping.

    3                                                            around at the maximum speed of 2 m/s. We record the
                                                                 trajectory from F-LOAM and compare it with the ground
    2                                                            truth. The result is shown in Fig. 4 (c). The F-LOAM
                                                                 trajectory and ground truth are plotted in green and red color
                                                                 respectively. Our method is able to track the AGV moving in
    1
                                                                 high speed under the dynamic environment where the human
                                                                 operators are walking in the warehouse environment.
    0
                                                                    2) Experiment: To further demonstrate the performance
                                                                 of our method, we implement F-LOAM on an actual AGV
   -1                                                            used for smart manufacturing. As shown in Fig. 5 (b-e), the
                                                                 warehouse environment consists of three main areas: auto
                    Ground Truth
   -2                                                            charging station, material handling area and manufacturing
                    FLOAM
                                                                 station. A fully autonomous factory requires the robot to
   -3                                                            deliver material to manufacturing machines for assembly
     -4           -2           0           2           4         and collect products. All these operations require precise
                                                                 localization to ensure the reliability and safety. The robot
Fig. 6: Comparison of the proposed method and ground truth.
                                                                 platform for testing is shown in Fig. 5 (a) and is equipped
Our method can precisely track robot’s pose and it achieves
                                                                 with an Intel NUC mini computer and a Velodyne VLP-16
an average localization error of 2 cm
                                                                 sensor. The localization and mapping result can be found
                                                                 in Fig. 5. In this scenario, the robot automatically explores
solution for real time robotic applications and is competitive   the warehouse and builds the map simultaneously using the
among state-of-the-art approaches.                               proposed method.
                                                                    3) Performance evaluation: The proposed method is also
C. Experiment on warehouse logistics                             tested in an indoor room equipped with a VICON system
   In this experiment, we target to build an autonomous          to evaluate its localization accuracy. The robot is remotely
warehouse robot to replace human-labour-dominated man-           controlled to move in the testing area. The results are shown
ufacturing. The AGV is designed to carry out daily tasks         in Fig. 6, where the F-LOAM trajectory and the ground truth
such as transportation. This requires the robot platform to      trajectory are plotted in green and red color respectively.
actively localize itself in a complex environment.               It can be seen that our method can accurately track the
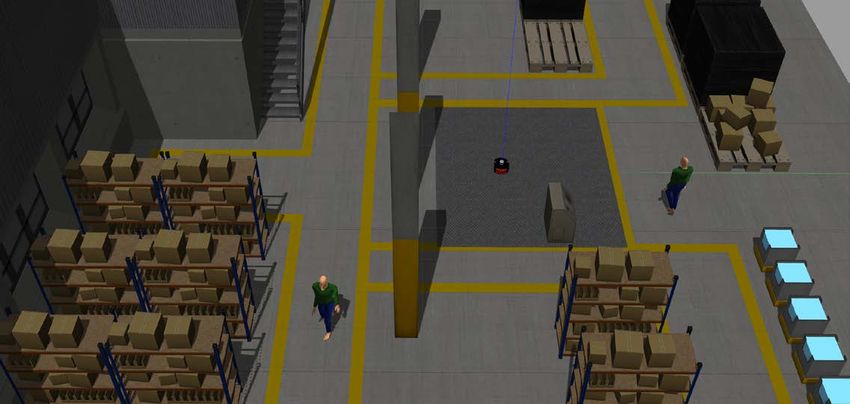
   1) Simulation: We firstly validate our algorithm in a sim-    robot’s pose. It achieves an average localization accuracy of
ulated environment. The simulation environment is built up       2 cm compared to the ground truth provided by the VICON
on Gazebo and Linux Ubuntu 18.04. As shown in Fig. 4 (a),        system.
we use a virtual Pioneer robot and a virtual Velodyne VLP-16        4) Ablation study: To further evaluate the performance of
as the ground vehicle platform. The simulated environment        the proposed distortion compensation approach, we compare
reconstructs a complex warehouse environment including           the results of different approaches in the warehouse envi-
various objects such as moving human workers, shelves,           ronment. We firstly remove the distortion compensation in
machines, etc. The robot is controlled by a joystick to move     F-LOAM and record both computing time and localization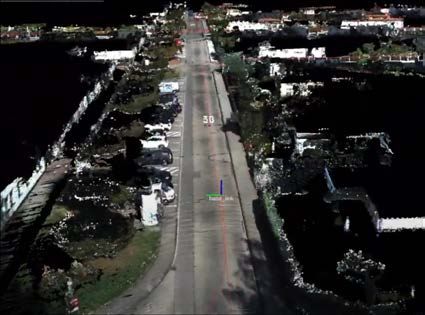
[7] P. J. Besl and N. D. McKay, “Method for registration of 3-d shapes,”
                               Computing Time        Accuracy
              Methods                                                             in Sensor fusion IV: control paradigms and data structures, vol. 1611.
                                 (ms/frame)            (cm)
                                                                                  International Society for Optics and Photonics, 1992, pp. 586–606.
          No Compensation             66.33             2.132                 [8] J. Zhang and S. Singh, “Low-drift and real-time lidar odometry and
              LOAM                    84.52             2.052                     mapping,” Autonomous Robots, vol. 41, no. 2, pp. 401–416, 2017.
             F-LOAM                   69.07             2.037                 [9] J.-E. Deschaud, “Imls-slam: scan-to-model matching based on 3d
                                                                                  data,” in 2018 IEEE International Conference on Robotics and Au-
                                                                                  tomation (ICRA). IEEE, 2018, pp. 2480–2485.
TABLE I: Ablation study of localization accuracy and com-                    [10] J. Zhang and S. Singh, “Loam: Lidar odometry and mapping in real-
putational cost.                                                                  time.” in Robotics: Science and Systems, vol. 2, no. 9, 2014.
                                                                             [11] T. Shan and B. Englot, “Lego-loam: Lightweight and ground-
                                                                                  optimized lidar odometry and mapping on variable terrain,” in 2018
                                                                                  IEEE/RSJ International Conference on Intelligent Robots and Systems
                                                                                  (IROS), 2018, pp. 4758–4765.
accuracy. Then we add the iterative distortion compensation                  [12] D. Rozenberszki and A. L. Majdik, “Lol: Lidar-only odometry and
method from LOAM into our method and record the result.                           localization in 3d point cloud maps,” in 2020 IEEE International
Lastly we use the proposed motion compensation and record                         Conference on Robotics and Automation (ICRA). IEEE, 2020, pp.
                                                                                  4379–4385.
the result. The results are shown in Table I. It can be seen that            [13] T. Shan, B. Englot, D. Meyers, W. Wang, C. Ratti, and R. Daniela,
the proposed approach is much faster than the LOAM with                           “Lio-sam: Tightly-coupled lidar inertial odometry via smoothing and
motion compensation yet with a slightly better localization                       mapping,” in IEEE/RSJ International Conference on Intelligent Robots
                                                                                  and Systems (IROS). IEEE, 2020.
accuracy..                                                                   [14] D. Yin, Q. Zhang, J. Liu, X. Liang, Y. Wang, J. Maanpää, H. Ma,
                                                                                  J. Hyyppä, and R. Chen, “Cae-lo: Lidar odometry leveraging fully
                        V. CONCLUSION                                             unsupervised convolutional auto-encoder for interest point detection
   In this paper, we present a computationally efficient Li-                      and feature description,” arXiv preprint arXiv:2001.01354, 2020.
                                                                             [15] J. Masci, U. Meier, D. Cireşan, and J. Schmidhuber, “Stacked
DAR SLAM framework which targets to provide a public                              convolutional auto-encoders for hierarchical feature extraction,” in
solution to robotic applications with limited computational                       International conference on artificial neural networks. Springer, 2011,
resources. Compared to traditional methods, we propose to                         pp. 52–59.
                                                                             [16] H. Shi, G. Lin, H. Wang, T.-Y. Hung, and Z. Wang, “Spsequencenet:
use a non-iterative two stage distortion compensation to                          Semantic segmentation network on 4d point clouds,” in Proceedings
reduce the computational cost. It is also observed that edge                      of the IEEE/CVF Conference on Computer Vision and Pattern Recog-
features with higher local smoothness and planar features                         nition, 2020, pp. 4574–4583.
                                                                             [17] R. Bergelt, O. Khan, and W. Hardt, “Improving the intrinsic calibration
with lower smoothness are often consistently extracted over                       of a velodyne lidar sensor,” in 2017 IEEE SENSORS. IEEE, 2017,
consecutive scans, which are more important for scan-to-                          pp. 1–3.
map matching. Therefore, the local geometry feature is also                  [18] A. Kirillov Jr, An introduction to Lie groups and Lie algebras.
                                                                                  Cambridge University Press, 2008, vol. 113.
considered for iterative pose estimation. To demonstrate the                 [19] L. Zhang and P. N. Suganthan, “Robust visual tracking via co-trained
robustness of the proposed method in practical applications,                      kernelized correlation filters,” Pattern Recognition, vol. 69, pp. 82–93,
thorough experiments have been done to evaluate the perfor-                       2017.
                                                                             [20] T. D. Barfoot, “State estimation for robotics: A matrix lie group ap-
mance, including simulation, indoor AGV test, and outdoor                         proach,” Draft in preparation for publication by Cambridge University
autonomous driving test. Our method achieves an average                           Press, Cambridge, 2016.
localization accuracy of 2 cm in indoor test and is one of the               [21] R. B. Rusu and S. Cousins, “3d is here: Point cloud library (pcl),”
                                                                                  in 2011 IEEE international conference on robotics and automation.
most accurate and fastest open-sourced methods in KITTI                           IEEE, 2011, pp. 1–4.
dataset.                                                                     [22] A. Geiger, P. Lenz, C. Stiller, and R. Urtasun, “Vision meets robotics:
                                                                                  The kitti dataset,” The International Journal of Robotics Research,
                            R EFERENCES                                           vol. 32, no. 11, pp. 1231–1237, 2013.
                                                                             [23] A. Geiger, P. Lenz, and R. Urtasun, “Are we ready for autonomous
 [1] C. Debeunne and D. Vivet, “A review of visual-lidar fusion based             driving? the kitti vision benchmark suite,” in Conference on Computer
     simultaneous localization and mapping,” Sensors, vol. 20, no. 7, p.          Vision and Pattern Recognition (CVPR), 2012.
     2068, 2020.                                                             [24] R. Mur-Artal, J. M. M. Montiel, and J. D. Tardos, “Orb-slam: a
 [2] S. Milz, G. Arbeiter, C. Witt, B. Abdallah, and S. Yogamani, “Visual         versatile and accurate monocular slam system,” IEEE transactions on
     slam for automated driving: Exploring the applications of deep learn-        robotics, vol. 31, no. 5, pp. 1147–1163, 2015.
     ing,” in Proceedings of the IEEE Conference on Computer Vision and      [25] T. Qin, J. Pan, S. Cao, and S. Shen, “A general optimization-based
     Pattern Recognition Workshops, 2018, pp. 247–257.                            framework for local odometry estimation with multiple sensors,” arXiv
 [3] F. Cunha and K. Youcef-Toumi, “Ultra-wideband radar for robust               preprint arXiv:1901.03638, 2019.
     inspection drone in underground coal mines,” in 2018 IEEE Interna-      [26] J. Graeter, A. Wilczynski, and M. Lauer, “Limo: Lidar-monocular
     tional Conference on Robotics and Automation (ICRA). IEEE, 2018,             visual odometry,” in 2018 IEEE/RSJ International Conference on
     pp. 86–92.                                                                   Intelligent Robots and Systems (IROS). IEEE, 2018, pp. 7872–7879.
 [4] S. Ito, S. Hiratsuka, M. Ohta, H. Matsubara, and M. Ogawa, “Small       [27] J. Engel, J. Stückler, and D. Cremers, “Large-scale direct slam with
     imaging depth lidar and dcnn-based localization for automated guided         stereo cameras,” in Intelligent Robots and Systems (IROS), 2015
     vehicle,” Sensors, vol. 18, no. 1, p. 177, 2018.                             IEEE/RSJ International Conference on. IEEE, 2015, pp. 1935–1942.
 [5] W. Hess, D. Kohler, H. Rapp, and D. Andor, “Real-time loop closure      [28] K. Koide, J. Miura, and E. Menegatti, “A portable three-dimensional
     in 2d lidar slam,” in 2016 IEEE International Conference on Robotics         lidar-based system for long-term and wide-area people behavior
     and Automation (ICRA). IEEE, 2016, pp. 1271–1278.                            measurement,” International Journal of Advanced Robotic Systems,
 [6] R. Li, J. Liu, L. Zhang, and Y. Hang, “Lidar/mems imu integrated             vol. 16, no. 2, p. 1729881419841532, 2019.
     navigation (slam) method for a small uav in indoor environments,” in    [29] T. Qin, P. Li, and S. Shen, “Vins-mono: A robust and versatile monoc-
     2014 DGON Inertial Sensors and Systems (ISS). IEEE, 2014, pp.                ular visual-inertial state estimator,” IEEE Transactions on Robotics,
     1–15.                                                                        vol. 34, no. 4, pp. 1004–1020, 2018.
                                                                             [30] J. M. O’Kane, “A gentle introduction to ros,” 2014.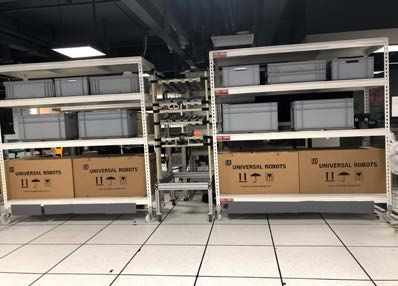
You can also read


