Downtown Grocery Market Study for the City of Roseburg - February 2011
←
→
Page content transcription
If your browser does not render page correctly, please read the page content below
Downtown Grocery Market
Study for the City of
Roseburg

February 2011
Contents
Introduction ..................................................................................................................... 2
   Methodology ................................................................................................................ 2
Supply ............................................................................................................................. 3
Demand .......................................................................................................................... 7
   Target Markets ............................................................................................................ 7
   Statistical Analysis ..................................................................................................... 10
Site Analysis ................................................................................................................. 13
Conclusions .................................................................................................................. 18
   Grocery Supply & Demand ........................................................................................ 18
   Site/Location Opportunities ........................................................................................ 19
   Grocery Targets ......................................................................................................... 19
   Marketing Strategy..................................................................................................... 21
Appendix A. Market Area Demographic Data ................................................................ 23
Appendix B. Sample Marketing Sheet ........................................................................... 27

City of Roseburg Grocery Market Analysis                                                                                            1
Introduction
The City of Roseburg contracted with Marketek in September 2010 to prepare a grocery
market study for downtown Roseburg. The purpose of the analysis is to identify market
opportunities for a downtown grocer and provide conclusions and next steps for
business attraction activities related to filling this niche.

This multifaceted study includes:

•   Clarification of the grocery store concept desired for downtown Roseburg;

•   Identification of critical factors/location requirements for grocer success and local
    market trends;

•   Characterization of Roseburg’s grocery market potential within the marketplace,
    including existing supply, consumer preferences, needs and buyer patterns and
    opportunities and challenges for growth and development;

•   Analysis of potential grocery sites considering visibility, access, topography, parking,
    surrounding land uses and other site-related attributes; and

•   Next steps for business recruitment, including recommended potential grocery
    targets and a marketing strategy designed to attract a downtown grocer.

Methodology
The market analysis considers a ten-year time period from 2010 to 2020, a realistic
projection period for development. Marketek conducted two site visits in fall 2010, which
included driving and walking tours in Roseburg, Sutherlin and Winston, visits to over 15
existing grocery/convenience stores, interviews, visits to potential grocery store sites and
meetings with the local project team.

Other primary and secondary research included:

•   Statistical estimates of potential supportable grocery space;
•   Interviews with local business and community leaders;
•   Grocery store inventories and mapping of key convenience shopping centers;
•   Land and improvement values for potential grocery sites; and
•   Demographic analysis of downtown Roseburg and its convenience market area.

City of Roseburg Grocery Market Analysis                                                  2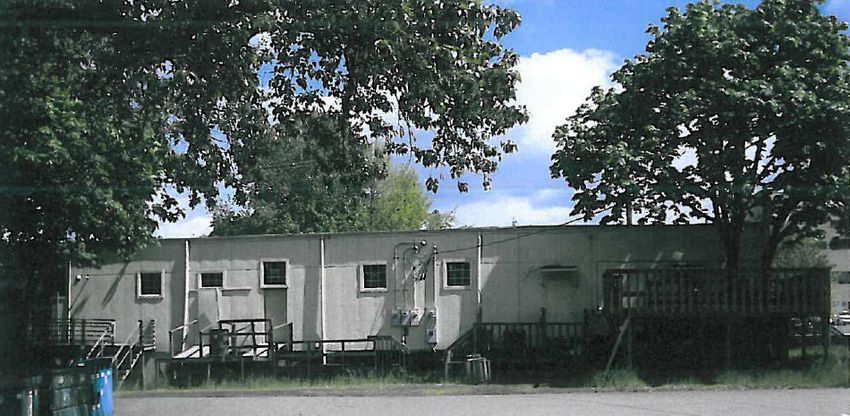
Supply
Marketek prepared an inventory of existing grocery shopping in and around Roseburg,
including full-service grocers, convenience stores, wholesale/outlet stores and specialty
grocers. The figures and map on the following pages summarize the local supply, which
includes a total of 436,369 square feet in Roseburg and 64,558 in Sutherlin and
Winston. The majority of grocery space is in traditional, full-service stores. These seven
stores offer 321,837 square feet of space, or 64.2 percent of grocery store space. Most
are high quality with a wide selection. Amenities include gas, bakery, deli, natural food
selection and extended hours. Weekly grocery sales at these stores are estimated to
range from $165,000 at Ray’s Food Place to $700,000 at Sherm’s Thunderbird.

Three specialty grocers – fish markets, bakeries and green grocers – constitute only 2.4
percent of space. New Day offers health foods, but has limited selection giving the size
of the Roseburg market. Kruse Farms sells local produce, meats and baked goods.
Estimated sales are $6,000 per week at New Day and $18,000 at Kruse Farms.

Overall, there is a void in specialty, natural food stores in the Roseburg market area.
Additionally, there are no grocery stores serving the eastside/downtown market, which
includes existing residents and employees and new residents likely to move in to the
area as housing development continues.

Fred Meyer                                          Costco

Kruse Market                                        Sherm’s Thunderbird

City of Roseburg Grocery Market Analysis                                                3
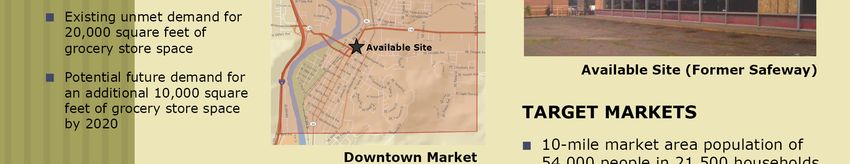
Figure 1. Roseburg Grocery Supply, December 2010
                           Estimated
        Store Type        Grocery Store                              Comments
                             Space

Convenience Stores
 J&J Market                  1,223 SF
 Southgate Market*           2,500 SF
 R-Mart                      2,400 SF
 Anderson's Market           3,103 SF
 Winchester Market           2,496 SF
 Fast Stop Market            5,130 SF
 Ridgeway Market             1,976 SF
 Texaco Food Mart            1,662 SF
 Log Cabin Grocery           4,800 SF
 Melrose Country Store       4,699 SF
 Chevron Food Mart             384 SF
 Dixonville Store            2,940 SF
 Subtotal                   33,313 SF

Full-service Grocery
  Albertsons                57,685 SF     Good quality; Well stocked; Gas; Estimated weekly sales of
                                          $300K
 Safeway*                   55,836 SF     Caters to higher incomes; Starbucks; Bakery; Deli; Gas;
                                          Estimated weekly sales of $350K
 Fred Meyer*                70,000 SF     Recently remodeled; Natural foods selection; Moderately
                                          busy; Estimated weekly sales of $470K
 Sherm's Thunderbird        68,135 SF     Regional hub; Open 24 hrs; Excellent selection; Very busy;
                                          Estimated weekly sales of $700K
 Ray's Food Place           20,280 SF     Could be upgraded; Estimated weekly sales of $165K
 Subtotal                   271,936 SF

Wholesale/Outlet Store
 Wal Mart*                  48,000 SF     Estimated weekly sales of $385K
 Bi-Mart*                    8,000 SF     Estimated weekly sales of $90K
 Grocery Outlet             19,406 SF     Most discount business already taken; Estimated weekly
                                          sales of $120K
 Costco*                    46,000 SF     Light traffic; Estimated weekly sales of $250K
 Subtotal                   121,406 SF

Specialty Grocery**
  New Day                    3,200 SF     Health food; limited selection for market; Estimated weekly
                                          sales of $6K
 Kruse Farms                 6,514 SF     Local produce & meat; Scratch Bakery; Farmers market feel;
                                          Estimated weekly sales of $18K
 Subtotal                    9,714 SF

TOTAL                       436,369 SF

*Estimates of grocery utilizing space only.
**Specialty includes fish market, bakeries and green grocers.

Source: Marketek, Inc; City of Roseburg; Reference USA

City of Roseburg Grocery Market Analysis                                                                4
Map 1. Roseburg Grocery Supply, December 2010*


  Full-Service Grocery                 Wholesale/Outlet Store           Specialty Grocery
 *Does not include convenience stores. Ray’s Food Place not shown.

City of Roseburg Grocery Market Analysis                                                       5
Figure 2. Sutherlin and Winston Grocery Supply, December 2010
                                         Estimated Grocery
               Store Type                                                       Comments
                                             Store Space

Convenience Stores
 Driftwood Market, Sutherlin                   2,640 SF
 Smitty's Food Mart & Deli, Sutherlin          3,238 SF        Full sit-down deli and convenience grocery
 AM Market, Winston                            2,600 SF
 Winston Food Market & Deli                    3,544 SF
 Subtotal                                     12,022 SF

Full-service Grocery
  Price Less Foods (Rays), Sutherlin          25,417 SF        Conventional community grocery
  Price Less Foods (Rays), Winston            24,484 SF        Conventional community grocery
  Subtotal                                    49,901 SF

Specialty Grocery*
 Harvest Store, Winston                        2,635 SF
 Subtotal                                      2,635 SF

TOTAL                                         64,558 SF

*Specialty includes fish market, bakeries and green grocers.

Source: Marketek, Inc; Reference USA

City of Roseburg Grocery Market Analysis                                                               6
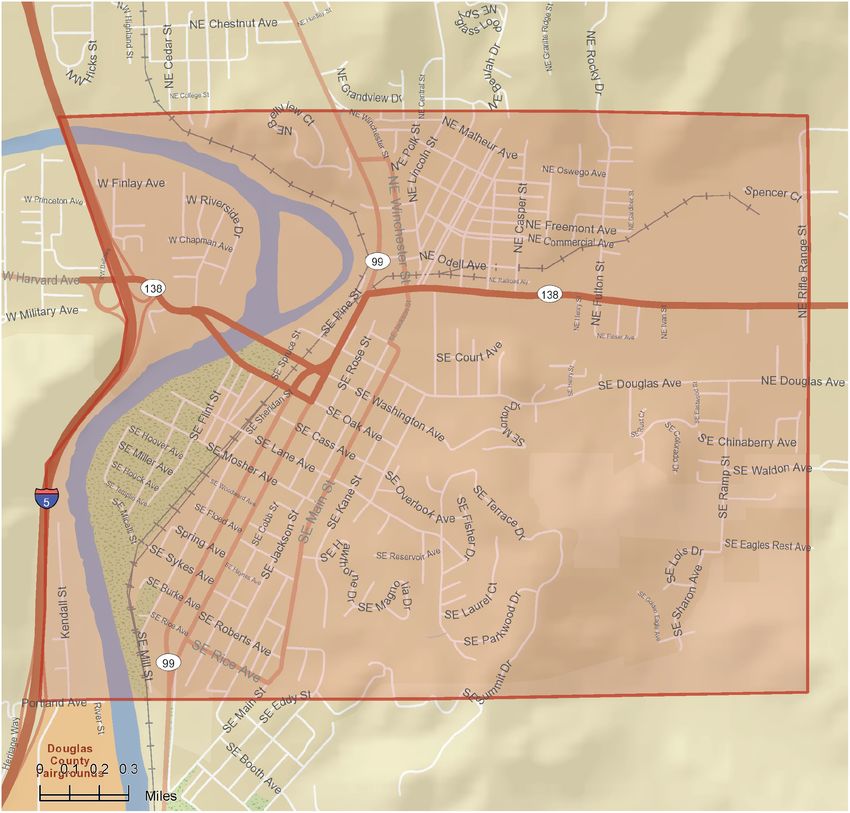
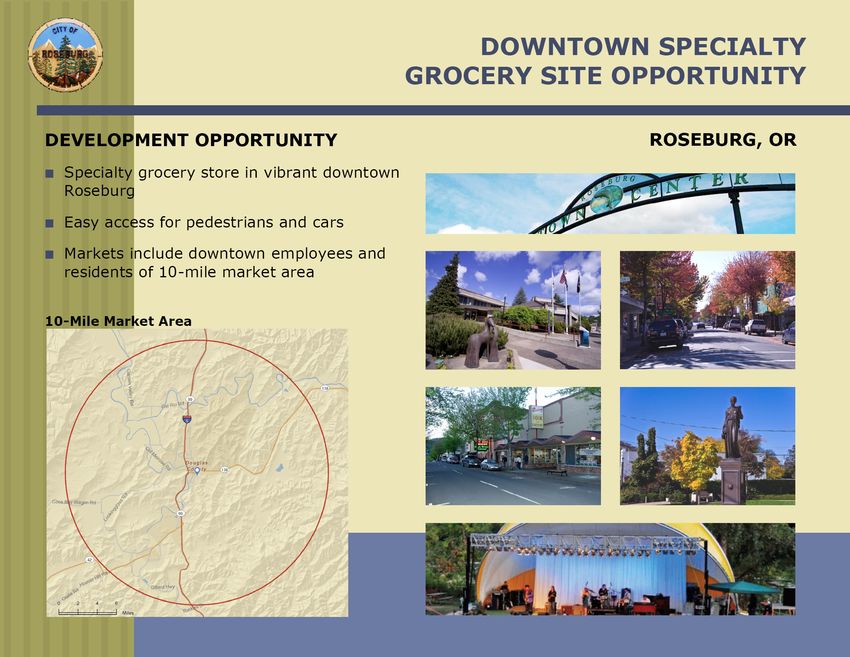
Demand
The demand analysis estimates the amount of potential new grocery space that can be
supported in downtown Roseburg over the next ten years. Target markets include
downtown residents, downtown employees and convenience market area residents.
This section provides an overview of these markets and a statistical demand analysis for
grocery store space.

Target Markets
Marketek delineated two market areas for this analysis. The first, the Downtown Market,
includes residents living in and employees working in downtown who will be captive
customers for new grocery store space (Map 2). The larger Convenience Market
consists of residents living within a ten-mile radius; while they may not come to
downtown on a daily basis, they will be potential shoppers of a future grocery store there
(Map 3).

Map 2. Downtown Market Area

City of Roseburg Grocery Market Analysis                                                7

Map 3. Convenience Market Area: 10-Mile Radius

Figure 3 on the following page summarizes demographic trends for Downtown and
Convenience Market Area residents, with comparisons to Douglas County and Oregon.
The Downtown Market Area includes an estimated 6,048 residents in 2,476 households
as of 2010. The larger Convenience Market Area consists of 53,924 residents and
21,423 households.

Average annual growth in both areas was below that of the state for the last decade.
Downtown’s population grew by 0.3 percent per year, the Convenience Market Area by
0.7 percent and the State by 1.3 percent. Growth in all geographies is expected to slow
its pace over the next five years. Downtown is projected to add 45 people and the
Convenience Market is expected to add 974.

Downtown and Convenience Market Area residents have lower incomes and are less
ethnically diverse than the State. Median household income is $38,806 for downtown
residents, $44,566 for Convenience Market residents and $53,104 for Oregon. The
large majority of residents in both market areas are white – 91 percent in downtown and
93 percent in a ten-mile radius. Hispanic persons constitute 6 percent of downtown
population and 5 percent of the Convenience Market population.

Please refer to Appendix A for additional demographic data.

City of Roseburg Grocery Market Analysis                                             8

Figure 3. Demographic Snapshot, 2010

Demographic                         Downtown Convenience      Douglas     State of
Indicator                           Market Area Market Area   County      Oregon

Population
 2010 (estimate)                       6,048      53,924      106,128     3,865,839
  2015 (forecast)                      6,093      54,898      107,777     4,069,317
  Avg. Ann. % Change ('00 to '10)      0.30%       0.66%       0.57%       1.30%
  Avg. Ann. % Change ('10 to '15)      0.15%       0.36%       0.31%       1.05%

Households
  2010 (estimate)                      2,476      21,423      42,331      1,508,399
  2015 (forecast)                      2,495      21,833      43,052      1,589,342
  Avg. Ann. % Change ('00 to '10)      0.33%       0.70%       0.63%       1.31%
  Avg. Ann. % Change ('10 to '15)      0.15%       0.38%       0.34%       1.07%

Average Household Size                     2.31    2.46         2.47        2.51

Median Household Income               $38,806     $44,566     $41,287     $53,104

Median Age (Years)                         39.4    43.2         44.4        38.2

Race
 Percent White Alone                   91.0%       92.6%       92.3%       82.8%
  Percent Other Race/2+ Races              9.0%    7.4%        7.7%        17.2%
  Percent Hispanic                         6.0%    4.7%        4.5%        11.9%

Homeownership                          52.5%       70.7%       71.9%       64.3%

Educational Attainment
  Associate Degree                     10.7%       9.6%        9.0%         8.4%
  Four Year Degree or More             19.6%       18.1%       15.8%       28.7%

Source: ESRI BIS

Figure 4 shows estimated number of employees working in downtown Roseburg by
industry. Of the 5,309 workers in downtown, the largest share work in the services
industry (36 percent), followed by government (24 percent). These employees are a
crucial, captive market for a potential downtown grocer. Research conducted by the
Building Owners and Managers Association of America estimates that office workers
spend between 10 and 15 percent of their expendable income near their places of work.
For these employees, food/restaurants are a top spending category.

City of Roseburg Grocery Market Analysis                                              9
Figure 4. Downtown Employees, 2010
Downtown Market
Industry # %
Agriculture & Mining 15 0.3%
Construction 170 3.2%
Manufacturing 258 4.9%
Transportation 185 3.5%
Communication 33 0.6%
Electric/Gas/Water/Sanitary Services 16 0.3%
Wholesale Trade 329 6.2%
Retail Trade 774 14.6%
Finance/Insurance/Real Estate 351 6.6%
Services 1,902 35.8%
Government 1,264 23.8%
Other 12 0.2%
Total Employment 5,309 100.0%
Source: ESRI BIS
Statistical Analysis
Marketek estimated potential demand for grocery store space in downtown Roseburg
based on household spending patterns for Downtown and Convenience Market
residents. Spending potential is converted to square feet of store space based on sales
per square foot standards derived from the Urban Land Institute’s Dollars and Cents of
Shopping Centers.
Existing Demand
Demand is derived from two sources. The first, “existing demand,” is grocery demand
generated by existing market area households that currently is not being met within the
market area. Existing demand is found by comparing retail supply (i.e., actual retail
sales) with retail demand (i.e., the expected amount spent by market area residents
based on consumer expenditure patterns). When demand outweighs supply, a leakage
occurs, indicating that residents are spending outside of the market area. While
consumers will always do some amount of shopping away from home, this comparison
provides a reasonable indication of the availability of groceries within the local market.
Figure 5 shows the existing grocery supply and demand balance for the Downtown and
Convenience Market Areas. In Downtown, there is estimated leakage of $6.3 million in
grocery sales, which translates to 16,109 square feet of store space. In the larger
Convenience Market, grocery supply and demand are roughly in balance – the sales
surplus of $311,000 translates to only 800 square feet of store space.
Along with Downtown Market Area residents, employees in the downtown are a second
source of existing grocery demand. We assume that half of downtown residents are the
primary grocery shopper for their household and they do an average of fifteen percent of
their grocery shopping downtown. Based on grocery spending trends and standard
City of Roseburg Grocery Market Analysis 10grocery sales per square foot, this estimated demand from downtown employees
translates to potential support for 4,771 square feet of grocery store space.
Figure 5. Existing Grocery Balance, 2010
Spending Supply/ Leakage Sales Space
Market Area
Potential Retail Sales (or Surplus) ($/SF)* (SF)
Downtown Market $8,146,710 $1,864,027 $6,282,683 $390 16,109
Convenience Market $82,300,954 $82,611,949 ($310,995) --- ---
* Target sales are based on the Urban Land Institute, "Dollars and Cents of Shopping Centers."
Sources: ESRI BIS; Urban Land Institute; Marketek, Inc.
Future Demand
The second source of demand, “future demand,” is demand from anticipated market
area household growth over the next ten years. Demand estimates are based on
current spending patterns and projected growth rates through 2020. Figure 6 shows
average household spending for several grocery categories and potential future demand
for new grocery store space generated by household growth within a ten-mile radius. As
shown, there is potential for an additional 9,919 square feet of grocery store space
through 2020.
Figure 6. Future Grocery Demand, 2010 to 2020
2010 2015 2020
Per Target Potential Potential Potential
Merchandise Household Sales Sales Space Sales Space Sales Space
Type Expenditure ($/SF)* (in mil $) (SF) (in mil $) (SF) (in mil $) (SF)
Bakery, Cereals $478
Meat, Poultry, Fish, Eggs $816
Dairy $400
Produce $610
Beverages $562
Other** $1,806
Total Grocery Spending $4,673 $390 $100.1 256,683 $102.0 261,596 $104.0 266,602
Five Year Net Gain $1.9 4,912 $2.0 5,006
* Target sales are based on the Urban Land Institute, "Dollars and Cents of Shopping Centers."
**Includes other food, snacks, smoking products and household products.
Sources: ESRI BIS; Urban Land Institute; Marketek, Inc.
City of Roseburg Grocery Market Analysis 11Demand Summary
Figure 7 summarizes potential demand for new grocery store space in downtown
Roseburg, which totals 29,209 square feet over the next ten years. The degree to which
downtown Roseburg can ultimately capitalize on this potential will depend on numerous
factors, including the availability of quality, ready-to-go sites; business development
efforts and the overall pace and success of other downtown commercial and residential
development. A passive or segmented approach would likely result in downtown falling
short of its estimated potential.
Figure 7. Summary of Potential Supportable Grocery Store Space, 2010 to 2020
Existing Unmet Existing Unmet
Future Demand:
Demand: Demand: Total Potential
Convenience
Downtown Downtown New Grocery Store
Market Residents
Residents Employees* Space
2010 2010 2010-2020
Potential Grocey Demand 16,109 SF 4,771 SF 9,919 SF 30,799 SF
*Assumes that half of downtown employees are the primary grocery shopper and that they will do an
average of fifteen percent of their houshold grocery shopping downtown.
Source: ESRI; Urban Land Institute; Marketek, Inc.
City of Roseburg Grocery Market Analysis 12Site Analysis
A review of commercially zoned land in the downtown core resulted in the identification
of several redevelopable sites. Five sites (shown below) were evaluated based on their
central location, vacancy (site and/or building), and general scale. With low
improvement:land ratios and deteriorated structures, it is assumed that all on-site
properties would be demolished to accommodate new development, with the exception
of the Village Station development.
Map 4. Downtown Roseburg Possible Grocery Sites
= Hansens (former auto dealership) = Safeway (former)
= Rite Aid (former) = Village Station
= New Day (former)
City of Roseburg Grocery Market Analysis 13Hansens (former auto dealership)
Description & Size 1.57 acres; Oak Ave. (north), Stephens (east), Cass (south), Pine
(west); Includes sales lots, showroom and office
Zoning C3 – CBD Zone
Ownership & Robert and Janice Hansen, Roseburg, Oregon
Availability
Building Vacant; Some auto parking
Surrounding Land Use Somewhat isolated; nearby business/structures are very limited
Improvement:Land 1.55
Ratio
Comments Large, nearly full city block site. On downtown couplet, Oak and
Stephens, with high traffic; auto-oriented. High visibility from Oak
Avenue (east bound, one-way). Very good auto access. Less
walkable for downtown employees than other sites.
Former Hansens Auto
Dealership
Safeway (former)
Description & Size 3.24 acre block bordered by Hwy 138/Stephens St. (west),
Douglas Ave. (north), Washington Ave. (south), Rose St. (east)
Zoning C3
Ownership & Availability Derose Family, San Jose, CA
Deed restricts until November 2013
Building Vacant
Surrounding Land Use Adjacent to government cluster and downtown employment
anchors
Improvement:Land Ratio 0.01
Comments Large footprint with potential for small grocery-anchored strip
center, especially in combination with Rite Aid site. Ample
parking potential. Pivotal, central downtown site.
City of Roseburg Grocery Market Analysis 14Former Safeway
Rite Aid (former)
Description & Size 2.26 acre site; Partial block bordered by Rose (west), Douglas
Ave. and adjacent properties (north), Washington Ave. (south)
and Jackson (east)
Zoning C3
Ownership & Availability Derose Family, San Jose, CA
Deed restricts until November 2013
Building Vacant
Improvement:Land Ratio 1.44
Comments Challenged by slope and two-level existing space; excellent
location in heart of downtown w/ easy walking from all
employment anchors; limited on-site parking; potential
redevelopment with Safeway site to create large impact project
Former Rite Aid
City of Roseburg Grocery Market Analysis 15Village Station
Description & Size 0.64 acres (not including depot and parking strip adjacent to
railroad tracks); Two-story 37,000 SF business complex with
significant ground floor vacancy; Located at high traffic
intersection of Hwy 99 and 138 couplets; Bordered by SE Oak
Ave. (north), SE Pine St. (east), railroad tracks (west) and
Sheridan St. (south)
Zoning C3
Ownership & Availability South Umpqua Bank
Building Vacant
Surrounding Land Use Across from historic railroad depot, which houses McMenamin
brewpub; Rescue Mission
Improvement:Land Ratio 8.19
Comments Limited retail frontage, low visibility for ground floor space and
limited physical appeal; Best suited for office/service tenants
not relying on foot traffic; Interior courtyard limits retail;
Circulation is challenged with street frontage limited to two sites
(Oak and Pine)
Village Station
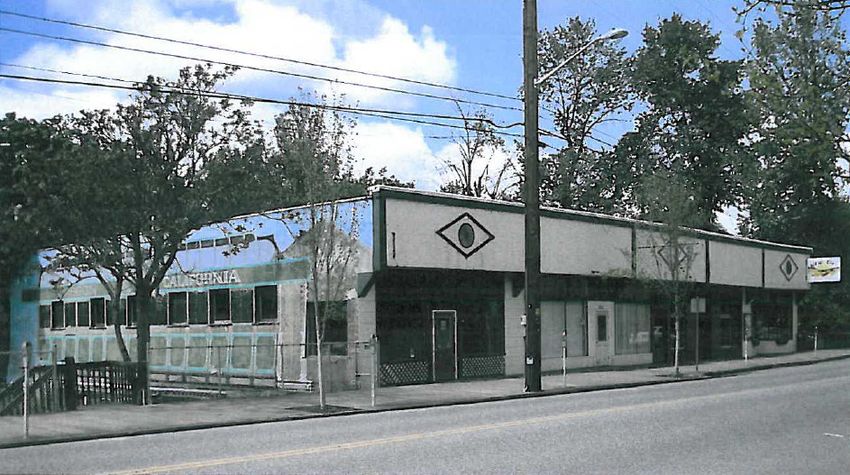
City of Roseburg Grocery Market Analysis 16New Day (former)
Description & Size 0.51 acres site, exclusive of adjacent parking lot. Located on
west side of SE Jackson Street with addresses of 210, 212A &
B and 214 SE Jackson Street
Zoning C3
Ownership & Availability City of Roseburg
Building Vacant; To be demolished
Surrounding Land Use Civic
Improvement:Land Ratio 0.62
Comments City will level the existing building. City ownership is asset.
Opportunity for signature building and development at key
Downtown gateway. On Deer Creek, potential asset for views,
dining. Easy proximity to downtown employees. Good visibility
from Stephens St, a downtown thoroughfare.
Former New Day
City of Roseburg Grocery Market Analysis 17Conclusions
Grocery Supply & Demand
The conventional grocery market is very well served in Roseburg, with a selection of
healthy stores including Safeway, Albertsons, Fred Meyer and Sherm’s. These grocers
have made large investments to hold on to their locations by remodeling, purchasing
property and adding new amenities. While Sherm’s has not done as much upkeep as
other stores, it fills an important role as a value/discount grocery. Overall, these stores
are committed to the long term and it is in Roseburg’s best interest to keep them healthy.
In terms of the existing supply or competitive marketplace, Roseburg lacks a healthy,
natural foods, specialty grocery. There is modest but growing demand for a downtown
grocer supported by the local population and the downtown employment base. While
this demand is not sufficient for a large store, it indicates potential for a unique specialty
grocer of up to 20,000 square feet that will fill the niche for fresh, local and organic
foods. Other merchandise/service complements will need to include prepared foods,
ready-to-eat gourmet type means, vitamins and some ethnic foods. Ultimately to
succeed, the store must be a destination for a larger consumer base than the immediate
downtown area. To accomplish that it must provide unique, quality products and a one-
of-a-kind experience in the Roseburg area.
On a practical level, a 20,000 square foot store using grocery industry standard sales/sq.
ft. will need to gross $8 million annually in sales or >$150,000 sales per week. Using an
industry average of $22 per customer transaction that equates to 7,000 transactions
needed per week to achieve this sales level.
Based on the local supply and demand, Market of Choice would be a very good fit for
Roseburg. It offers a mix of health food, vegetarian/vegan options, fresh deli, meats and
fish and conventional items and is competitively priced. While a Roseburg location
should be scaled down from Market of Choice’s largest stores, their specialty offerings,
such as a full kitchen and wine shop, should remain. Evenso, downtown Roseburg does
not have the population density that this operator is most comfortable with. Among its
four Eugene locations, Market of Choice averages 46,000 in a 2-mile radius compared
with 15,000 in a 2-mile radius in downtown Roseburg.
Other potential options to serve Roseburg’s needs include:
• Trader Joe’s-type store, although TJ is not a realistic candidate for Roseburg due to
demographics and density limitations.
• Creation of a cooperative, similar to People’s Co-op and Alberta Co-op in Portland;
and
• Recruitment of a smaller independent entrepreneur, such as Fresh Harvest
Groceries in downtown McMinnville or Lillian’s Natural Marketplace in downtown
Gresham.
City of Roseburg Grocery Market Analysis 18Site/Location Opportunities A downtown Roseburg grocer would require approximately 15,000 to 20,000 square feet of store space and one acre of land. The store would likely be one level, with surface parking for 100 to 120 cars. Good visibility and good traffic counts are key location factors. To accommodate a 20,000 square foot store, the Safeway site is most suitable. The New Day site is also a possibility, as the city owns it and it is in close proximity to downtown employment. However, it is not in as high-traffic a location as the former Safeway. Roseburg is preparing to issue an RFP to developers for the New Day site; if a grocery store were proposed, it would be ideal to also include housing among the uses there. Other potential locations are not as well-suited for a downtown grocer. The former Hansen’s auto dealership site is too large for a stand alone grocery though a store might exist anchoring a larger development. Village Station is problematic due to the railroad. Access to Village Station is also challenging and neither it nor Hansen’s is within walking distance of the majority of downtown’s employee population. Grocery Targets The chart that follows shares market and site preferences for downtown Roseburg’s top grocery targets (Market of Choice and Trader Joe’s) and other comparable specialty grocers with stores in Oregon. City of Roseburg Grocery Market Analysis 19
Figure 8. Grocery Location Preferences, 2011
                      Market of Choice              Trader Joe's           Whole Foods              New Seaons

Company Name         Wright's Foodliner, Inc.       Trader Joe's        Whole Foods Market,      New Seasons Market,
                                                   Company, Inc.                Inc.                    Inc.

Operating Name(s)      Market of Choice             Trader Joe's        Harry's Whole Foods         New Seasons
                                                                           Ideal Market
                                                                        Whole Foods Market
                                                                         Wild Oats Natural
                                                                               Market

Real Estate                Rick Wright            Brandt Sharrock           James Sud              Claudia Knotek
Manager                 282 Willimatte St.      800 S. Shamrock Av e.      550 Bowie St.         2004 N. Vancouv er
                             Suite B            Monrovia, CA 91016        Austin, TX 78703       Ave., Portland, OR
                       Eugene, OR 97405             626.599.3700           512.477.4455                97227
                          541.345.0566                                                              503.292.1987

Stores Operated                 8                        353                     300                     10

Sales (2010)               $65 million               $8.2 million            $8.4 million            $90 million

Preferred GLA (SF)           30,000                8,000 - 15,000          18,500 - 80,000             20,000

Site Requirements              NA                 80 foot frontage               NA                      NA
                                                 65 shared parking
                                                       spaces

Lease                 5 year w/ two 5-year       10 year w/ three 5-    10 year w/ five 5-year           NA
Requirements                 options                year options               options

Market               Core customer is mid- Population of 90,000 Population of 130,000            Middle income with
Requirements          income, advanced in 5 mile radius; Core in 3 mile radius; Core               college degree
                     degree, 45,000 pop in   customer is high-   customer is mid- to
                         2 mile radius*    income and college-    high-income with
                                                educated         advanced college
                                                                       degree

Locations               Community strip            Power center           Community strip           Freestanding
Considered                  center                Community strip              center
                         Freestanding                  center            Neighborhood strip
                                                 Neighborhood strip            center
                                                       center             Mixed-use center
                                                 Pad site/outparcel      Downtown/central
                                                    Freestanding          business district
                                                  College campus            Freestanding

Preferred Co-               Discount               All considered             Upscale                    NA
Tenants

*The population living within a two-mile radius of Market of Choice are: Delta Oaks location - 33,995;
Franklin location - 50,256; Willamette location - 56,822; and Willakenzie location - 41,982. Within a two-
mile radius of downtown Roseburg, there is a population of 14,537.

NA: Not Available

Source: Plain Vanilla Shell, Marketek, Inc.

City of Roseburg Grocery Market Analysis                                                                           20
Marketing Strategy
Timing, preparation and readiness are key elements of successful business
development. The current economic downturn provides Roseburg an opportunity to
organize for marketing to grocers, to polish its downtown image/identity, to package
incentives, prepare available property and promote the natural foods grocery market
opportunity to target prospects. Recommended next steps follow.
Strategy 1: Public-Private Marketing Team
Action Items:
1 Identify a core team of key downtown Roseburg stakeholders who can sell downtown’s
success and the grocery market opportunity. Potential team members include the City,
Main Street, Partnership, banks, Realtor(s) and other private anchors.
2 Meet to share the findings of the downtown grocery market study and discuss roles and
responsibilities of the marketing team. Review marketing recommendations and generate
additional ideas for next steps.
3 Determine who will lead the marketing effort. Schedule a regular meeting time to keep
momentum going for grocery prospecting.
Strategy 2: Downtown Image & Promotion
Action Items:
1 Identify key messages and top 10 reasons for a business to locate in downtown
Roseburg.
2 Ensure the downtown Roseburg website is ready to share with business prospects
interested in grocery and/or other business locations.
3 Develop a schedule of electronic info blasts and press releases about positive
developments and ventures underway in downtown Roseburg and Roseburg in general.
Keep Roseburg ‘top of mind’ in awareness among target prospects and developers.
4 Tie the grocery marketing to downtown business development marketing by developing a
database of key contacts – local and out of area – for promotion of downtown business
and property opportunities.
5 Gather testimonials from downtown businesses and customers about downtown as a
great location. Put on website, in marketing package and e-blasts to prospects.
6 Organize a marketing campaign to demonstrate consumer commitment and support from
residents and employees for a downtown grocery.
City of Roseburg Grocery Market Analysis 21Strategy 3: Incentives
Action Items:
1 Research the range of incentives for business and property development offered by
leading urban renewal agencies in Oregon.
2 Brainstorm all the current and additional potential incentives that the City may be willing to
entertain for business and property development. Among the considerations should be:
land assembly; master planning; property purchases and/or buy-downs/give-aways; tax
abatements; SDC and fee waivers/reductions;; facilitating low-interest loans through the
State and other sources; and provision of infrastructure to the development sites.
3 Determine what incentives are viable from the City, property owners, utilities and others
eager to attract a grocery anchor to downtown.
4 Package the agreed upon incentives for presentation to prospects.
Strategy 4: Property Readiness
Action Items:
1 Meet individually with property owners of top 3 sites for downtown grocery to determine
their interests, their flexibility, willingness to negotiate and ability to get sites ready to
accommodate a grocer.
2 Determine the viability of each site based on sale/lease costs, needed site improvements,
potential financing and related factors. Select the top location and prepare a property
development game plan.
Strategy 5: Recruitment
Action Items:
1 Using the grocery market opportunity factsheet (in Appendix B) as a start, prepare a
simple recruitment folder or package to present to grocers with the key attributes and
selling points of a downtown location.
2 With the public-private ‘sales team’ (from Strategy 1), develop a sales presentation.
3 Invite top grocery prospect(s) to Roseburg for a tour and presentation. Anticipate and
prepare to respond to barriers. Determine level of interest, timing, key requirements and
related information.
4 Debrief and evaluate next steps, including store type most likely to succeed.
5 Network with other Oregon downtown organizations and local/regional small business
development groups to identify grocer entrepreneurs or start-ups that may also be a good
fit for downtown Roseburg. Compile a list, share sales and marketing information, and
make follow-up contact to gage interest and commitment.
City of Roseburg Grocery Market Analysis 22Appendix A.
Market Area Demographic
Data
POPULATION & HOUSEHOLD GROWTH
Downtown and Convenience Markets, Douglas County and State of Oregon
2000-2015
Avg. Ann. Change Avg. Ann. Change
2000-2010 2010-2015
Geographic Area
2000 2010 Number Percent 2015 Number Percent
(Estimate) (Forecast)
Downtown Market Area
Population 5,873 6,048 18 0.30% 6,093 9 0.15%
Households 2,397 2,476 8 0.33% 2,495 4 0.15%
Avg. Household Size 2.31 2.31 0.000 2.31 0.000
Convenience Market Area
Population 50,586 53,924 334 0.66% 54,898 195 0.36%
Households 20,015 21,423 141 0.70% 21,833 82 0.38%
Avg. Household Size 2.47 2.46 -0.001 2.46 0.000
Douglas County
Population 100,399 106,128 573 0.57% 107,777 330 0.31%
Households 39,821 42,331 251 0.63% 43,052 144 0.34%
Avg. Household Size 2.48 2.47 -0.001 2.47 0.000
State of Oregon
Population 3,421,399 3,865,839 44,444 1.30% 4,069,317 40,696 1.05%
Households 1,333,723 1,508,399 17,468 1.31% 1,589,342 16,189 1.07%
Avg. Household Size 2.51 2.51 0.000 2.51 0.000
Average Annual Population Growth Rates, 2000-2015
2.0%
1.5%
1.0%
0.5%
0.0%
Downtown Market Area Convenience Market Douglas County State of Oregon
Area
2000-2010 Avg. Ann. Change 2009-2015 Avg. Ann. Change
Source: ESRI BIS
City of Roseburg Grocery Market Analysis 23HOUSEHOLD INCOME
Downtown and Convenience Markets, Douglas County and State of Oregon
2010
Income Downtown Convenience Douglas State of
Market Area Market Area County Oregon
Less than $15,000 17.5% 12.7% 14.1% 10.6%
$15,000 - $24,999 14.2% 12.5% 13.4% 9.7%
$25,000 - $34,999 11.6% 12.0% 13.2% 9.7%
$35,000 - $49,999 19.8% 18.5% 18.6% 16.5%
$50,000 - $74,999 14.4% 22.2% 21.3% 23.0%
$75,000 - $99,999 14.6% 13.4% 11.8% 14.6%
$100,000 - $149,999 5.0% 6.3% 5.5% 10.7%
$150,000 - $199,999 1.9% 1.3% 1.1% 2.7%
$200,000 or More 1.0% 1.1% 1.0% 2.5%
Total 2,476 21,423 42,331 1,508,399
Median Household Income $38,806 $44,566 $41,287 $53,104
Household Income Distribution, 2010
25%
20%
15%
10%
5%
0%
Less than $15,000 - $25,000 - $35,000 - $50,000 - $75,000 - $100,000 - $150,000 - $200,000 or
$15,000 $24,999 $34,999 $49,999 $74,999 $99,999 $149,999 $199,999 More
Downtown Market Area Convenience Market Area
Douglas County State of Oregon
Source: ESRI BIS
City of Roseburg Grocery Market Analysis 24POPULATION BY AGE
Downtown and Convenience Markets, Douglas County and State of Oregon
2010
Age Category Downtown Convenience Douglas State of
Market Area Market Area County Oregon
Under 5 6.2% 5.8% 5.5% 6.5%
5-14 11.3% 11.9% 11.8% 12.3%
15-19 5.8% 6.3% 6.3% 6.7%
20-24 6.7% 5.3% 5.2% 6.8%
25-34 14.0% 11.3% 10.7% 13.6%
35-44 13.9% 11.8% 11.2% 13.0%
45-54 15.3% 14.9% 15.1% 14.6%
55-64 13.4% 14.8% 15.6% 13.0%
65-74 7.1% 9.2% 9.9% 7.1%
75-84 4.5% 6.0% 6.2% 4.3%
85+ 1.8% 2.7% 2.5% 2.1%
Total 6,048 53,924 106,128 3,865,839
Median Age 39.4 43.2 44.4 38.2
Age Distribution of the Population, 2010
20%
15%
10%
5%
0%
Under 5 5-14 15-19 20-24 25-34 35-44 45-54 55-64 65-74 75-84 85+
Dow ntown Market Area Convenience Market Area
Douglas County State of Oregon
Source: ESRI BIS
City of Roseburg Grocery Market Analysis 25RACIAL & ETHNIC COMPOSITION
Downtown and Convenience Markets, Douglas County and State of Oregon
2010
Race/Ethnicity Downtown Convenience Douglas State of
Market Area Market Area County Oregon
White Alone 91.0% 92.6% 92.3% 82.8%
Black Alone 0.7% 0.4% 0.3% 2.0%
American Indian Alone 1.5% 1.4% 1.7% 1.4%
Asian/Pacific Islander 1.4% 1.2% 1.0% 4.0%
Some Other Race Alone 2.2% 1.5% 1.4% 6.1%
Two or More Races 3.2% 2.9% 3.3% 3.7%
Hispanic Origin (any race) 6.0% 4.7% 4.5% 11.9%
Total 6,048 53,924 106,128 3,865,839
Racial & Ethnic Composition, 2010
100%
80%
60%
40%
20%
0%
White Alone Black Alone American Asian/Pacific Some Other Tw o or More Hispanic
Indian Alone Islander Race Alone Races Origin (any
race)
Downtown Market Area Convenience Market Area
Douglas County State of Oregon
Source: ESRI BIS
City of Roseburg Grocery Market Analysis 26Appendix B. Sample Marketing Sheet City of Roseburg Grocery Market Analysis 27
You can also read


