Formulations 2020: Analysis of total amino acids in rice using a validated reversed-phase high performance liquid chromatographic method with ...
←
→
Page content transcription
If your browser does not render page correctly, please read the page content below
Manuscript                           American Journal of Drug Delivery and Therapeutics                                                              2020
                                                                                                                                                       Vol.7 No.3

Formulations 2020: Analysis of total amino acids in rice using a validated
reversed-phase high performance liquid chromatographic method with
diode array detection (RP-HPLC-DAD) - G.V.V. Liyanaarachchi – University of
Colombo
G.V.V. Liyanaarachchi
University of Colombo, Colombo

Abstract                                                                           HCl solution at the temperature of 110 ᴼC [8,9,13,15] for
Adaptable to any routine laboratory, the study presents the                        extended hours of 24 h or at temperatures above 110 ᴼC for
validation results of a simple, accurate and reliable method                       periods shorter than 24 h [9,16,11]. The hydrolyzed amino
developed for the analysis of total amino acids (TAAs) in rice                     acids are then analyzed using either high performance liquid
using        reversed-phase      high-performance          liquid                  chromatography with ultra violet/visible, diode array or
chromatography-diode array detection (RP-HPLC-DAD).                                fluorescence detection (HPLC-UV/VIS/DAD/FLD) [10-12,16],
Exhibiting excellent selectivity with resolution (Rs) ≥ 2 for                      amino acid analyzers [13,17], liquid chromatography-tandem
seventeen amino acids, the method was proven accurate                              mass spectrometric detection (LC-MS/MS) [14,18,19] gas
against the analysis performed on the certified reference                          chromatography-mass spectrometric detection (GC-MS)
material (CRM): NIST 3233. Percentages of recoveries were in                       [14,19,20] or near-infrared reflectance spectroscopy
the range 86% - 100% with percentage relative standard                             (NIRS)[21].
deviation (% RSD) ≤ 6% for all amino acids. Limit of detection
(LOD) and limit of quantification (LOQ) values were within                         It has been reported that the standard hydrolysis conditions do
0.024-0.069 g/100 g and 0.025-0.078 g/100 g respectively. A                        not guarantee the extraction of all the amino acids, most often
wide working range with satisfactory linearity having                              excluding sulfur containing amino acids and tryptophan [15].
regression coefficients ≥ 0.999 were reported for all the amino                    The studies have further indicated that amino acids analyzed
acids. Complying with international guideline requirements,                        under standard hydrolysis conditions can lead to either
this validated method can be successfully applied for the                          underestimation or over estimation of the actual value
determination of seventeen TAAs including all essential amino                      affecting the reliability of the results produced [15,22]. For
acids in rice.                                                                     example, losses encountered in tryptophan during the acidic
Keywords: Rice, RP-HPLC- DAD, Total amino acids, Validation                        hydrolysis can be overcome by performing the alkaline
                                                                                   hydrolysis during the tryptophan analysis [10,23]. Thus the
1. Introduction                                                                    need for accurate and reliable methods to determine amino
As the dietary staple of more than half of the world population                    acid composition in rice becomes extremely important in
[1], rice (Oryza sativa L.) is recognized as one of the most                       defining its protein characteristics. The characterization of
important cereal crops in the world. Rice significantly                            optimum hydrolysis conditions that produce acceptable
contributes to the daily nutritional requirement as the major                      recoveries for individual amino acids in the matrix assures the
source of energy supply and the protein intake of the Asian                        generation of reliable results. Therefore, evaluation of the
diet [2]. Rice contains an average protein content of 4.5-15.9 %                   method performance characteristics becomes paramount for
[2]. Owing to the changes in the cultivar, environmental                           the generation of accurate results.
conditions, breeding techniques, agricultural practices and
postharvest conditions, significant variations in protein levels                   There are several studies carried out on analysis of amino acids
both qualitatively and quantitatively were observed in rice                        in rice [13,17,24-26] or other cereals [27-29]. However, except
[3,4]. Protein is the second most abundant nutrient present in                     for the study on pseudo-cereals by Mota et al., 2016[11] and
rice which is only next to carbohydrates. Protein plays a                          work by Szkudzinska et al., 2017[30] on rye, none of the work
significant role in determining the nutritional quality,                           described in recent studies outlines a comprehensive
functional properties, texture, pasting capacity and the                           validation study aimed at the evaluation of the method
sensory characteristics of rice [5,6,7]. The determination of                      performance characteristics in analyzing the profile of amino
amino acid composition of rice becomes vital for defining the                      acids in rice or cereal matrices which includes the complete
characteristics related to the protein quality of rice. Several                    profile of essential amino acids. The method developed by
methods for determination of amino acids in rice and other                         Mota et al., 2016[11] has excluded tryptophan analysis, hence
matrices have been discussed in literature [8-14]. In amino                        the complete essential amino acid composition of the cereal
acid analysis, generally proteins are hydrolyzed using 6 mol/L                     matrix was not covered. Further, in their work, the evaluation
This work is partly presented at 23rd International Conference and Exhibition on Pharmaceutical Formulations held on July 27-28, 2020 at Zurich, Switzerland.
Manuscript American Journal of Drug Delivery and Therapeutics 2020
Vol.7 No.3
of method performance characteristics has been performed the two mobile phases which consisted of A(40 mmol/L
based on the analysis of an ephedra containing protein powder Na2HPO4 with pH adjusted to 7.8 using a 10 mol/L sodium
which is a non cereal, hence challenges the validity of the hydroxide solution) and B (45 % acetonitrile, 45 % methanol,
performance evaluation criteria. On the other hand, as done 10 % water).
by Szkudzinska et al.(2017)[30], performance of the method
evaluated based on fortification of amino acids in free form 2.1.2 Grain samples
does not guarantee the actual recoveries that would be The applicability of the method was assessed [31-33] using
obtainable for the protein bound amino acids. Most often seven traditional rice varieties obtained from the regional rice
sulfur containing amino acid analysis, involves an oxidation research and development centers (RRRDCs) located at
step of 16 h prior to hydrolysis [8,9,30]. Batalagoda and Bombuwala in Sri Lanka
Primarily, due to these complexities involved with the 2.2. Sample preparation
hydrolysis and the unavailability of a simple and reliable The unpolished rice samples after finely grinding using a
protein hydrolysis method, amino acid analysis often remains laboratory grinder (IKA-MF 10 basic Microfine grinder drive),
unattempted by most of the analytical laboratories in the were sieved through a 0.3 mm sieve prior to analysis. To 0.2 g
routine framework. In this context, the aim of this study is to of the sieved sample placed inside a screw capped glass tube,
develop and validate a simple, accurate and reliable method 5.00 mL of the hydrolysis mixture (6 mol/L HCl containing 1%
that enables analysis of amino acid composition including all (v/v) thiodiglycol and 1 g of phenol per liter) was added [8] and
essential amino acids in rice with the use of the conventional vortexed for 5 minutes. The vortexed sample was placed inside
laboratory oven and the RP-HPLC-DAD detection making the a drying oven set at 110 ᴼC. During the first hour, in order to
analysis simple and accessible to any routine analytical prevent a building up of pressure (due to the evolution of
laboratory. gaseous substances) and to avoid explosion, the screw cap was
placed over the top of the glass tube without tightening. After
2. Methodology 1 h, the glass tube was closed and left in the oven for 22 h. On
2.1. Materials and Methods completion of the hydrolysis, the glass tube was removed from
2.1.1 Chemicals and reagents the oven and once the mixture reaches the room temperature
The standard reference materials of amino acids; L-aspartic was carefully opened inside an ice-water bath. Initially, the pH
acid (Asp), L-serine (Ser), L-glutamic acid (Glu), L-lysine (Lys), L- of the hydrolyzed mixture was adjusted to around pH to 3
proline (Pro) glycine (Gly), L-histidine (His), L-arginine (Arg), L- using a 10 mol/L sodium hydroxide solution while making sure
threonine (Thr), L-alanine (Ala), L-tyrosine (Tyr), L-valine (Val), that the temperature of the solution was kept below 40 ᴼC.
L-methionine (Met), L-isoleucine (Ile), L-leucine (Leu) and L- The final adjustment of pH to 2.2 was carried out using a 1
phenylalanine (Phe)(Sigma Alrich, Chemicals, St. Louis, MO), mol/L sodium hydroxide solution. Finally the pH adjusted
each of purity > 98% were prepared in 0.1 M HCl solution. Due solution was transferred to a 25 mL volumetric flask and after
to the limited stability in acidic solutions, L-tryptophan (Trp), L- addition of 100 µL of 50 nmol/L of both IS’s L-Nva and L-
theanine and L-norvaline (Nva) were prepared in ultra pure theanine, the resulting solution was made up to the mark with
water and were stored for only two weeks. The certified ultra pure water acidified to pH 2.2 with a 0.01 mol/L HCl
reference material (CRM): NIST 3233 which was a fortified solution.
breakfast cereal was purchased from the National Institute of
Standards and Technology (NIST), USA. L-Theanine (Baxter Since Trp is destroyed during the acid hydrolysis, alkaline
Smith Labs, USA), and L-Norvaline (Sigma Alrich, Chemicals, St. hydrolysis was performed using a 4.2 mol/L NaOH solution
Louis, MO) with purity > 98 % were used as the internal containing 1% (v/v) thiodiglycol for 18 h instead of the acid
standards (ISs). hydrolysis mixture mentioned above. The alkaline mixture
The derivatization of the primary amino acids was carried out resulting from the hydrolysis was adjusted to pH 2.2 with the
using the o-phthalaldehyde 3-mercaptopropionic acid (OPA- use of 6 mol/L HCl solution finally being made up to 25 mL with
MPA) as the derivatizing agent, while the secondary amino ultra pure water acidified to pH 2.2 with a 0.01 mol/L HCl
acid: Pro was derivatized using the 9- solution.
Fluorenylmethoxycarbonyl chloride (FMOC) (Agilent The prepared samples, after filtering through 0.45 µm syringe
Technologies, USA). Other chemicals which were of analytical filter, were injected to the HPLC using automated pre-column
reagent grade and the HPLC grade solvents purchased from derivatization.
Sigma Aldrich were used for the preparation of samples and
This work is partly presented at 23rd International Conference and Exhibition on Pharmaceutical Formulations held on July 27-28, 2020 at Zurich, Switzerland.Manuscript American Journal of Drug Delivery and Therapeutics 2020
Vol.7 No.3
2.3. HPLC analysis observed for the rice cultivars reported at the two locations
The analysis was performed using an Agilent 1100 HPLC were statistically analyzed using ANOVA and Duncan multiple
systems (Agilent Technologies, Palo Alto, CA) which consisted range test.
of a diode array detector (DAD) (G1321A). Pre-column online
derivatization was achieved using the Agilent programmable 3. Results and discussion
auto sampler (G1313A). An Agilent Zorbax Eclipse AAA column The summary of the validation data in terms of accuracy,
with dimensions of (4.6 mm x 150 mm, 5 µm) was used for the selectivity, precision, recovery, limit of detection (LOD), limit of
chromatographic separation. The gradient elution started with determination (LOQ), linearity and measurement uncertainty
100% A for 1.9 min; ramped to 57% B within next 18.1 min; obtained for the studied amino acids are listed in Table 2,
ramped to 100% B in 18.6 min and kept at 100% B till 22.3 min; Table 3 and Table 4.
then ramped to 100% A in 23.2 min and kept with 100 % A till
26 min. The column was operated at 40 °C and the flow rate of 3.1. Accuracy
the method was set at 2 mL/min throughout the runtime [34]. The accuracy was evaluated based on the recovery values
The Zorbax AAA guard columns (4.6 mm x 12.5 mm) were used obtained for the certified reference material (CRM): NIST 3233
to prolong the duration of the analytical column. on breakfast cereals. The acceptance criterion for accuracy was
With the aid of the programmable autosampler and the calculated as per the equation 1 where Ac: Assigned alue of
injector program outlined in Table 1, the automated pre- the certified reference material ( R ) ean alue obtained
column online derivatization with OPA-MPA and FMOC was for the R μ_B^2 Uncertainty associated with the certified
performed prior to the injection of samples to the HPLC [34]. reference alue and μ_D^2 Uncertainty associated with the
The derivatized primary amino acids were monitored at 338 analytical method for the particular analyte respectively. As
nm while the secondary amino acid: Pro was monitored at 262 summarized in Table 2, based on the criterion [35], the
nm using the DAD detector. Agilent Chemstation software method was found accurate for analysis of all the studied
version B.04.03 was used for data acquisition and analysis. amino acids.
Since an assign values for Pro was not available in the CRM,
2.4. Validation of the method accuracy of the analysis was assessed based on the recovery
Validation method was carried out in compliance with the values obtained for the fortified Pro at the middle of the
requirements specified in the international method validation working range.
guidelines [31-33]. The performance characteristics of the
method in terms of accuracy, precision, recovery, selectivity, - ≤ 2√(〖μ_B^2+μ〗_D^2 )
linearity, limit of detection (LOD), and limit of quantification Equation 1
(LOQ) were studied and the applicability of the method was 3.2. Recovery
tested on seven local traditional rice varieties. Recoveries of the amino acids were calculated based on the
The accuracy, precision, recovery and linearity of the method assigned values mentioned for the certified reference material
were evaluated based on the results obtained after the (CRM): NIST 3233 on breakfast cereals. Since a value was not
analysis of the certified reference material (CRM): NIST 3233 assigned for Pro in the CRM, recovery of Pro was calculated
on breakfast cereals in six replicates. based on the fortification of Pro to the rice matrix at the mid
In the absence of a matrix material free of amino acids, the level of the working range.
determination of LOD and LOQ values were performed using During the acid hydrolysis, Trp is entirely destroyed while Gln
six replicate analysis performed on the blank samples fortified and Asn are completely oxidized to Glu and Asp respectively.
at lowest quantifiable limits. However, inclusion of 1% (w/v) phenol as a protective agent in
the hydrolysis mixture significantly reduced the loss of
2.5. Statistical analysis recoveries of the sensitive amino acids such as Met, Ser, Thr
The statistical analysis was performed using the statistical and Tyr [9]. Base hydrolysis aided optimum recovery for Trp
software package, SAS for Windows V 9.1 (SAS Institute Inc., which is 98%. Therefore, the overall mean recoveries obtained
NC, USA). The level of significance was p < 0.05. Based on the for the studied amino acids as given in the Table 3 were in the
percentage relative standard deviations (% RSD), intra and range 86% - 100%. Except for Tyr, Val, Lys, Pro, Arg and Met,
inter day precision and recovery values were evaluated. The the recoveries for rest of the amino acids were within the
estimation of the expanded uncertainty was evaluated at 95% accepted values for recovery for the specified analyte
confidence level including the factors contributing from concentration levels recommended by the FDA Guidelines for
repeatability, reproducibility and regression. The TAAs
This work is partly presented at 23rd International Conference and Exhibition on Pharmaceutical Formulations held on July 27-28, 2020 at Zurich, Switzerland.Manuscript American Journal of Drug Delivery and Therapeutics 2020
Vol.7 No.3
the validations of Chemical Methods for the Foods Program The calibration range consisted of seven calibration levels at
[31]. 25 50 100 250 500 1000 and 2000 μmol/L. The linear
regression line was constructed using the peak area ratio of
3.3. Selectivity standard to IS at each concentration level. The regression
The selectivity was assured based on the relative retention coefficients obtained for all amino acids analyzed (R2) were ≥
times calculated with reference to the respective IS obtained 0.999. Hence, excellent linearity is demonstrated in the
for amino acids in the sample to those obtained for amino acid method over a wide working range as given in the Table 4. This
reference standards. For polar amino acids, theanine was enables the analysis of amino acids levels which are generally
considered as the IS while non polar amino acids were present in rice and other cereals in different levels in a single
normalized against the IS: norvaline. run.
A minimal difference of ± 0.1 % of relative retention times
obtained for the amino acids in spiked matrices against the 3.7. Measurement uncertainty
reference standards injected in blank solutions were The measurement uncertainty for each amino acid was
considered acceptable. The resolution factors (Rs) calculated calculated by considering the uncertainty contribution arising
for all the amino acids were greater than 1 with the lowest Rs from repeatability, regression, standard preparation and
value of 2 obtained for Gly/Thr and Phe/Ile pairs (Table 3), sample preparation of the method [37].
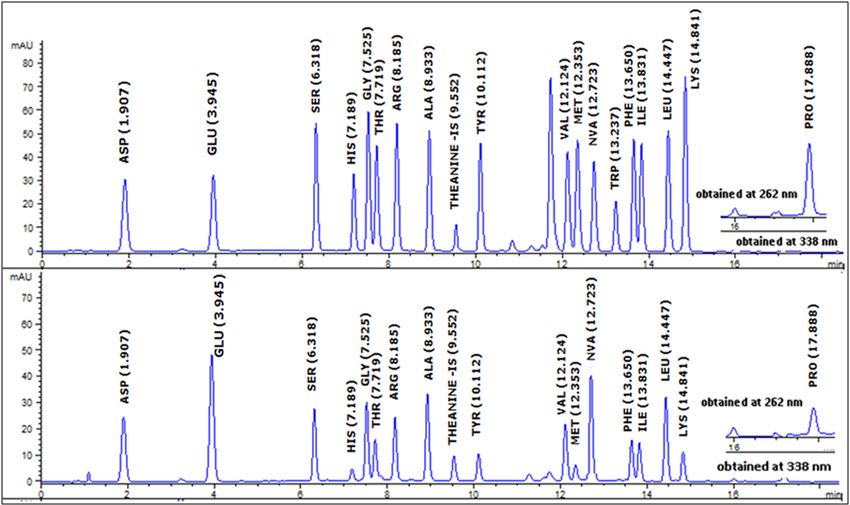
where generally Rs ≥ 2 is regarded adequate [36]. signifying The percentage expanded uncertainties for each amino acid,
excellent resolution which indicates better selectivity for all with a co erage factor of 2 (k=2) were ≤ 7% for all the amino
the analytes of interest as given in the Figure 1. acids analyzed as given in Table 4. Except for Val and Met,
Szkudzinska et al., 2017 [30] reports uncertainties of similar
3.4. Precision magnitude in their method on amino acid analysis.
The precision of the method was measured under repeatable The uncertainties associated with the repeatability of the
conditions on six replicate analyses of the CRM on the same method and the regression analysis involved in the calibration
day while the intermediate precision was calculated based on step mainly constituted the percentage uncertainty, while the
six replicate analysis carried out on the CRM sample by uncertainty associated with the preparation of the calibration
different analysts on different days over an extended period of standards and preparation of samples made up the remainder.
three months.
The intermediate precision in analysis of each amino acid in 3.8 Amino acid composition in rice samples
the method (% RSD) was ≤ 6 % (Table 4). These RSD alues are The Table 5 and Table 6 summarize the composition of TAAs
well in compliance with the recommended RSD for the determined using the validated method in seven rice varieties
particular analytical range which is 6% as specified in the AOAC cultivated in two locations in the country. As per the
guideline on Method validation [33]. composition, Glu was the major amino acid present while Asp,
Ala, Val, Gly and Leu levels also found in comparatively higher
3.5. Limit of detection and limit of quantification levels. Further, compared to the other analyzed amino acids,
The LODs and the LOQs were calculated considering the mean Trp, Met and His were found in relatively lesser quantities. In
and the standard deviation (SD) of the values obtained for the literature, several studies report similar compositions of Glu,
analyzed blank samples fortified at the lowest detection levels. Asp and Val in rice [13,17,24,25]. However, in comparison to
The values were calculated by adding to the mean value, 3 those studies, relatively higher levels of Ala and Gly have been
times of the SD for LOD while 5 times of the SD values for LOQ reported in the local traditional varieties.
respectively [32]. The LODs and the LOQs for the method were When these data were statistically investigated using the
in the range 0.024 - 0.069 g/100g and 0.025 - 0.078 g/100g Duncan Multiple Range Test it was revealed that there were
respectively allowing high sensitivity in detection of amino significant variations (pManuscript American Journal of Drug Delivery and Therapeutics 2020
Vol.7 No.3
varied between the two locations. Except for His, Tyr, Met and Table 2: Accuracy of amino acid analysis
Pro, the interaction between cultivar (c) and the location (l), (c Am
A G S H G T A A T V M T P I L L
x l) was found significant for all the investigated amino acids, ino
s l e i l h r l y a e r h s e y
emphasizing the significance of impact of variety and the aci
p u r s y r g a r l t p e e u s
geographical conditions on the amino acid composition of rice. d
Studies have revealed that, with increasing temperatures of Ac 0 0 0 0 0 0 0 0 0 0 0 0 0 0 0
2
the environment, notable decrease in protein yield and amino (m/ . . . . . . . . . . . . . . .
.
acid content in rice [38] and protein content in wheat [39] m% 4 3 1 3 2 3 3 2 3 1 0 3 2 5 1
2
have been reported. In addition, similarly as observed with this ) 3 7 6 4 4 2 2 3 4 3 9 7 7 5 0
5
study, Oh et el (2019)[40] has pointed out that the amino acid 8 5 2 2 1 2 3 1 3 9 2 3 0 0 3
composition is significantly affected by the rice variety and the 0 0 0 0 0 0 0 0 0 0 0 0 0 0
0 0
location of cultivation. Therefore, these findings emphasize the - . . . . . . . . . . . . . .
. .
significance of further investigations in this direction involving Ac 0 0 0 0 0 0 0 0 0 0 0 0 0 0
0 0
harmonization of genetic facts and agro climatic practices in 2 5 1 0 3 1 3 3 1 0 1 1 4 1
2 1
breeding techniques for development of rice crops with 6 8 4 8 2 9 1 0 8 2 6 3 0 5
optimum nutritional quality. 0 0 0 0 0 0 0 0 0 0 0 0 0 0 0 0
√
. . . . . . . . . . . . . . . .
0 1 0 0 0 0 0 0 0 0 0 0 0 0 0 0
4 7 5 2 2 1 5 3 4 3 1 2 2 1 4 3
2 2 1 7 7 4 4 4 6 0 8 8 8 9 0 6
Acc
Y Y Y Y Y Y Y Y Y Y Y Y Y Y Y Y
ept
e e e e e e e e e e e e e e e e
anc
s s s s s s s s s s s s s s s s
e
Ac : Assigned value of the certified reference material (CRM)
: Mean value obtained for the CRM
: Uncertainty associated with the certified reference value
: Uncertainty associated with the analytical method for
the particular analyte
Acceptance criteria: - Ac ≤ √
4. Conclusion
ASP: Aspartic acid GLU:Glutamicacid The study presents the validation data of a quantitative
SER: Serine HIS: Histidine method for analysis of amino acids in rice using reversed phase
GLY: Glycine THR: Threonine HPLC with diode array detection. The validated method is
ARG: Arginine ALA: Alanine accurate, precise and complies with the acceptance criteria
TYR: Tyrosine VAL: Valine required in the method validation guidelines. Hence, the
MET: Methionine TRP: Tryptophan method will serve as a reliable tool to evaluate the amino acid
PHE: Phenylalanine ILE: Isoleucine composition in rice and other cereal matrices to evaluate its
LEU: Leucine NVA: Norvaline nutritional value in terms of protein quality and for future
LYS: Lysine PRO: Proline investigation on breeding related to improvement of protein
IS: Internal standard quality of cereal crops.
Figure 1: Amino acid profile of a) standards mixture, b) rice
sample Acknowledgements
This study was supported by the Sri Lanka Treasury (TG
18/165). The authors gratefully thank the Industrial
Technology Institute for the assistance in this research and rice
This work is partly presented at 23rd International Conference and Exhibition on Pharmaceutical Formulations held on July 27-28, 2020 at Zurich, Switzerland.Manuscript American Journal of Drug Delivery and Therapeutics 2020
Vol.7 No.3
research development centers (RRDCs) at Batalagoda and tandem mass spectrometry: implications for the diagnosis of
Bombuwala of Sri Lanka for providing rice samples. argininosuccinic aciduria. Clin Chim Acta. 442: 73–74.
15. DE Otter (2012) Standardised methods for amino acid
5. References analysis of food, The British J Nutr 108, Suppl 2:S230-7.
1. SS Gnanamanickam (2009) Biological Control of Rice 16. R Dave, RD Tripathi, S Dwivedi, P Tripathi, G Dixit, YK
Diseases: Rice and Its Importance to Human Life. Springer, Sharma, PK Trivedi, FJ Corpas, JB Barroso, D Chakrabarty
USA. (2013) Arsenate and arsenite exposure modulate antioxidants
2. G Kennedy, B Burlingame (2003) Analysis of food and amino acids in contrasting arsenic accumulating rice
composition data on rice from a plant genetic resources (Oryza sativa L.) genotypes. J Hazard Mater 262: 1123– 1131.
perspective. Food Chem 80: 589–596. 17. H Ning, J Qiao, Z Liu, Z Lin, G Li, Q Wang, S Wang, Y Ding
3. JS Kamara, S Konishi, T Sasanuma, T Abe (2010) Variation in (2010) Distribution of proteins and amino acids in milled and
free amino acid profile among some rice (Oryza sativa L.) brown rice as affected by nitrogen fertilization and genotype. J
cultivars. Breed. Sci. 60: 46–54. Cereal Sci 52:90–95.
4. DK Verma, PP Srivastav (2017) Proximate composition, 18. DJ Dietzen, AL, Weindel, MO Carayannopoulos, M Landt, ET
mineral content and fatty acids analyses of aromatic and non- Normansell, TE Reimschisel, CH Smith (2008) Rapid
aromatic Indian rice. Rice Sci 24: 21–31. comprehensive amino acid analysis by liquid
5. BG Lyon, ET Champagne, BT Vinyard, WR Windham, FE chromatography/tandem mass spectrometry: comparison to
Barton, BD Webb, AM McClung, KA Moldenhauer, S cation exchange with post-column ninhydrin detection. Rapid
Linscombe, KS McKenzie, DE Kohlwey (1999) Sensory Quality Commun Mass Spectrom 22: 3481-3488.
of ooked Long‐Grain Rice as Affected by Rough Rice oisture 19. K Dettmer, AP Stevens, SR Fagerer, H Kaspar, PJ Oefner
Content, Storage Temperature, and Storage Duration. Cereal (2012) Amino Acid Analysis in Physiological Samples by GC–MS
Chem 76 (1): 56-62. with Propyl Chloroformate Derivatization and iTRAQ–LC–
6. M Martin, MA Fitzgerald (2002) Proteins in Rice Grains MS/MS. Methods Mol Biol 828: 165-181.
Influence Cooking Properties!. J Cereal Sci. 36(3): 285-294. 20. WP Chen, XY Yang, AD Hegeman, WM Gray, JD Cohen
7. L Xie, N Chen, B Duan, Z Zhu, X Liao (2008) Impact of (2010) Microscale analysis of amino acids using gas
proteins on pasting and cooking properties of waxy and non- chromatography–mass spectrometry after methyl
waxy rice. J Cereal Sci. 47 (2): 372-379. chloroformate derivatization. J Chromatogra B 878: 2199-
8. ISO 13903: 2005 Animal feeding stuffs — determination of 2208.
amino acids content. 21. B Zhang, ZQ Rong, Y Shi, JG Wu, CH Shi (2011) Prediction of
9. M Fountoulakis, H Lahm (1998) Review on Hydrolysis and the amino acid composition in brown rice using different
amino acid composition analysis of proteins. J Chromatogra. A sample status by near-infrared reflectance spectroscopy. Food
826: 109–134. Chem 127(1): 275–281.
10. SA Cevikkalp, GB Loker, M Yaman, B Amoutzopoulos (2016) 22. SM Rutherfurd, BM Dunn (2011) Quantitative Amino Acid
A simplified HPLC method for determination of tryptophan in Analysis. Curr Protoc Protein Sci 63: 1–6.
some cereals and legumes, Food Chem. 193: 26-29. 23. HK Nielsen, RF Hurrell (1985) Tryptophan Determination of
11. C Mota, M Santos, R Mauro, N Samman, A Sofia, D Torres, I Food Proteins by h.p.1.c. after Alkaline Hydrolysis ". J Sci Food
Castanheira (2016) Protein content and amino acids profile of Agric 36: 893-907.
pseudocereals. Food Chem. 193: 55–61. 24. A Rita, F Roberta, B Remo, R Mena, M Flavio (2009)
12. P Pal, P Kaur, N Singh, AP Kaur, NN Misra, BK Tiwari, PJ Nutritional and Physicochemical Characterization of Italian
Cullen, AS Virdi (2016) Effect of nonthermal plasma on Rice Flours and Starches. Food Sci Technol Res 15: 507–518.
physico-chemical, amino acid composition, pasting and protein 25. EJ Park, JW Chung, YJ Park, IM Chung, JK Ahn, GH Kim
characteristics of short and long grain rice flour, Food Res Int (2009) Association Analysis of the Amino Acid Contents in
81: 51-57. Rice. J Integr Plant Biol 51(12): 1126-1137.
13. K Liu, J Zheng, F Chen (2017) Relationships between degree 26. F Tanaka, F Tanaka, A Tanaka, T Uchino (2017) Effect of
of milling and loss of Vitamin B, minerals, and change in amino high temperature drying on amino acid decomposition in feed
acid composition of brown rice, LWT-Food Sci Technol 82: rice. Eng. Agric. Environ. Food 10(1): 1-3.
429–436. 27. J Xiao-ling, T Ji-chun, HA, Zhi, Z Wei-dong, Z. (2008).
14. I De Biase, A Liu, T Yuzyuk, N Longo, M Pasquali (2015) Protein Content and Amino Acid Composition in Grains of
Quantitative amino acid analysis by liquid chromatography- Wheat-Related Species. Agric Sci China 7(3): 272-279.
This work is partly presented at 23rd International Conference and Exhibition on Pharmaceutical Formulations held on July 27-28, 2020 at Zurich, Switzerland.Manuscript American Journal of Drug Delivery and Therapeutics 2020
Vol.7 No.3
28. MS Khan, E Ali, S, Ali, WM Khan, MA Sajjad, F Hussain
(2014) Assessment of essential amino acids in wheat proteins
a case study. J Environ Biol 4: 185–189.
29. L Vilmane, S Zute, E Straumîte, R Galoburda (2015) Protein
, amino acid and gluten content in oat ( Avena sativa L .) grown
in Latvia. Proceedings of the Latvian academy of sciences. 69:
170–177.
30. K Szkudzinska, I Smutniak, J Rubaj, W Korol, G Bielecka
(2017) Method validation for determination of amino
acids in feed by UPLC. Accredit Qual Assur 22: 247–252.
31. FDA Guidelines for the Validation of Chemical Methods for
the FDA Foods Program: 2012, US Food and Drug
Administration.
32. Eurachem guide: 2014 The Fitness for Purpose of Analytical
Methods; A Laboratory Guide to Method Validation and
Related Topics.
33. AOA Official methods of Analysis Appendix F 2016
Guidelines for Standard Method Performance Requirements.
34. JW Henderson, RD Ricker, BA Bidlingmeyer, C Woodward
(2000) Rapid, Accurate, Sensitive, and Reproducible HPLC
Analysis of Amino Acids and the Agilent 1100 HPLC.
35. R Sutarno, HF Steger (1985) The use of certified reference
materials in the verification of analytical data and methods,
Talanta 32(6): 439-445.
36. P Ravisankar, CN Navya, D Pravallika, DN Sri (2015) A
Review on Step-by-Step Analytical Method Validation. IOSR J
Phar 5: 7–19.
37. JCGM 100: (2008) GUM 1995 with minor corrections.
Evaluation of Measurement Data-Guide to Expression of
Uncertainty in Measurement. JCGM.
38. M Huang, H Zhang, C Zhao, G Chen, Y Zou (2019) Amino
acid content in rice grains is affected by high temperature
during the early grain-filling period. Sci Rep 9: 2700.
39. J Wang, T Hasegawa, L Li, SK Lam, X Zhang, X Liu, G Pan
(2018) Changes in grain protein and amino acids composition
of wheat and rice under short-term increased [ CO 2 ] and
temperature of canopy air in a paddy from East China. New
Phytol 222: 726–734.
This work is partly presented at 23rd International Conference and Exhibition on Pharmaceutical Formulations held on July 27-28, 2020 at Zurich, Switzerland.You can also read