Spectrogram-based Efficient Perceptual Hashing Scheme for Speech Identification
←
→
Page content transcription
If your browser does not render page correctly, please read the page content below
International Journal of Network Security, Vol.21, No.2, PP.259-268, Mar. 2019 (DOI: 10.6633/IJNS.201903 21(2).10)   259

 Spectrogram-based Efficient Perceptual Hashing
        Scheme for Speech Identification
                       Qiu-Yu Zhang, Tao Zhang, Si-Bin Qiao, and Dong-Fang Wu
                                         (Corresponding author: Qiu-Yu Zhang)

                    School of Computer and Communication, Lanzhou University of Technology
                               No.287, Lan-Gong-Ping Road, Lanzhou 730050, China
                                           (Email: zhangqylz@163.com)
                          (Received Sept. 19, 2017; revised and accepted Mar. 27, 2018)

Abstract                                                     guarantee speech information services more safe and re-
                                                             liable [2, 4]. So, this technology is recently receiving big
In order to meet the requirements of discrimination, attention in the area of research.
robustness and high-efficiency identification of existing
                                                                A lot of spectrogram-based audio fingerprinting algo-
speech identification algorithms in mobile speech commu-
                                                             rithms have been proposed in recent year. Rafii et al. [12]
nication, an efficient perceptual hashing scheme based on
                                                             proposed an audio fingerprinting system to handle differ-
spectrogram for speech identification was proposed in this
                                                             ent kinds of live version audio, and the fingerprinting is
paper. Firstly, a fraction of spectrogram is cut, which rep-
                                                             extracted from a binary image, which is obtained from a
resents low frequency information of input speech signal
                                                             log-frequency spectrogram by using an adaptive threshold
and is less susceptible to common content-preserving ma-
                                                             method. Though the system shows a good identification
nipulations such as MP3 compression, noise addition and
                                                             precision to different genres of live music, its robustness
volume adjustment etc. Secondly, the local binary pattern
                                                             is not illustrated in detail. To satisfy robustness of audio
(LBP) algorithm is applied to produce a LBP feature im-
                                                             fingerprinting system, Zhang et al. [15] proposed a feature
age. Finally, the perceptual hashing sequence is obtained
                                                             extracting method based on spectrogram through utiliz-
by employing an image perceptual hashing algorithm to
                                                             ing scale invariant feature transform (SIFT) local descrip-
the LBP feature image. Experimental results show that
                                                             tor and the locality sensitive hashing (LSH). Due to the
the proposed approach has a good discrimination, robust-
                                                             stability of SIFT, the proposed algorithm achieves a high
ness and identification efficiency. It can satisfy the real-
                                                             discrimination and robustness, but its time complexity is
time identifying requirements in mobile speech communi-
                                                             high. Being similar to [15], SIFT is employed to extract
cation.
                                                             128 features of spectrogram in [16]. Experimental results
Keywords: Entropy Rate; LBP; Perceptual Hashing; show that the system has a good identification rates when
Spectrogram; Speech Identification                           the audio lengths are stretched from 65% to 150%. How-
                                                              ever, due to use Euclidean distance to match the features
                                                              of 128-dimension descriptors, it is still time-consuming.
1    Introduction
                                                                  Besides there are a few audio fingerprinting algorithms
With the development of multimedia technology and net-        based on the feature of spectrogram, some audio percep-
work communication technology, the transmission and           tual hashing algorithms with respect to other features
storage of speech information become more and more            have been proposed. Chen et al. [3] introduced an audio
convenient. However, some speech information contains         perceptual hashing algorithm based on Zernike moment.
much private information, such as court testimony and         Experiment results show that the algorithm achieves a
military order. Therefore, validating their authenticity      good discrimination and perceptual robustness. However,
becomes a critical issue to multimedia identification tech-   generating hashing process in his paper takes too much
niques [5].                                                   time. Huang et al. [6] proposed a speech perceptual hash-
   Traditional cryptography hashing algorithms are very       ing algorithm based on linear prediction analysis, which
sensitive to the changes of speech content because of in-     has a high running efficiency but not a good robustness.
troducing some distortions while processing speech sig-       Li et al. [9] introduced a hashing generating approach by
nal, such as resample and compression, which have an          utilizing the correlation of Mel-frequency cepstrum coeffi-
adverse effect on speech content identification. Speech       cients (MFCC). Instead of traditional hamming distance,
perceptual hashing identification technologies can protect    it takes advantage of similarity metric function to imple-
speech information by verifying its authenticity, which can   ment hashing matching and shows a good robustness to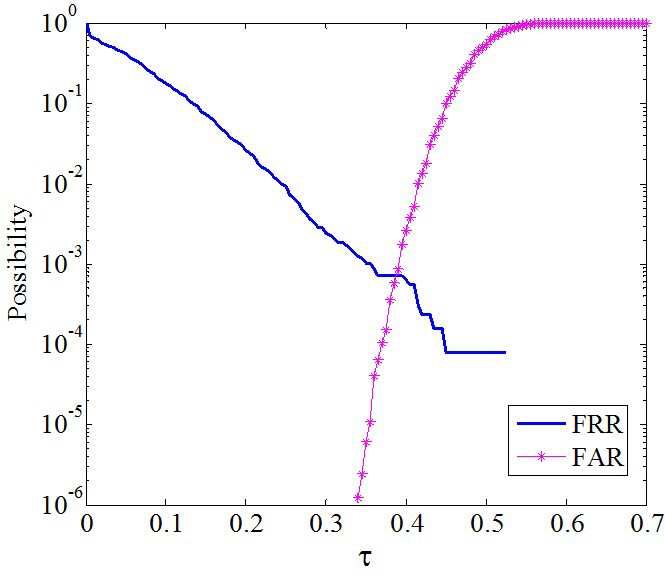
International Journal of Network Security, Vol.21, No.2, PP.259-268, Mar. 2019 (DOI: 10.6633/IJNS.201903 21(2).10)           260

re-sampling and MP3 compression. However, the algo-            mainly introducing three theories, including LBP descrip-
rithm is computationally expensive. In [8], the combina-       tor, 2D-DCT and SVD, which will be exploited in this
tion of modified discrete coefficients transform (MDCT)        paper. The detailed proposed algorithm is described in
and non-negative matrix factorization (NMF) is consid-         Section 3. Subsequently, Section 4 gives the experimental
ered as a hashing yielding scheme. It exhibits a good          results and performance analysis as compared with other
robustness but a poor discrimination. To develop an effi-      related methods. Finally, we conclude our paper in Sec-
cient speech identification system, Zhang et al. [14] pro-     tion 5.
posed a speech perceptual hashing algorithm in terms of
discrete wavelet packet decomposition (WPD). Although
the system can discriminate different speech files, it lacks
robustness in the noisy environment. By exploiting lin-        2     Problem Statement and Prelim-
ear prediction coefficients (LPC) of speech signal to ob-            inaries
tain local features, Chen et al. [1] proposed a robust hash
function, which gains a better discrimination but has poor
effect to resist some speech content-preserving distortions,   2.1     LBP Descriptor
such as filtering and noise addition.
    Aiming at the problems mentioned above, obtaining          LBP [13] is an effective image texture description method.
a compromise between discrimination and robustness of          Owing to having some characteristics, such as simple cal-
algorithm, and meeting the requirement to enhance iden-        culation, rotation and gray invariance, LBP is applicable
tification efficiency, we proposed an efficient speech per-    to real-time system. The method is described briefly as
ceptual hashing identification algorithm based on spectro-     follows: a central pixel point ic is defined in a local 3×3
gram. Firstly, a spectrogram produced by a 4 s original        neighborhood of a monochrome texture image. Next, ic is
speech is obtained like Figure 1(a). Figure 1(b) is a spec-    in comparison with one of the joint 8 pixel values in (i=1,
trogram of the original speech signal contaminated by 30       2, . . . , 8), if ic is less than in, bn is set to 1, otherwise to
dB white Gaussian noise. Through comparing Figure 1(a)         0 (see Equation(1)). Equation (2) is utilized to get final
with Figure 1(b), it is obvious that noise has little influ-   LBP code values.
ence on low frequency portion (namely the bottom half of
the spectrogram), then, which is cut to get Figure 1(c). In                                        1    in − ic > 0
                                                                                     bn    =                                 (1)
addition, Figure 1(c) is converted to acquire a feature im-                                        0    otherwise
age (Figure 1(d)) by using LBP algorithm. As can be seen                                       7
                                                                                               X
from Figure 1(d), most of textural features are extracted.                LBP (xc , yc )   =         2n bn .                 (2)
Lastly, an image perceptual hashing algorithm proposed                                         n=0
in [7] is applied to get hashing sequences of LBP feature
image, and which are matched to finish speech identifi-        In this paper, LBP descriptor is used to extract texture
cation. The experimental results demonstrate that the          information of spectrogram.
proposed algorithm can satisfy the real-time need of mo-
bile speech communication.
                                                               2.2     Two-Dimensional Discrete                       Cosine
                                                                       Transform (2D-DCT)
                                                          Discrete Cosine Transform (DCT) [11] is used to approx-
                                                          imate to an image via different amplitude and frequency.
                                                          Two-dimensional discrete cosine transform (2D-DCT) can
                                                          be obtained by computing twice one-dimensional DCT in
                                                          the two directions of row and column. 2D-DCT is fre-
                                                          quently applied in image processing since it is charac-
                                                          terized by lossless compression and energy concentration.
                                                          Generally, after 2D-DCT, the main energy of an image is
                                                          concentrated in the part of low frequency, which is located
                                                          in top left corner of a 2D-DCT coefficient matrix and rep-
                                                          resenting the stable features of an image. The definition
Figure 1: Spectrogram analysis: (a) Spectrogram of an
                                                          of 2D-DCT is as follows:
original 4 s speech clip; (b) Spectrogram of adding 30 dB
noise to original speech; (c) An image of being cut out                                       M −1 N −1
from (a); (d) LBP feature image of (c)                                          2             X    X
                                                              D(u, v) = √            c(u)c(v)           f (x, y)    (3)
                                                                               MN             x=0 y=0
   The remaining part of this paper is organized as fol-                             (2x + 1)uπ          (2y + 1)vπ
lows. Section 2 does several preliminaries, which are                            cos             × cos
                                                                                         2M                  2N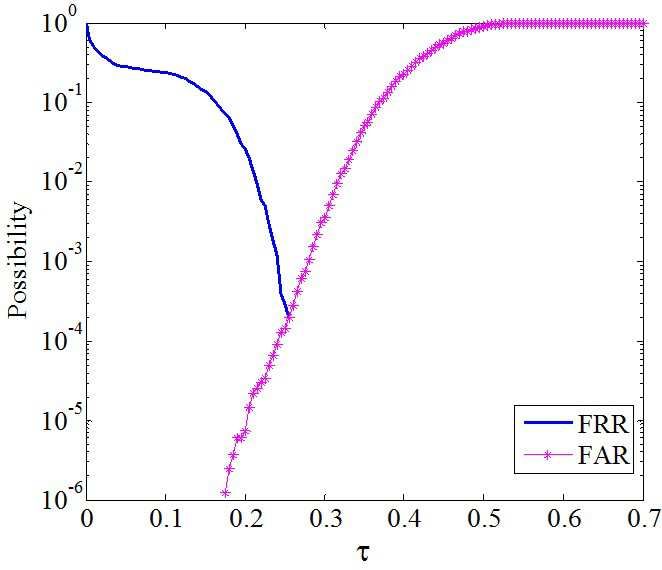
International Journal of Network Security, Vol.21, No.2, PP.259-268, Mar. 2019 (DOI: 10.6633/IJNS.201903 21(2).10) 261
The 2D-DCT inverse transform is given by: of speech signal is vulnerable to some distortions, so an
image block representing low frequency portion of input
M −1 N −1
2 X X speech signal is cut out. Next, by using LBP method, the
f (x, y) = √ c(u)c(v)D(u, v) (4) image block is extracted texture features to gain a LBP
M N u=0 v=0
feature image. Subsequently DCT coefficient matrix is
(2x + 1)uπ (2y + 1)vπ obtained by utilizing 2D-DCT to the LBP feature image.
cos × cos
2M 2N It is divided into many smaller matrices with the same
where D(u, v) is a 2D-DCT transform coefficient matrix, size, and some of them representing low frequency part
the size of input digital image f (x, y) is M ×N , 0 ≤ x ≤ of LBP feature image are recombined into a new matrix.
M −1, 0 ≤ y ≤ N −1, 0 ≤ u ≤ M −1, 0 ≤ v ≤ N −1, c(u) Finally, after doing SVD to it, a hash sequence is derived.
and c(v) are transform parameters and their values are
defined as follows:
√
1/ 2 u, v = 0
c(u), c(v)= (5)
1 otherwise
In this paper, 2D-DCT is utilized to extract the low fre-
quency energy of LBP feature image.
2.3 Singular Value Decomposition
Singular value decomposition (SVD) [10] is a method
of algebraic feature extraction and numerical analysis.
Thanks to the stability of singular value, it is widely ap-
plied in the field of image compression and digital water-
mark. Supposing A is a M × N gray image. The SVD Figure 2: Block diagram of speech perceptual hashing
transform of A is given by: identification algorithm
r
X
A = U SV T = λi ui viT (6)
i=1
where U and V are M×M and N×N orthogonal matrices
respectively, S is a M ×N matrix. λ is singular value of
A and satisfies Equation (7). r is the number of non-zero
singular value. ui and vi are left singular vector and right
singular vector corresponded by λi .
λ1 ≥ λ2 ≥ · · · λr = · · · = λM (7)
In this paper, SVD is performed to the 2D-DCT low
frequency coefficient matrix for obtaining the left singu-
lar vector and right singular vector corresponded by the
biggest singular value.
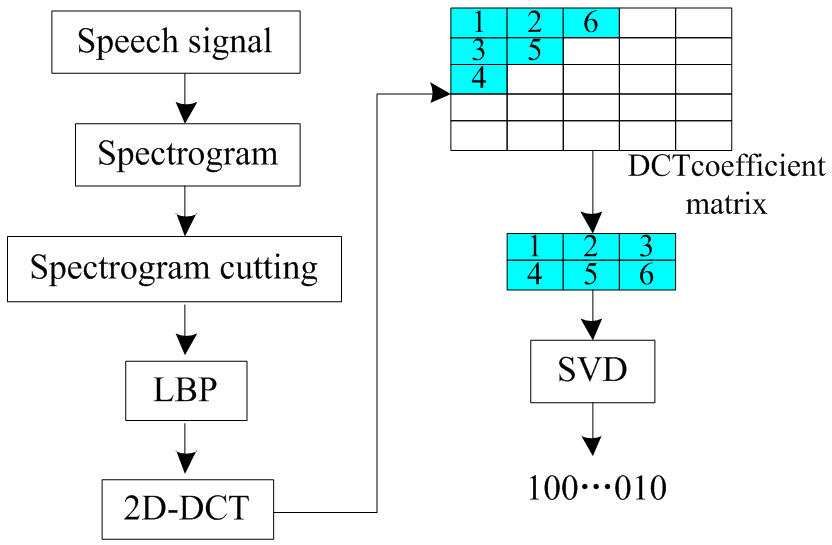
Figure 3: Block diagram of hashing generation of input
speech signal
3 The Proposed Scheme
The two principal components of speech identification
system are hashing generation and hashing matching,
and the procedures of proposed perceptual hashing al-
3.1 The Process of Hashing Generation
gorithm are shown in Figure 2. The whole steps of the
algorithm are depicted as follows: an input speech sig- Assuming the original speech signal is s, the steps of hash-
nal yields a hashing sequence, which is matched with ing generation are depicted as follows:
other hashing sequences that are stored in a reference
hashing database. And matching results are analyzed Step 1: Short Time Fourier Transform (STFT) is used
to identify input speech content. The specific hashing to obtained the spectrogram of s, which in matrix
generation process can be seen from Figure 3. Firstly, form is Si = {Si (k) | i = 1, 2, . . . , M, k = 1, 2, . . . , L},
one-dimensional speech signal is converted to a two- where M and L represent the number of rows and
dimensional spectrogram, due to the high frequency part columns of the matrix, respectively.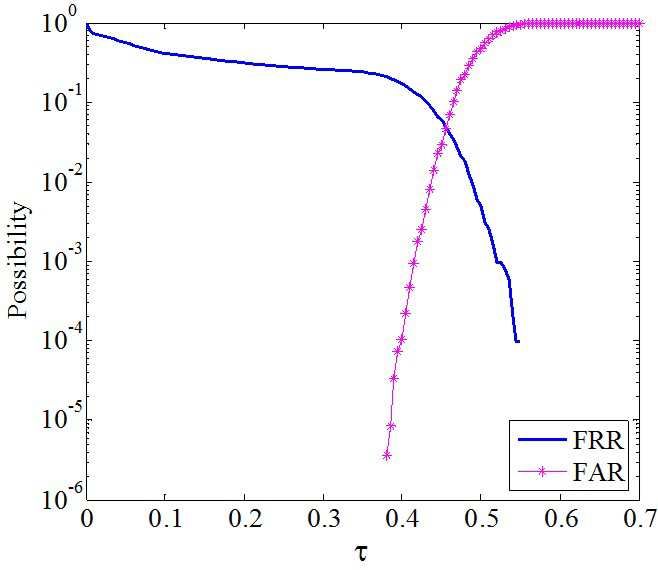
International Journal of Network Security, Vol.21, No.2, PP.259-268, Mar. 2019 (DOI: 10.6633/IJNS.201903 21(2).10)          262

Step 2: Cutting the spectrogram which represents the             In order to estimate the performance of whole per-
    low frequency part of s, expressed as Csi = Si , ceptual hashing system, a statistical hypothesis testing
    where, i = 1, 2, . . . , N , and N is the number of rows method is defined as follows:
    after Si is cut.                                             Given two randomly selecting speech clips s1 and s2
                                                                 H0 : if s1 and s2 are same two perceptual contents,
Step 3: The LBP is performed on Cs to obtain a M1×N1
    LBP feature image L(m, n). where M1 and N1 are
                                                                                     BER ≤ τ
    the number of rows and columns of L(m, n) and m =
    1, 2, . . . , M1 , n = 1, 2, . . . , N1 .
                                                                 H1 : if s1 and s2 are two different perceptual contents,
Step 4: The 2D-DCT is performed on L(m, n) to obtain
    a 2D-DCT coefficient matrix D(m, n). In order to                                 BER > τ
    extract its top-left-corner low frequency energy con-
    veniently, it is divided into 25 same-sized p×q matrix where τ is perceptual threshold. By setting a reasonable τ
    blocks Ψi,j (p, q), and some of them representing low and computing BER of two clips s1 and s2 , if BER≤ τ , the
    frequency energy of L(m, n) are recombined to derive two clips can be treated as same two perceptual contents,
    a new matrix C, which is shown as follows:                identification is passed, otherwise not passed.

                           Ψ1,1 Ψ1,2 Ψ2,1
                   C=                                     (8)
                           Ψ3,1 Ψ2,2 Ψ1,3
                                                                4     Experimental Results and Anal-
    where, i and j are block position indices of 2D-
    DCT block matrix, and each block has p rows and
                                                                           ysis
    q columns. In this paper, i = 1, 2, . . . , 5, j =
                                                                     In this section, the performance of the proposed algorithm
    1, 2, . . . , 5, p = 1, 2, . . . , 6, q = 1, 2, . . . , 74.
                                                                     will be evaluated. The experimental speech data comes
Step 5: The SVD is performed on C to get a left singu- from the Texas Instruments and Massachusetts Institute
    lar value vector u1 and a right singular value vector of Technology (TIMIT) speech database and the Text to
    v1 corresponded by the biggest singular value. Next Speech (TTS) speech database. There are different 1280
    they are transposed respectively and combine into a speech clips in experimental database recorded by 640
    feature vector F , which is shown as follows:                    men and 640 women. The format of each speech clip is
                                                                     wav with the length 4 s, which is of the form of 16 bits
                     F (k) = [uT1 v1T ] 1 ≤ k ≤ l                (9) PCM, mono and sampled at 16 kHz. Experimental hard-
                                                                     ware environment is Intel(R) Core(TM) i5-3230, 4-core
    where T and k are referred to matrix transpose and
                                                                     processor, 8 G and 2.6 GHz, software environment is the
    feature index respectively, total number of feature is
                                                                     MATLAB 2013a under Win7 operating system. Next, the
    l.
                                                                     proposed method compares with three algorithms in [8,
Step 6: F is quantified to obtain a perceptual hashing 14, 1], for convenience, which are abbreviated as MDCT-
    sequence by using Equation (10).                                 NMF [8], WPD-QT [14] and LPC-NMF [1] respectively.
                                                                    Some parameters involved in this experiment are shown
                                       1 F (k) ≥ 0
                         h(k)=                                  (10) in Table 1.
                                       0 otherwise

      where k is hashing index, l is the length of hashing          Table 1: The parameters used in this experiment
      codes.
                                                                      Hashing algorithm                  Parameters
                                                                         Proposed          M =257, L=372, N =32, M1 =255,
3.2     Hashing Match                                                                      N1 =30, l=234
                                                                        MDCT-NMF           M =360, L=177, N =100, r=1
                                                                         WPD-QT            M =64000, N =256, n=16
After yielding hashing sequences, the normalized ham-                   LPC-NMF            M =360, N =12, r=1
ming distance, shown in Equation (11), is utilized to
match them. The bit error rate (BER) is the ratio be-
tween the length of mismatches and the total length of
hashing vector, and it is equal to normalized hamming            As shown in Table 1, in MDCT-NMF algorithm, speech
distance in numerical value.                                  signal is divided into M frames with L samples, N is the
                                                              number of lower MDCT coefficients of each frame, and
                                  l
                               1X                             r is the dimension-reduction number of NMF. In WPD-
 BER(h1 , h2 ) = D(h1 , h2 ) =       | h1 (k) − h2 (k) | (11)
                               l                              QT algorithm, the length of speech signal is M , wavelet
                                 k=1
                                                              packet coefficients matrix is split into N identical n × n
where h1 and h2 are two hashing sequences randomly ex- square blocks. In LPC-NMF algorithm, framing number
tracted from two speech clips s1 and s2 , k is hashing in- is M , and N is the order of LPC, and r is the dimension-
dex, l is the length of hashing sequence.                     reduction number of NMF.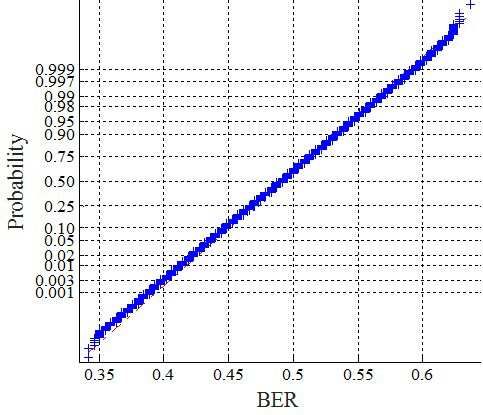
International Journal of Network Security, Vol.21, No.2, PP.259-268, Mar. 2019 (DOI: 10.6633/IJNS.201903 21(2).10)      263

4.1    Discrimination Analysis                                  speech signal well, so it has smaller FARs under differ-
                                                                ent thresholds; In LPC-NMF method, there is a certain
In this phase, 1, 280 different speech clips are used to cal-
                                                                amount of error when LPC is used to describe vocal tract
culate BERs in pairs, therefore a total of 818,560 BERs
                                                                character. Therefore, the method shows a lower discrim-
can be obtained and follow the distribution shown in Fig-
                                                                ination to different speech signal; for proposed method,
ure 4. Supposing the generation of binary sequence is
                                                                different speech signals have obviously distinct spectro-
random (independent and identical distributed), conse-
                                                                grams, so it gains a better discrimination.
quently, these BERs follow binomial distribution (l, µ),
                                                                   Entropy rate (ER) is a comprehensive evaluation cri-
where l represents the length of hashing sequence and µ
                                                                terion on discrimination of perceptual hashing algorithm.
is the probability of that a 0 or 1 is extracted. According
                                                                It principally overcomes the disadvantages where the dis-
to central limit theorem, if l is large, the BERs obey the
                                                                crimination of algorithm is susceptible to hashing size. It
normal distribution p with a mean µp    of 0.5 and the stan-
                                                                ranges from 0 to 1, and the larger its value indicates the
dard deviation σ = µ(1 − µ)/l = 1/4l. In our exper-
                                                                higher capacity of discrimination. It can be calculated
iment, l=234. After substituting l into above equation,
                                                                from following Equation (13) and Equation (14).
it is found that theoretical standard deviation σ value is
0.0327 (experimental mean and standard deviation value                  ER    = −[q log2 q + (1 − q) log2 (1 − q)]     (13)
are 0.4904 and 0.0332, respectively), which shows that ex-                         s
perimental results are pretty close to theoretical values.                      1     | σ 2 − σ12 |
                                                                          q   =   (                 + 1)               (14)
                                                                                2       σ 2 + σ12

                                                                where σ and σ1 are theoretical and experimental standard
                                                                deviation of BERs respectively, q is experimental mean
                                                                value.
                                                                   As can be observed in Table 3, the entropy rate of pro-
                                                                posed method is larger than MDCT-NMF and LPC-NMF
                                                                except WPD-QT. Thus, by above analyses, proposed al-
                                                                gorithm displays a better discrimination.

                                                                4.2    Robustness Analysis
                                                                Unlike the discrimination analysis, the robustness analy-
                                                                sis phase requires to compare BERs yielded from original
                                                                speech clips with their content-preserving manipulating
                                                                speech. There are 10 types of content preserving opera-
                                                                tions shown in Table 4. In order to vividly demonstrate
      Figure 4: BER normal distribution diagram
                                                                the influence of different content preserving distortions to
                                                                the 4 s original speech spectrogram (it is shown on Fig-
   The false accept rate (FAR) is commonly used to evalu-       ure 1(a)), six spectrograms are manifested in Figure 5.
ate discrimination of a speech perceptual hashing system.       Compared with Figure 1(a), it can be clearly seen from
It refers to the probability that the BER of two differ-        Figure 5(b), Figure 5(c), Figure 5(d) and Figure 5(e) that
ent perceptual contents is less than τ , and it is given by     the upper part of the spectrogram that reflects high fre-
Equation (12).                                                  quency information of the speech signal is subjected to
                                                                MP3 compression, filtering, noise and echo addition while
                      Z τ
                              1     −(x−µ)                      their lower portions are seldom swayed by these distor-
           F AR(τ ) =        √ e 2σ2 dx                (12)     tions. Moreover, in Figure 5(a), because increasing vol-
                        −∞ σ 2π
                                                                ume causes the energy of speech fingerprint to rise, some
where τ is BER threshold, µ and σ are mean and standard         new textures appear, which tends to be useless and inter-
deviation of BERs.                                              feres with extracting useful textual features. As also can
   Through comparing proposed algorithm with three              be observed, there is no significant difference between Fig-
other algorithms, the Table 2 shows the FARs under dif-         ure 5(f) and Figure 1(a), this indicates that resampling
ferent thresholds, and the conclusion may be drawn: when        operation has less impact on Figure 1(a).
τ < 0.3, with respect to the discrimination, the proposed          The mean and maximum of BERs of the proposed al-
method is better than MDCT-NMF and LPC-NMF and                  gorithm and three other methods in different content-
close to WPD-QT. This is primarily due to the following         keeping manipulations are presented in Table 5. In
reasons, MDCT-NMF method is sensitive to the change             MDCT-NMF approach, when the sampling rate (its value
of frame size, when sampling rate and frame number are          in the original paper is 44.1 kHz while it is 16 kHz in our
set to 16 kHz and 360 in our experiment respectively, its       experiment) is reduced, the length of frame is decreas-
FARs decreased dramatically; In WPD-QT method, the              ing on the condition of having same frame number, which
wavelet packet transform reflects frequency variation of        results in containing less information in each frame and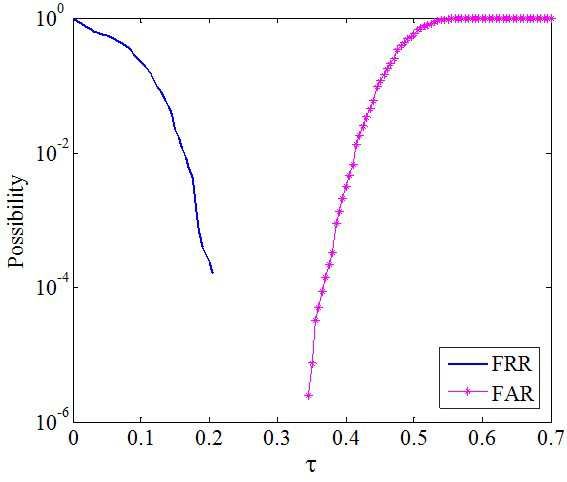
International Journal of Network Security, Vol.21, No.2, PP.259-268, Mar. 2019 (DOI: 10.6633/IJNS.201903 21(2).10)    264

                                        Table 2: FAR under different threshold

                           τ     MDCT-NMF           WPD-QT         LPC-NMF         Proposed
                         0.10     2.94×10⁻²¹        5.47×10⁻³¹     1.48×10⁻²²      3.17×10⁻³²
                         0.15     1.14×10⁻¹⁶        4.60×10⁻²⁴     1.05×10⁻¹⁷      5.74×10⁻²⁵
                         0.20     1.11×10⁻¹²        4.60×10⁻¹⁸     1.73×10⁻¹³      1.09×10⁻¹⁸
                         0.25     2.75×10−09        5.50×10⁻¹³     6.75×10⁻¹⁰      2.23×10⁻¹³
                         0.30     1.68×10−06        7.97×10−09     6.25×10−07      4.88×10−09

                                       Table 3: The comparison of entropy rate

                      Algorithm       MDCT-NMF           WPD-QT        LPC-NMF         Proposed
                         ER             0.5449            0.9510         0.6730         0.8308

                                        Table 4: Content preserving operations

                              Type                      Parameters               Abbreviation
                        Volume adjustment 1                 -50%                     V1
                        Volume adjustment 2                +50%                      V2
                        Resampling 1                    16-8-16 (kHz)                R1
                        Resampling 2                   16-32-16 (kHz)                R1
                        Echo addition                    100 ms, 0.5                  E
                        Narrowband noise                AWGN,40 dB                   NN
                        Low-pass filter 1        Butterworth filter, 3.4(kHz)       LP1
                        Low-pass filter 2             FIR filter, 3.4(kHz)          LP2
                        MP3 compression 1                  32 kbps                   M1
                        MP3 compression 2                 128 kbps                   M1

Figure 5: Spectrogram of (a) the 50%-volume-adding version of the 4 s original speech clip; (b) the 32 kbps-MP3-
compressing version of the 4 s original speech clip; (c) the Butterworth-filtering version of the 4 s original speech
clip; (d) 40 dB-noise-adding version of 4 s original speech clip; (e) echo-adding version of 4 s original speech clip; (f)
resampling (16-8-16 kHz) version of the 4 s original speech clip
International Journal of Network Security, Vol.21, No.2, PP.259-268, Mar. 2019 (DOI: 10.6633/IJNS.201903 21(2).10) 265
its degrading robustness. Although the wavelet packet bustness and discrimination.
transform can offer a more precise decomposition to signal
frequency, the decomposing coefficients of signal high fre- 4.3 Efficiency Analysis
quency are susceptible to noise. So the WPD-QT method
is poor on noise resistance. Since the linear prediction For illustrating the complexity and running efficiency of
analysis applies several past speech sampling values to proposed algorithm, the running time is used to evaluate
approximate to current ones, therefore the change of am- them with 100 speech clips selected randomly from the
plitude has bad influence on LPC-NMF method. Because original speech database, which is took in the process of
noise makes the spectrogram blurry, echo makes its tex- hashing generation and matching.
tures overlapping. Therefore, the influence of noise and As can be seen from Table 6, compared with three
echo to proposed method is obvious. By the analysis other algorithms, the proposed algorithm takes a less time
above and combining the data in Table 5, the following to generate and match hashing sequences. And its run-
information is obtained: in terms of robustness, the pro- ning efficiency is 4 times than LPC-NMF, 13 times than
posed algorithm outperforms LPC-NMF except the op- WPD-QT and 48 times than MDCT-NMF, which indi-
eration of volume addition, and it is also better than cates that the proposed method obtains higher running
MDCT-NMF and WPD-QT on resisting the distortions efficiency. Furthermore, the hashing size in proposed al-
caused by noise addition and filtering, but it is a little gorithm is 234, 360 in LPC-NMF and MDCT-NMF, 250
weaker than MDCT-NMF on resisting echo distortion. in WPD-QT, which shows that the proposed algorithm
In contrast to discrimination analysis, the false reject has a stronger compaction.
rate (FRR) is employed to estimate the robustness of a From the analyses given above, the proposed algorithm
perceptual hashing system. It is the probability that the has the advantages of high speed and few data, therefore
BERs of same two perceptual contents are more than τ . it can meet the efficiency requirement of real-time speech
And its formula can be got from Equation (15). communication.
Z τ
1 −(x−µ)
F RR(τ ) = 1 − √ e 2σ2 dx (15)
−∞ σ 2π 5 Conclusions
where τ is BER threshold, µ and σ are mean and standard In this paper, we proposed an efficient perceptual hash-
deviation of BERs. ing scheme based on spectrogram for speech identification.
In order to describe the discrimination and robustness By leveraging computer-vision method, the proposed al-
of the proposed algorithm more adequately, two kinds of gorithm adopts LBP to make texture information of a
BERs are utilized for probability analysis and drawing sub-spectrogram block more salient. As well as an image
FAR-FRR curve in a coordinate system, one from the perceptual hashing method is utilized to generate hashing
discrimination analysis in Section 4.1 and another from sequences from the sub-spectrogram block, which repre-
the robustness analysis in Section 4.2. Then, the ro- sents low frequency information of speech signal and is not
bustness and discrimination of system can be evaluated sensitive to common content keeping distortions. Exper-
by observing whether FAR curve and FRR curve cross, imental results show that the proposed scheme achieves
because if they have an intersection, the system cannot better discrimination to different speech clips and good
judge whether two speech clips are same perceptual con- robustness against some routine speech operations, such
tents in intersection area. Figure 6 shows the comparison as noise addition, MP3 compression and filtering. Fur-
of FAR-FRR curve between proposed approach and three thermore, the proposed scheme shows a high running ef-
other methods. ficiency and stronger compaction. This enables the pro-
As can be seen in Figure 6(d), there is no one inter- posed approach to be used in mobile speech real-time en-
section on FAR-FRR curve of the proposed algorithm. vironment well.
Therefore, assuming the matching threshold τ is set to There exist some issues to be handled in the proposed
0.3, when BERInternational Journal of Network Security, Vol.21, No.2, PP.259-268, Mar. 2019 (DOI: 10.6633/IJNS.201903 21(2).10) 266
Table 5: Robustness test
MDCT-NMF WPD-QT LPC-NMF Proposed
Type
Mean Max Mean Max Mean Max Mean Max
V1 0.0040 0.0722 0.0008 0.0022 0.0016 0.0330 0.0179 0.0940
V2 0.0256 0.1056 0.0082 0.0100 0.0415 0.0917 0.0479 0.1624
R1 0.0012 0.0194 0.0036 0.0352 0.0260 0.1250 0.0094 0.0470
R2 0.0098 0.0750 0.0489 0.2266 0.1219 0.4028 0.0263 0.0149
E 0.0923 0.1827 0.1066 0.2305 0.2015 0.3000 0.1260 0.2051
NN 0.1357 0.2086 0.1452 0.5273 0.3464 0.5250 0.0918 0.2094
LP1 0.1422 0.2500 0.0864 0.2617 0.4098 0.5389 0.0784 0.1667
LP2 0.1615 0.2583 0.0924 0.2695 0.4303 0.5500 0.0813 0.1851
M1 0.0218 0.0722 - - 0.1147 0.2920 0.1097 0.1838
M2 0.0035 0.0389 - - 0.0727 0.2810 0.0248 0.0855
(a) (b)
(c) (d)
Figure 6: BER normal distribution diagram. (a) FAR-FRR curve of MDCT-NMF algorithm; (b) FAR-FRR curve
of WPD-QT algorithm; (c) FAR-FRR curve of LPC-NMF algorithm; (d) FAR-FRR curve of proposed algorithm
ral Science Foundation of Gansu Province of China References
(No.1310RJYA004). The authors would like to thank the
anonymous reviewers for their helpful comments and sug- [1] N. Chen and W. Wan, “Robust speech hash func-
gestions. tion,” ETRI Journal, vol. 32, no. 2, pp. 345–347,
2010.
[2] N. Chen, H. D. Xiao, J. Zhu, J. J. Lin, Y. Wang, andInternational Journal of Network Security, Vol.21, No.2, PP.259-268, Mar. 2019 (DOI: 10.6633/IJNS.201903 21(2).10) 267
Table 6: Running time
Algorithm MDCT-NMF WPD-QT LPC-NMF Proposed
File length(s) 4 4 4 4
Dominant frequency (GHz)) 2.5 2.5 3.3 2.6
Total (s) 130.4 36.81 12.47 2.67
W. H. Yuan, “Robust audio hashing scheme based on recurrence analysis,” in IEEE International Con-
cochleagram and cross recurrence analysis,” Electron ference on Acoustics, Speech and Signal Processing,
Letters, vol. 49, no. 1, pp. 7–8, 2013. pp. 644–648, May 2014.
[3] N. Chen and H. D. Xiao, “Perceptual audio hashing [13] C. S. Rao and S. B. G. T. Babu, Image Authenti-
algorithm based on zernike moment and maximum- cation Using Local Binary Pattern on the Low Fre-
likelihood watermark detection,” Digital Signal Pro- quency Components, India, 2016.
cessing, vol. 23, no. 4, pp. 1216–1227, 2013. [14] Q. Y. Zhang, P. F. Xing, Y. B. Huang, R. H. Dong,
[4] W. R. Ghanem, M. Shokir, and M. Dessoky, “Defense and Z. P. Yang, “An efficient speech perceptual hash-
Against Selfish PUEA in Cognitive Radio Networks ing authentication algorithm based on wavelet packet
Based on Hash Message Authentication Code,” In- decomposition,” Journal Information Hiding Multi-
ternational Journal of Electronics and Information media Signal Process, vol. 6, no. 2, pp. 311–322, 2015.
Engineering, vol. 4, no. 1, pp. 12–21, 2016. [15] X. Zhang, B. L. Zhu, L. W. Li, W. Li, X. Q. Li,
[5] Y. B. Huang, Q. Y. Zhang, and W. J. Hu, “Ro- W. Wang, P. Z. Lu, and W. Q. Zhang, “Sift-based
bust speech perception hashing authentication al- local spectrogram image descriptor: A novel feature
gorithm based on spectral subtraction and multi- for robust music identification,” EURASIP Journal
feature tensor,” International Journal of Network Se- on Audio Speech & Music Processing, vol. 2015, no. 6,
curity, vol. 20, no. 2, pp. 206–216, 2018. pp. 1–15, 2015.
[6] Y. B. Huang, Q. Y. Zhang, and Z. T. Yuan, “Percep- [16] B. L. Zhu, W. Li, Z. R. Wang, and X. Y. Xue,
tual speech hashing identification algorithm based “A novel audio fingerprinting method robust to time
on linear prediction analysis,” Telkomnika Indone- scale modification and pitch shifting,” in In Proceed-
sian Journal of Electrical Engineering, vol. 12, no. 4, ings of the 18th ACM international conference on
pp. 3214–3223, 2014. Multimedia, pp. 987–990, Oct. 2010.
[7] S. S. Kozat, R. Venkatesan, and M. K. Mihcak,
“Robust perceptual image hashing via matrix invari-
ants,” in International Conference on Image Process- Biography
ing (ICIP ’04), pp. 3443–3446, Oct. 2004.
[8] J. F. Li, H. X. Wang, and J. Yi, “Audio per- Zhang Qiu-yu. Researcher/Ph.D. supervisor, gradu-
ceptual hashing based on NMF and MDCT coeffi- ated from Gansu University of Technology in 1986, and
cients,” Chinese Journal of Electronics, vol. 24, no. 3, then worked at school of computer and communication
pp. 579–588, 2015. in Lanzhou University of Technology. He is vice dean
[9] J. F. Li, T. Wu, and H. X. Wang, “Perceptual hash- of Gansu manufacturing information engineering research
ing based on correlation coefficient of MFCC for center, a CCF senior member, a member of IEEE and
speech authentication,” Journal of Beijing Univer- ACM. His research interests include network and informa-
sity of Posts and Telecommunications, vol. 38, no. 2, tion security, information hiding and steganalysis, multi-
pp. 89–93, 2015. media communication technology.
[10] N. M. Makbol, B. E. Khoo, and T. H. Rassem, Zhang Tao. received the BS degrees in communica-
“Block-based discrete wavelet transform-singular tion engineering from Lanzhou University of Technology,
value decomposition image watermarking scheme us- Gansu, China, in 2015. His research interests include au-
ing human visual system characteristics,” IET Image dio signal processing and application, multimedia authen-
Process, vol. 10, no. 1, pp. 34–52, 2016. tication techniques.
[11] S. S. Nassar, N. M. Ayad, H. M. Hamdy, H. M. Ke-
lash, H. S. El-sayed, M. A. M. El-Bendary, F. E. A. Qiao Si-bin. received the BS degrees in communica-
El-Samie, and O. S. Faragallah, “Efficient audio in- tion engineering from Lanzhou University of Technology,
tegrity verification algorithm using discrete cosine Gansu, China, in 2014. His research interests include au-
transform,” International Journal of Speech Technol- dio signal processing and application, multimedia authen-
ogy, vol. 19, no. 1, pp. 1–8, 2016. tication techniques.
[12] Z. Rafii, B. Coover, and J. Y. Han, “Robust au- Wu Dong-fang. In 2015, Wu Dongfang obtained his
dio hashing scheme based on cochleagram and cross bachelor of engineering degree from Northwest UniversityInternational Journal of Network Security, Vol.21, No.2, PP.259-268, Mar. 2019 (DOI: 10.6633/IJNS.201903 21(2).10) 268 for Nationalities. Currently, he is studying for his mas- ter’s degree at Lanzhou University of Technology. His research focuses on the industrial control network secu- rity.
You can also read