On How People Navigate Through Their Personal Web of Things - Microsoft
←
→
Page content transcription
If your browser does not render page correctly, please read the page content below
On How People Navigate Through
 Their Personal Web of Things
Dhivya Eswaran Shamsi Iqbal
deswaran@cs.cmu.edu shamsi@microsoft.com
Carnegie Mellon University Microsoft Research

Adam Fourney Shane Williams
adamfo@microsoft.com shanewil@microsoft.com
Microsoft Research Microsoft Research
Paul Bennett
pauben@microsoft.com
Microsoft Research

ABSTRACT
In a digital setting, people accomplish their goals by interacting with multiple files, web pages, emails,
and applications – each of which often relates to multiple projects and people. This leads to a rich
interconnected personal web of things, comprising heterogeneous entities and information interaction
trails. In this work, we seek to understand a single dimension of the personal web in work-related
settings, namely, how people transition between activities. To this end, we develop an instrumentation
platform to log all activities that a person performs across all desktop applications (e.g. web browsers,
editors and email clients). With the goal of understanding how people’s transition across activities
relate to their productivity, we conduct a study involving ten participants to collect logs of activities
performed by them on their primary work devices over a 4-5 week duration. Our analysis of this
Permission to make digital or hard copies of all or part of this work for personal or classroom use is granted without fee
provided that copies are not made or distributed for profit or commercial advantage and that copies bear this notice and the full
citation on the first page. Copyrights for components of this work owned by others than ACM must be honored. Abstracting
with credit is permitted. To copy otherwise, or republish, to post on servers or to redistribute to lists, requires prior specific
permission and/or a fee. Request permissions from permissions@acm.org.
CHI 2020 Workshop on Speculative Designs for Emergent Personal Data Trails, April 26, 2020, Hawaii
© 2020 Association for Computing Machinery.
ACM ISBN 978-x-xxxx-xxxx-x/YY/MM. . . $15.00
https://doi.org/10.1145/nnnnnnn.nnnnnnn

On How People Navigate Through Their Personal Web of Things CHI 2020 Workshop on Speculative Designs for Emergent Personal Data Trails, April 26, 2020, Hawaii

 data provides an initial insight into people’s behavior in this space, which envelops personal corpora
 (e.g. emails, documents), public resources accessed (e.g. webpages), and activities undertaken across
 multiple applications. We conclude by outlining how our observations can be leveraged to provide
 better productivity support, and more broadly, the rich set of technical questions and challenges the
 personal web setting poses for exciting future research.
 ACM Reference Format:
 Dhivya Eswaran, Shamsi Iqbal, Adam Fourney, Shane Williams, and Paul Bennett. 2020. On How People Navigate
 App Usage Through Their Personal Web of Things. In Proceedings of (CHI 2020 Workshop on Speculative Designs for Emergent
 Link
 Personal Data Trails). ACM, New York, NY, USA, 8 pages. https://doi.org/10.1145/nnnnnnn.nnnnnnn
 MAIL
 Structural
 Link
 Transition
 INTRODUCTION
 HTML
 Link
 In a digital setting, people accomplish their goals by interacting with multiple files, web pages, emails,
 DOC MAIL
 HTML

 Information
 Flow and applications – each of which often relate to multiple projects and people. This leads to a rich
 PDF HTML Content interconnected personal web of things, comprising heterogeneous entities and information interaction
 Similarity
 trails. We visualize this in Figure 1. In this work, we seek a deeper understanding of a single dimension
 of the personal web in work-related settings: how people’s transition between activities relate to their
Figure 1: ‘Personal’ Web of a Hypothetical productivity. Figure 2 illustrates the sequence of activity transitions for a hypothetical person, Alice.
Person
 First, Alice edits a document A and then she accesses a related web page B, returning to A to continue
 editing it. Then, she checks an incoming e-mail C and re-accesses web page B. We use the term activity
 to refer to a unique action (application + resource accessed through it) that a person can perform
 such as A, B, or C. Each contiguous duration of time spent on a single activity is called an activity
 slice. Figure 2 shows five such activity slices 1, . . . , 5 .
 We note that a logical conclusion based on the transition back and forth is that the document A
 and web page B are likely related as it pertains to Alice accomplishing her current task goals. This is
 Figure 2: Trail of Activity Transitions analogous to within-session transitions in Search and Browsing logs that have been studied extensively
 in the information retrieval literature [5, 7]. In contrast, these transitions do not fall within a single
 application and consequently less is known about inferring relevance and accelerating information
 access in this space in order to assist people (e.g. should the web page be recommended as relevant
 when the document is opened later). Likewise, while there is a rich literature on personal information
 management [4, 8], these studies often restrict to simply personal documents – we note the inclusion
 of a web page within Alice’s personal web because her interaction and transition from the web page
 to other personal documents is personal and escapes current web browsing logs. In contrast, we take
 a holistic view of personal corpora (e.g. emails, documents), public resources accessed (e.g. webpages),
 and activities undertaken across multiple applications within the abstraction of a personal web.
 The central research question driving the present work is: “What patterns do the activity trails reveal
 about the way people work?” Insights into people’s behavior regarding how people navigate through
On How People Navigate Through Their Personal Web of Things CHI 2020 Workshop on Speculative Designs for Emergent Personal Data Trails, April 26, 2020, Hawaii

 their personal web at workplace can help us better understand how to provide better productivity
 support, for example, by designing self-contained application environments that ease the undertaking
 of complex tasks, by suggesting breaks when productivity or focus levels are dropping, or by building
 contextual predictors to accelerate the access of relevant resources (e.g. [2]).

 THE PERSONAL WEB OF THINGS
 As indicated in Figure 1, the personal web can be visualized as connections between different entities
 pertaining to a person’s digital interactions. We view an activity as a pair consisting of an application
 identifier and a URI (possibly null) used within an application. The primary links within the personal
 web are one of the following types: (a) content; (b) structural; (c) activity transitions; (d) information
 flow; (e) application usage. We briefly elaborate on these to highlight the potential for deeper study
 in each of these areas. Content-based links can be computed based on similarity in content surpassing
 a threshold. Structural links are analogous to hyperlinks in the global web graph created through
 metadata field links including: people linked via senders/recipients on email, attached or embedded
 documents, authors/readers of a document, etc. Transition links are links derived from time-based
 transitions between activities and entities in the graph. The implications of these links is the primary
 focus point of this paper. Information flow links provides a unique opportunity to view self-initiated
 activities such as copy/paste which transfer content. Finally, application usage links are derived based
 on usage within an application and/or application type (e.g. type extensions of filenames).

 LOGGING THE PERSONAL WEB
 We developed an instrumentation platform, running on Windows PCs, which logs the activities that
 information workers performed using a variety of publicly available APIs with a heavy focus on the
1 https://docs.microsoft.com/en-us/windows/ Windows Accessibility API1 and the Microsoft Graph2 . These enabled us to capture features derived
win32/winauto/windows-accessibility- from content, focus (which window was in focus), interaction (e.g. active editing), and duration among
features-reference others. To provide maximum fine-grained privacy control, users of the platform could suspend logging
2 https://developer.microsoft.com/en- temporarily or for an extended time or selectively delete logged information. In keeping with the
us/graph/ strictest of privacy protection, we did not log when users chose to suspend logging or delete activity
 logs. While this leads to some gaps in the logs, we believe this is the most complete logging we can
 conduct while adopting a privacy-first mindset. Logs were stored securely in participants’ control on
 device, enabling them to delete logs and/or unenroll from our study at any time. Before exporting any
 anonymized or aggregate information from device, participants were shown representative examples
 and analysis from their own data with options to decline sharing or to see more examples. At all times
 we followed our institutions ethics guidelines and IRB procedures for this study.
 Thus, the instrumentation platform essentially provides a view for each person of the sequence of
 activity slices (i.e., transitions), the duration spent in each activity slice, both application and URI
On How People Navigate Through Their Personal Web of Things CHI 2020 Workshop on Speculative Designs for Emergent Personal Data Trails, April 26, 2020, Hawaii

 identifiers (URI includes file, URLs, emails) etc. We recruited 10 participants who were information
 workers in a large enterprise to install the instrumentation platform on their primary work devices and
 collected their activity log for 4-5 weeks during July-August. Given the terms of use under which the
 data were collected, for aggregate cross-participant analysis the applications that participants used
 during the time are known but the individual URIs are identified only through anonymous participant-
 specific identifiers. As described above, we consider an activity to be defined by the combination of
 application ID and URI. So opening two different emails in the same email application or webmail
 client are viewed as different activities while opening the same email in the same application or
 webmail client are viewed as the same activity. We note that the accessibility API often enables us
 to distinguish URIs within an application such as webmail client to get this fine-grained resolution
 – while not all applications/clients conform precisely we have endeavored to resolve the primary
 applications/clients to understand people’s behavior in as fine-grained manner as possible.

 DATA PREPROCESSING
 To reduce noise in the data from unintentional window switches (e.g. created by Alt+Tab switches
 using keyboard) or brief dismissals of pop-up information, we remove activity slices of less than 15
 seconds. This may create discontinuities in an activity which was virtually uninterrupted. To reduce
 these gaps and identify a continuous activity, if a person engages in the same activity for at least two
 minutes on either side of a gap of less than 15 seconds, we merge these two slices as a single slice
 and repeat this process recursively until all such discrepancies are resolved. We further group activity
 slices into sessions, where a session is defined as a contiguous sequence of activity slices punctuated on
 either side by a period of inactivity lasting at least 15 minutes.
 As an indicator for the nature of work a person might be doing within an application, we consider the
 following groups of applications: (i) browser: chrome, edge, firefox; (ii) communication: outlook, teams;
 (iii) development: visual studio, pycharm; (iv) terminal: command prompt, putty; (v) high-level
 editor: word, excel, powerpoint, onenote; (vi) low-level editor: atom, notepad, sublime text,
 notepad++; (vii) reader: microsoft pdf reader, acrobat reader; and (viii) explorer. We note that
 these indicators are imperfect and only serve a useful first-pass assumption, as they do not uniquely
 represent the nature of work, or even represent a unique nature of work. For example, people can
 read documents check emails and perform development on a browser, whereas a document can be
 read via a reader or a high-level editor.

 INSIGHTS INTO PEOPLE’S BEHAVIOR
 Our analysis of activity transition data focuses on four key aspects of activity transitions that help
 us understand how people navigate through the personal web: (1) Timing and Frequency: How
 frequently do activity and application transitions take place? How does this vary with the nature of
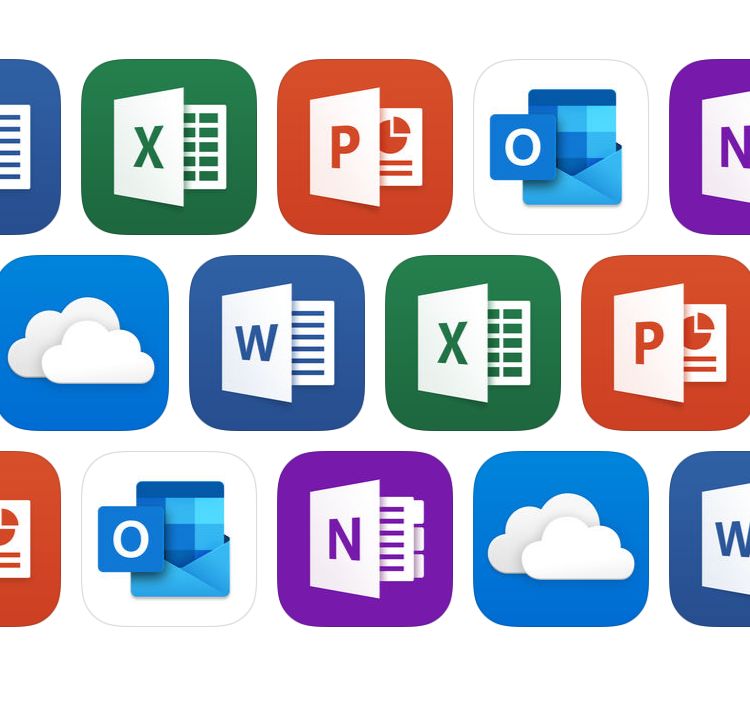
On How People Navigate Through Their Personal Web of Things CHI 2020 Workshop on Speculative Designs for Emergent Personal Data Trails, April 26, 2020, Hawaii

 0.7 To the next activity work and the time at which it is performed? (2) Intra- vs. Inter- Application Transitions: How do
 Probability (or its density)

 0.6
 To the next application people transition between activities within an application and across applications in the same/different
 application group(s)? (3) Novelty vs. Repetition: How often do people transition to a novel or repeat
 0.5
 activity? Do they complete or bore of activities quickly, never to return to them again? (4) Recency-
 0.4
 Bias: When transitioning to a repeat activity, how often are these to one performed recently vs. to
 0.3 one performed far back in time? We now present our findings.
 0.2
 Timing and Frequency
 0.1

 0.0
 A fundamental quantity characterizing how people navigate their personal web is how long their
 0 2 4 6 8 10 tend to reside at each activity they access. Hence, we study the distribution over dwell-time or time to
 Time to transition (minutes)
 transition, which is the amount of time people spend on a single activity slice before transitioning
 to the next. The relevant figures are displayed in Figures 3-6; each of them contains a histogram of
Figure 3: Dwell-Time Distribution Over
Activities and Applications normalized counts capturing the fraction of slices with a certain range of dwell-time, as well as its
 smoothed probability density estimate using Gaussian kernel.
 1.0 Browser The distribution of time taken to transition to the next activity is indicated in red in Figure 3. We
 Probability (or its density)

 Comm. observe that the distribution is skewed towards low values, suggesting that people transition between
 0.8 Dev. activity rather frequently. In fact, the average time a person spends on an activity is only 1.84 minutes
 Terminal
 (median: 0.68). That is, people spend less than a minute on 62% and less than 3 minutes on 87% activity
 0.6 HL editor
 Explorer
 slices. This could partly stem from the joint usage of multiple resources to accomplish a single task, but
 0.4 LL editor at the same time, could also be explained based on the short focus of people, leading them to switch
 Reader between activities rapidly. Turning to transition times at the level of application (blue in Figure 3),
 0.2 this distribution is also skewed, with people spending only 3.6 minutes on average (median: 1.3) on an
 0.0
 application before moving out of it. The slightly larger average transition time (correspondingly, fatter
 0 2 4 6 8 10 tail of blue curve) suggests that many of the activity-level transitions are contained within the same
 Time to transition (minutes) application. We explore this further in the next section.
 In Figure 4, we break down the activity-level transitions based on the nature of the activity from
Figure 4: Dwell-Times Across Application
Groups
 which the transition takes place, captured by its application group. The plot reveals that people
 transition less frequently than overall from activities in development, high-level editor and
 communication groups (2.7-3.2 minutes on average), while more frequently than overall from other
 groups such as browser, reader, etc. Notably, people spend the least time on activities from explorer
 and browser groups (1-1.3 minutes on average) and most time on development-related activities.
 Figure 5 breaks down transitions based on the time of the day at which they take place. We observe
 that people transition most frequently during 8am-10am and 2pm-4pm (1.7 minutes on average),
 presumably resulting from non-focused work such as reading/responding to multiple e-mails before
 resuming work in the morning and following the lunch break. People transition least frequently during
 4pm-6pm suggesting that people tend to focus on activities more when they elect to stay late at work.
On How People Navigate Through Their Personal Web of Things CHI 2020 Workshop on Speculative Designs for Emergent Personal Data Trails, April 26, 2020, Hawaii

 0.7 8am-10am Similarly, Figure 6, which breaks down transitions based on the day of the week, shows that people
 Probability (or its density)

 10am-12pm tend to perform their most focused work on Wednesdays and Thursdays, dwelling on an activity slice
 0.6
 12pm-2pm for over 2.1 minutes on average. They transition most frequently out of activities on Mondays and
 0.5 2pm-4pm
 Fridays, residing less than 1.75 minutes on an activity on average. This phenomenon signifies the
 4pm-6pm
 0.4
 ramp up/down of work around the weekend, noted earlier in [6].
 0.3

 0.2
 Intra- vs. Inter- Application Transitions
 0.1 Delving deeper into activity transitions within and across applications, we first note that 49.3% of
 0.0
 all within-session transitions are to an activity within a different application. In fact, the application
 0 2 4 6 8 10 corresponding to the activity after next is more likely (= 58%) to match the current application than
 Time to transition (minutes) the application of the next activity. This shows that people typically work across multiple applications,
 often switching between a particular pair of them, to accomplish their goals. When people dwell on
 Figure 5: Across Hours of a Day
 two consecutive activity slices in the same application, however, they are significantly more likely
 0.8
 Monday (= 73%) to perform the next activity in the same application as well. In fact, the probability of staying
 Probability (or its density)

 0.7
 Tuesday in an application increases monotonically with the number of consecutive activity slices dwelt within
 0.6 Wednesday the same application, as shown in Figure 7. Thus, applications tend to behave as sticky states, in
 Thursday
 0.5 which the more a person dwells, the more likely they are to continue dwelling in.
 Friday
 0.4 In Figure 8 (left), we visualize the probability that a person will transition to an activity within
 0.3 the same application group (‘stay’) vs. an activity in a different application group (‘switch’). Darker
 0.2 squares indicate more likely transitions and the probability values in a row sum to one. We notice that
 0.1
 browser and communication are the only application groups which are more likely to retain people
 for their next activity slice than let go. We hypothesize that this is due to the fairly self-contained
 0.0
 0 2 4 6 8 10 ecosystem of browsers which provide a single-stop solution to carry out a diverse set of activities
 Time to transition (minutes) and people’ preference to batch reading and composing emails or chat messages in quick succession.
 Other application groups, in contrast, are predominantly used in conjunction with another application
 Figure 6: Across Days of the Week
 group. We also visualize the probability of transition between various application groups in Figure 8
 0.9 (right), conditioned on switching to a different application group. Thus, values in a row still sum
 Probability of stay

 0.8
 to one. We observe that the application groups most commonly used following development are
 browser (e.g. to clarify a code-related query) and low-level editor (e.g. to check intermediate files).
 0.7 Transitions to browser from any application group is likely, notably from terminal, high-level
 0.6
 editor and communication. This provides concrete avenues to enhance people’s productivity by, e.g.,
 better integrating pairs of applications used together most often.
 0.5
 2 4 6 8 10 Novelty vs. Repetition
 Number of consecutive slices
 Next, we turn to patterns in activity transitions to novel vs. repeat activities (i.e. those never accessed
 Figure 7: Intra-app stickiness before vs. those accessed in the past) and examine how often repeat activities tend to be re-accessed.
On How People Navigate Through Their Personal Web of Things CHI 2020 Workshop on Speculative Designs for Emergent Personal Data Trails, April 26, 2020, Hawaii

 1.0

 Transition probability given ’Switch’
 Application group of current slice
 Reader 0.33 0.67

 Application group of current slice
 Reader 0.36 0.28 0.02 0.02 0.093 0.17 0.053

 LL editor 0.17 0.83 LL editor 0.23 0.077 0.49 0.12 0.025 0.058 0.0053 0.8

 Explorer 0.24 0.76 Explorer 0.31 0.2 0.26 0.074 0.037 0.072 0.043
 0.6
 HL editor 0.21 0.79 HL editor 0.63 0.17 0.064 0.018 0.057 0.034 0.026

 Terminal 0.22 0.78 Terminal 0.69 0.065 0.069 0.0093 0.065 0.097 0.0027
 0.4

 Dev. 0.4 0.6 Dev. 0.4 0.19 0.071 0.021 0.11 0.21 0.0031

 Comm. 0.53 0.47 Comm. 0.57 0.19 0.038 0.051 0.072 0.042 0.035 0.2

 Browser 0.76 0.24 Browser 0.31 0.23 0.22 0.1 0.068 0.049 0.027
 0.0
 Stay Switch Browser Comm. Dev. TerminalHL editor Explorer LL editor Reader
 Action Application group of next slice

 Figure 8: Inter-app synergy (left) and transition patterns (right)
 0.9
 Few projects Many projects As shown in Figure 9, the fraction of novel activities undertaken by people varied widely based on
 0.8
 their self-declared count of ongoing projects at the time of data collection. Participants who worked
 Transition probability .

 0.7
 on a few projects tended to re-access the same set of activities leading to a high repeat fraction of
 0.6
 67.5%. In contrast, people with many ongoing projects accessed repeat activities only 35% of the time.
 0.5
 A highly repeated activity suggests that a person may have completed or be bored of it, hence
 0.4
 decreasing the likelihood of its re-access. On the other hand, a high repeat count could also signify
 0.3
 that an activity is a personal favorite (e.g. Facebook) that is likely to be re-accessed. To investigate
 0.2
 which of these phenomena is at play in our setting, we chart the probability that an activity with a
 0.1
 certain number of accesses in the past will be re-accessed in the future. As seen from Figure 10, the
 0.0
 Repeat Novel more a person accesses an activity, the more likely they are to resume it in the future. This suggests
 Type of next activity that people do not complete or get bored of activities, but rather return to certain favorites time and
 again. This is analogous to the general trend observed in repeat consumption literature [1, 3].
 Figure 9: Novelty vs. Repetition
 1.0 Bias Toward Recency
 Among repeat transitions (i.e. transitions to repeat activities), we delve deeper into how recent the
 Probability of re-access

 0.9
 latest access to such activities tends to be. Figure 11 illustrates the recency distribution for people with
 0.8
 few (green) and many projects (orange). Even though these groups had strikingly different distribution
 0.7 over transitions to repeat activities as we saw earlier in Figure 9, we observe that they exhibit a similar
 distribution over recency, conditioned on transitioning to a repeat activity. In particular, about 30% of
 0.6
 repeat transitions were to activities accessed within 5 minutes and about 60% were to those accessed
 0.5 within 30 minutes, suggesting that a high recall for prediction of repeat activities may be possible by
 0.4
 considering just the top few activities in the Most Recently Used (MRU) cache, as also noted in [1, 3].
 0 20 40 60
 Number of previous slices

 Figure 10: Lack of Completion
On How People Navigate Through Their Personal Web of Things CHI 2020 Workshop on Speculative Designs for Emergent Personal Data Trails, April 26, 2020, Hawaii

 0.40
 Few projects Many projects CONCLUSIONS AND FUTURE WORK
 0.35
 In summary, our analysis revealed several salient patterns in how people navigate through their
Transition probability

 0.30
 given ’Repeat’

 0.25 personal web of things. Primarily, we found that people tend to transition between activities fairly
 0.20 often. Thus, predictive tools which can ease these transitions can greatly improve productivity. We
 0.15 also saw that people tended to use two or more applications together to achieve their goals, raising
 0.10 the need to study people’s behavior across application boundaries. Rethinking UI to enable easier
 0.05 access of two or more applications together in a single-desktop environment could also be hugely
 0.00 beneficial. Repeat accesses were found to be biased towards recent or frequent activities in the past;
 1w
 thus, even simple tools such as Most Recently or Frequently Used caches could have a significant
 Time from previous access (recency)
 coverage. Only a small fraction of transitions to old infrequent activities may be difficult to predict,
 Figure 11: Recency-Bias requiring a deeper contextual model of relevance. To warrant sophisticated modeling, further studies
 are needed to confirm that predicting such transitions are linked to a larger reward in user experience.
 Altogether, the personal web setting opens avenue for exciting future research owing to the several
 challenges it poses. From an algorithmic point of view, handling the rapidly-evolving space of activities
 (e.g. new emails), continually changing priorities of people, the need for privacy-preserving solutions
 which can learn over limited per-person data are important concerns. From a human-centric view,
 eliciting responses as to when people feel productive or focused, and correlating them with signals
 present the data could help discern discriminating patterns which signify productivity or lack thereof.
 This could in turn help develop automated solutions to identify times of low productivity, where
 refreshing breaks, or a context switch to a different project, or a different type of activity (e.g. reading
 to writing) may be needed. Moreover, learning to differentiate between productive and distracting
 transitions could help train better predictive models selectively over a particular type of transitions.

 REFERENCES
 [1] Ashton Anderson, Ravi Kumar, Andrew Tomkins, and Sergei Vassilvitskii. 2014. The dynamics of repeat consumption. In
 WWW. ACM, 419–430.
 [2] James Begole, Nicholas E. Matsakis, and John C. Tang. 2004. Lilsys: Sensing Unavailability. In CSCW. ACM, 511–514.
 [3] Austin R. Benson, Ravi Kumar, and Andrew Tomkins. 2016. Modeling User Consumption Sequences. In WWW. ACM,
 519–529.
 [4] Ofer Bergman and Steve Whittaker. 2016. The science of managing our digital stuff. MIT Press.
 [5] Bernard J. Jansen, Amanda Spink, Judy Bateman, and Tefko Saracevic. 1998. Real Life Information Retrieval: A Study of
 User Queries on the Web. SIGIR Forum 32, 1 (1998), 5–17.
 [6] Gloria Mark, Shamsi T. Iqbal, Mary Czerwinski, and Paul Johns. 2014. Bored mondays and focused afternoons: the rhythm
 of attention and online activity in the workplace. In CHI. ACM, 3025–3034.
 [7] Craig Silverstein, Monika Rauch Henzinger, Hannes Marais, and Michael Moricz. 1999. Analysis of a Very Large Web
 Search Engine Query Log. SIGIR Forum 33, 1 (1999), 6–12.
 [8] Jaime Teevan, William Jones, and Robert Capra. 2008. Personal Information Management (PIM) 2008. SIGIR Forum 42, 2
 (Nov. 2008), 96–103. https://doi.org/10.1145/1480506.1480524
You can also read