Analysis of Indonesia Politics Polarization before 2019 President Election Using Sentiment Analysis and Social Network Analysis - MECS Press
←
→
Page content transcription
If your browser does not render page correctly, please read the page content below
I.J. Modern Education and Computer Science, 2019, 11, 22-30
Published Online November 2019 in MECS (http://www.mecs-press.org/)
DOI: 10.5815/ijmecs.2019.11.04

Analysis of Indonesia Politics Polarization before
 2019 President Election Using Sentiment
 Analysis and Social Network Analysis
 Mohammad Nur Habibi1
 Department of Informatics,Widyatama University Bandung, Indonesia
 Email: nur.habibi@widyatama.ac.id

 Sunjana2
 Department of Informatics,Widyatama University Bandung, Indonesia
 Email: sunjana@widyatama.ac.id

 Received: 13 September 2019; Accepted: 19 October 2019; Published: 08 November 2019

Abstract—The development of the Internet in Indonesia to split into two groups that faced each other. This can be
is quite rapid, it is marked by the increasing use of social seen in the action of attacking each other between the two
networks, especially Twitter. Not only to share status or groups either directly, such as in the Car Free Day area of
stories, Twitter has become become a means of Jakarta some time ago or indirectly such as on social
promotion and campaign for elections. The Twitter data networks. The rigors of abuse and attack on social
can be used to find out the political polarization in networks do not rule out the possibility that this event
Indonesia that is needed in the 2019 presidential election. could be the seeds of polarization that lead to harder
The method used in this research is sentiment analysis physical friction. Like the polarization that occurred in the
using naï ve bayes classifier and social network analysis 2017 DKI Jakarta regional elections it is very likely to
using the calculation of network attribute values and occur in the 2019 presidential election, even more likely
centrality values. 8.814 Twitter data was collected using to occur with greater resonance. There is great concern
data crawling method. The data are divided into three that if this political polarization does not stop growing it
subsets consisting of jokowi’s sentiments, prabowo’s will damage trust in the government in the wider
sentiments, and pilpres’s sentiments. Final result of the community. Regarding how to map community sentiment
sentiment analysis is classified sentiments into positives, there are many ways that can be done, such as mapping
negatives, and neutral. The average value of the community sentiment through social networks. The
classification results was 91.27% positive sentiment, 7.56% development of social networking users has made the
negatives sentiment, and 1.17% neutral sentiment. This availability of relevant data sources to analyze various
classification yielded the average accuracy of 69.2% for community sentiments more accessible. Indirectly this
jokowi’s sentiments and 100% for prabowo sentiments. causes sentiment analysis to be a very interesting research
The classification accuracy calculation uses ROCs topic in web data mining. Sentiment analysis on this
method. Final results of the social network analysis based research is the process of classifying people's sentiments
on the calculation of network attributes yielded 277 nodes, into three classes, namely positive sentiment class,
7.950 edges, 57,401 average degree, 56.44 average negative sentiment class, and neutral sentiment class using
weighted degree, network diameter is 4, 1.853 average the naï ve bayes classifier method.
path length, 0.201 density, and 5 of number communities. Social network analysis itself is a knowledge that
Centrality values generates the 5 most influential actors studies the relationship between one entity unit with other
in social network interactions are jokowi’s of first rank, entity units with the help of graph theory [1]. Methods and
2nd SBYudhoyono’s, 3rd detikcom, 4th yjuniardi, 5th techniques of social network analysis were chosen
mohmahfudmd. because this method can provide a picture or visualization
 to the smallest relationship that occurs only one individual
Index Terms—Centrality values, classification, naï ve with other individuals in the network [2]. Using social
bayes classifier, network attributes values, sentiment network analysis, this research was conducted with the
analysis, social network analysis aim of evaluating by modeling information dissemination
 that occurs on the Twitter social network. Network
 visualization uses the undirected network method, then
 I. INTRODUCTION identifies influential actors who have a high number of
 interactions in the network by calculating the concept of
 Less than a year before the Indonesia presidential the value of the centrality node (degree, betweeness,
election, however it appears that political polarization has
 closeness, and eigenvector centrality) [2]. With this
strengthened in all strata of society. The community began

Copyright © 2019 MECS I.J. Modern Education and Computer Science, 2019, 11, 22-30
Analysis of Indonesia Politics Polarization before 2019 President Election Using Sentiment 23
 Analysis and Social Network Analysis

mapping, the issues of political polarization that occur in Backward Elimination. The comparative results of the
social networks, especially Twitter can be known patterns SVM method get the best results with an accuracy of
and roots of the problem, as well as intellectual actors who 81.10% and AUC 0.904. The results of the comparative
hide behind it. feature selection Information Gain get the best results
 with an average accuracy of 84.57% and an average of
 AUC 0.899. The results of the integration of the best
 II. RELATED WORK classification method and the best feature selection
 method resulted in an accuracy of 81.50% and AUC
 Sentiment analysis Research on the classification of
 0.929. These results have increased when compared to
sentiments has been carried out by Bo Pang. In his the results of experiments using SVM without feature
journal, Bo Pang classified sentiments on film reviews selection. The results of testing the feature selection
using various machine learning techniques. The machine
 method is that Information Gain gets the best results for
learning techniques used are Naï ve Bayes, Maximum use on the NB, SVM and ANN methods [19].
Entropy, and Support Vector Machines (SVM). In that
study also used several approaches to perform feature A. Sentiment Analysis
extraction, namely: unigram, unigram, bigram, unigram,
 Sentiment analysis, also known as opinion mining is the
Part of Speech (POS), adjective, and position unigram.
 method used for enabling computers to recognize and
The results of experiments conducted in this study found
 classifying opinions from big unstructured texts datasets
that SVM became the best method when combined with
 with machine language and computer programming. Its
unigram with an accuracy of 82.9% [17].
 main purpose to determine the context and emotion of
 In a study conducted by Rozi, I. F., Pramono, S. H. &
 online text data. Sentiment analysis, concept and
Dahlan, E. A. (2012) an opinion mining system was
 techniques first introduced by Liu, B. He defined
developed to analyze public opinion in tertiary
 sentiments has quintuplet aspect, which are: target object,
institutions. In the subjectivity and target detection
 a feature of the object, the sentiment value of the opinion
subprocesses, Part of Speech (POS) Tagging uses the
 of the opinion holder, the polarity of the opinion and
Hidden Markov Model (HMM). In the results of the POS
 opinion, opinion holder and the time when the opinion is
Tagging process, rules are applied to find out whether a
 expressed [3]. The basic problem of opinion mining is
document is an opinion or not, and to know which part of
 opinion extraction. It is required to know the linguistic
the sentence is the object of the opinion being targeted.
 terms and get the idea from the text classification of
Documents that are recognized as opinions are then
 subjective and objective terms identified by syntactic
classified into negative and positive opinions (subprocess
 features. Another main focus is on subjectivity detection.
opinion orientation) using the Naï ve Bayes Classifier
 Subjectivity is used to express the context or specific
(NBC). Based on these tests obtained precision and recall
 domain of online reviews [4].
values for the subjectivity document subprocesses are
 Nowadays, sentiment analysis has become a large and
0.99 and 0.88, for the target detection subprocesses are
 growing field. In this sentiment analysis approach we used
0.92 and 0.93, and for opinion orientation subprocesses
 supervised methods, because its nature to be generally
are 0.95 and 0.94 [16].
 more accurate than unsupervised approaches. But On the
 Research on classification was also carried out by
 other hand, this method requires labeled training data and
Rodiyansyah, S. F. and Winarko Edi (2013) by
 the goal is to classify an online reviews as referring to one
conducting data mining techniques that are used to
 or more of the aspects. The research to Classification
visualize traffic congestion in a city. In this research the
 sentiment has been done by another researcher with
method used is Naï ve Bayes by combining prior
 various approaches and algorithm. Most of the algorithms
knowledge with new knowledge. From the test results,
 for sentiment analysis are based on a classifier trained
the application shows that the smallest accuracy value of
 using a collection of annotated text data. Before training,
78% is generated in testing with a sample of 100 and
 data is preprocessed so as to extract the main features.
produces a high accuracy value of 91.60% in testing with
 Some classification methods have been proposed: Naï ve
a sample of 13106. The test results with Rapid Miner 5.1
 Bayes Classifier, Support Vector Machine, K Nearest
tools obtained the smallest accuracy value of 72% with a
 Neighbour, etc. However, because its varied result in
sample of 100 and the highest accuracy value of 93.58%
 various research, it is still not clear which of these
with a sample of 13106 for the Naive Bayesian
 classification strategies are the more appropriate to
Classification method, while for the Support Vector
 perform sentiment analysis system [5]. In this study, we
Machine method obtained the smallest accuracy value of
 design a sentiment analysis system to help gain
92% with a sample of 100 and the highest accuracy value
 information and knowledge regarding Indonesian online
of 99.11% with a sample of 13106 [18].
 costumer’s opinion towards Distro’s products and services
 Other studies on the classification of film review
 using Naï ve Bayes Classifier (NBC). NBC is a
sentiments were conducted by Chandani, V., Wahono,
 probabilistic learning algorithm that derives from
RS, & Purwanto (2015) by comparing Machine Learning
 Bayesian decision theory. NBC would combine previous
classification methods such as Naï ve Bayes (NB),
 knowledge with new knowledge. This classification
Support Vector Machines (SVM), and Artificial Neural
 algorithms are simple has performance similar to other
Networks (ANN) and feature selection such as
 approaches. In NBC, the probability of a message being in
Information Gain, Chi Square, Forward Selection and

Copyright © 2019 MECS I.J. Modern Education and Computer Science, 2019, 11, 22-30

24 Analysis of Indonesia Politics Polarization before 2019 President Election Using Sentiment
 Analysis and Social Network Analysis

class c, P( ), is computed as shown in these equation ( )
 ( ) = ∑ (3)
formula:

 ( ) ( | ) Where gjk (ni) = number of shortest paths from node j
 ( | ) = (1) to node k that passes through node i.
 ( )
 gjk = number of shortest paths between 2 nodes in the
where ( | ) is Posterior is an opportunity category j network
when there is the appearance of the word i. ( )Prior is
 3. Closeness Centrality
an opportunity for the appearance of category j. ( | )
conditional probability for word i to be classified for the j Closeness centrality calculates the average distance
category. ( ) is an opportunity for the appearance of a between a node and all other nodes in the network or in
word. other words measures the proximity of a node to another
 node. In a network with g nodes, the closeness of the
B. Social Network Analysis centrality of this node is as follows:
 In the social sciences, social network analysis has
 −1
become a powerful agreement tool in addition to statistics, ( ) = [∑ ] (4)
 ( , )
network concepts that have been approved, approved and
applied in the tradition of research in the social sciences,
 N = number of nodes in the network
ranging from anthropology, sociology, business
 d (ni, nj) = the number of shortest paths connecting
administration and history. SNA focuses on the structure
 nodes ni and nj
of human groups (groups), communities, organizations,
societies, or systems that exist in the world (world 4. Eigenvector centrality
systems). The basis of visualization of social networks is
placed by researchers who refer to themselves as Eigenvector centrality performs measurements that give
sociometric. J.L. Moreno composed a social science called higher weight to nodes connected to other nodes that also
sociometry, which is an interpersonal relationship, those have high centrality values. To calculate the centrality
who communicate society are not an aggregate of eigenvector value of a node can be done using the
individuals and their characteristics, but are a structure of following formula:
interpersonal relationships. Therefore, individuals must
use basic social units. Society (social atom) consists of ( ) = ∑( + )
individuals and social, economic, or cultural relations and ( ) = ( − ) − 1 1 (5)
discussion into groups and ultimately consists of
interrelated groups described in a sociogram (structure of α = normalized constant (vector scale).
relationships between groups). β = symbolizes how much a node has a centrality
 There are several concepts in the approach of social weight in a node which also has a high centrality value [1]
network analysis, in addition to describing the patterns
formed by the relationship between nodes or actors, SNA
is more often used to determine the central node in a III. METHODOLOGY
network, by calculating some centrality values including The methodology used in this study is experimental
those commonly calculated are: research. The basis for making this research experimental
1. Degree Centrality research is a form of Indonesian political polarization in
 the 2019 presidential election, research focused in depth
 Degree centrality is used to count the number of on public sentiment through Twitter accounts namely
interactions a node has. To calculate the degree centrality @jokowi and @prabowo which are used as a comparative
of this node, you can use the following formula: analysis.
 This model is divided into two submodels as describe
 CD (ni) = d (ni) (2) on fig. 1 down below. First submodel is sentiment analysis
 process. This submodel doing the classification process on
 Where d (ni) = the number of interactions that this node input dataset. The second process is social network
has with the other network nodes. analysis. This submodel doing the social network
2. Betweeness Centrality visualization and find the influencer around social
 network.
 Betweeness centrality calculates how often a node is
passed by another node to go to a particular node in the A. Data Crawling using Twitter API
network. This value serves to determine the role of the Develop a Twitter API for crawling the tweets. The
actor who is a bridge connecting interaction in the Twitter API directly communicate with the source. The
network. To calculate the degree centrality of a node, you Access keys and tokens are established that helps in
can use the following formula: communication over Twitter Server. The data is

Copyright © 2019 MECS I.J. Modern Education and Computer Science, 2019, 11, 22-30
Analysis of Indonesia Politics Polarization before 2019 President Election Using Sentiment 25
 Analysis and Social Network Analysis

 1. Document Filtering
 This process aims to eliminate words or symbols that
 are not needed to reduce noise during the classification
 process, so that the list of words stored by the machine
 becomes more effective and efficient for the next process.
 The words and symbols that were omitted include:

 a. URL (http://)
 b. RT (RT)
 c. Mention (@username)
 d. Hashtag (#)
 2. Case Folding
 Text in tweets tends to have a variety of writing, one of
 which is writing uppercase and lowercase letters. The
 solution to this problem is that the text will be changed in
 lowercase letters. Another purpose of the case folding
 process is to equalize the context of a word, because the
 machine will assume two different words based on the use
 of uppercase or lowercase letters even though the shape is
 the same.
 3. Remove Duplicate
 This process uses the remove duplicate operator to
 Fig. 1 Research Process handle duplicate sentences. The remove duplicate process
 is performed on the text attribute. The following are the
 Indonesian political polarization tweet. This data was results of the Tweet after going through the process of
obtained from April 1 2019 to April 16 2019, exactly a removing duplicates. The delete duplicate operator will
day before the Indonesia president elections held on April eliminate duplicate sentences and save the last Tweets
17 2019. The process of crawling data was carried out saved according to the order of the lines on the system.
using Rstudio and R programming language.
 4. Tokenization
B. Preprocessing for Sentiment Analysis
 This process will break up a set of characters in a text
 The data from Twitter contains various type of contents into units of words. This is done by distinguishing certain
such as url, emoticons, spaces, hashtag, etc. which should characters that can be treated as separators. Examples of
be removed before next process. This process can highly separating characters such as whitespace, enter, tabulation,
increase the accuracy of result. and spaces are considered word separators.
 Table 1. Illustration of preprocessing
 Process Text
 Data Example RT @adianna70fans: Adian Napitupulu Praised Jokowi
 about the Land Title Deed Distribution Program, because
 it was real work #realwork
 Twitter for Android
 URL Remove RT @adianna70fans: Adian Napitupulu Praised Jokowi
 about the Land Title Deed Distribution Program, because
 it was real work #realwork
 RT Remove @adianna70fans: Adian Napitupulu Praised Jokowi
 about the Land Title Deed Distribution Program, because
 it was real work #realwork
 Mention Remove Adian Napitupulu Praised Jokowi about the Land Title
 Deed Distribution Program, because it was real work
 #realwork
 Hashtag Remove Adian Napitupulu Praised Jokowi about the Land Title
 Deed Distribution Program, because it was real work
 Case Folding adian napitupulu praised jokowi about the land title deed
 distribution program, because it was real work
 Tokenization adian napitupulu praised jokowi about the land title deed
 distribution program, because it was real work

Copyright © 2019 MECS I.J. Modern Education and Computer Science, 2019, 11, 22-30
26 Analysis of Indonesia Politics Polarization before 2019 President Election Using Sentiment
 Analysis and Social Network Analysis

Before Remove Duplicate
 Status Date Text
 5 April 2019 adian napitupulu praised jokowi
 about the land title deed
 06:02:33 distribution program, because it
 Removed was real work

 5 April 2019 adian napitupulu praised jokowi
 about the land title deed
 06:08:54 distribution program, because it
 was real work

After Remove Duplicate
 Date Text
 5 April 2019 adian napitupulu praised jokowi about the land
 title deed distribution program, because it was
 06:08:54 real work

C. Preprocessing for Social Network Analysis synonym and its polarity. The synonym represents the
 similar word meaning which will be having same polarity.
 In this process we use twecoll for fetching data from
 The polarity represents the positivity and negativity of the
Twitter. Twecoll is a Twitter command-line tool written in
 word in the context of the sentence.
Python. It can be used to retrieve data from Twitter and
purge likes (its only data-altering feature). It is based on a Steps:
sub-command principle meaning calls to twecoll are based
on a keyword which instructs twecoll what to do. Running 1. Data Crawling (data were crawled using API
twecoll requires Python 2.7 and the argparse library. Next Twitter divided into 2 datasets).
step after got all the necessary data is combine it. We do 2. Positive and negative sentiments were kept in
that by using the edgelist command. Per default it creates two files pos.txt and neg.txt as data training
a .gml file and tries to create a visualization with python
 3. Preprocessing
package igraph. The igraph library is optional and is used
to generate a clustered graph of the network. 4. Implementing naï ve bayes classifier for
 The stages in this process can be explained as follows: calculated the score of each sentiment
 5. The classifier was trained using the dataset just
 1. Identification problem: Indonesia political prepared
 polarization ahead of the 2019 president election.
 6. Labelled sentiments were kept correctly in
 2. Data extraction: extracting and collecting data uses
 reference sets and the predicatively labelled
 data crawling. version in data testing
 3. Preprocessing: data preparation which eliminates
 noise in data. 7. Metrics were calculated accordingly
 4. Implementating: processing the network
 interactions, the interaction patterns are visualized The result is down below:
 using undirected graph.
 5. Network Measure: calculating network attribute
 values that counts eight attributes such as total
 nodes, total edges, average degree, average
 weighted degree, network diameter, average path
 length, density, and number of communities.
 6. Centrality Measure: calculating centrality value
 such as harmonic closeness, page rank, closeness
 centrality, and eigenvector centrality.
 7. Rank: ranking the centrality values in the network
 to find influencers.

 IV. IMPLEMENTATION
A. Implementing Naïve Bayes Classifier
 To implement naï ve bayes classsifier we need a trained Fig. 2. Jokowi’s Polarity
word dictionary. It consists of collection of word with its

Copyright © 2019 MECS I.J. Modern Education and Computer Science, 2019, 11, 22-30
Analysis of Indonesia Politics Polarization before 2019 President Election Using Sentiment 27
 Analysis and Social Network Analysis

 The picture above shows the results of the classification B. Implementing ROC Validation
sentiments towards Jokowi in jokowi dataset. The amount
 Testing the results of the sentiment classification is
of positive sentiment acquisition tends to be lame with
 done with the Receiver Operating Characteristic (ROC)
negative sentiment. Positive sentiment towards Jokowi
 curve. This curve shows accuracy and compares the visual
amounted to 882 or 92.65% of the total sentiment, while
 classification which shows the true positive level and the
for negative sentiment it amounted to 56 or 5.88%, and for
 false positive rate. The ROC curve has a diagnostic value,
neutral sentiment it amounted to 14 or 1.47% of the total
 which is:
sentiment implemented. Based on the above results it can
be concluded that the majority sentiment for Jokowi is
 A. Accuracy is 0.90 - 1.00 = very good classification
positive. The following is an example of sentiment from
 b. Accuracy is worth 0.80 to 0.90 = good classification
Jokowi's sentiment classification results.
 c. The accuracy is 0.70 - 0.80 = fair classification
 Table 2. Jokowi’s Sentiment Classification
 d. Accuracy is 0.60 - 0.70 = bad classification
 e. Accuracy is 0.50 - 0.60 = failure
 Sentiment Text

 Positive good luck for president joko widodo, whom we love The results obtained from ROC processing for the
 results of the "Jokowi" sentiment analysis of 0.69 with a
 Negative perpetrators who threaten beheaded jokowi admitted
 i was emotional poor diagnosis classification level and for "Prabowo"
 sentiment of 1.00 with an excellent classification
 Neutral president joko widodo jokowi launched the diagnosis level can be shown in the following below:
 indonesian sharia economic master plan

 Fig.4. ROC Curve

 C. Implementing Social Network Analysis
 This process is carried out by visualizing the data
 interaction network of political polarization information
 Fig. 3. Prabowo’s Polarity
 dissemination that occurs in Indonesia on the social
 The picture above shows the results of the sentiment networking site Twitter by using the Gephi tool version
classification of Prabowo in prabowo dataset. The amount 0.9.2. The data is visualized into a sociogram where the
of positive sentiment obtained has almost the same value point in the image is called a node or node that represents
as Jokowi's sentiment. Positive sentiments towards an individual connected by a line called edge. Two
Prabowo amounted to 943 or 89.99% of total sentiments, connected nodes are represented by a line connecting the
while negative sentiments amounted to 95 or 9.06%, and two. Network visualization using the Frutcherman
neutral sentiments amounted to 10 or 0.95% of the total Reingold algorithm and Force Atlas. The following are the
implemented sentiments. Based on the above results it can results of the process of implementing social network
be concluded that the majority sentiment for Prabowo is analysis.
positive. The following are examples of sentiments from
 Table 4. Network Attributes Value
the results of Prabowo's sentiment classification.
 Network Attributes Value
 Table 3. Prabowo’s Sentiment Classification Total Nodes 277
 Sentiment Text Total Edges 7.950
 Average Degree 57.401
 Positive god willing, prabowo and sandiaga is just waiting for
 the official time to be announced Average Weighted Degree 56.44

 Negative don't be afraid of scaring us with weapons given by Network Diameter 4
 the folks Average Path Length 1.853
 Neutral president prabowo subianto's will to all indonesians Density 0.201
 Number of Communities 5

Copyright © 2019 MECS I.J. Modern Education and Computer Science, 2019, 11, 22-30
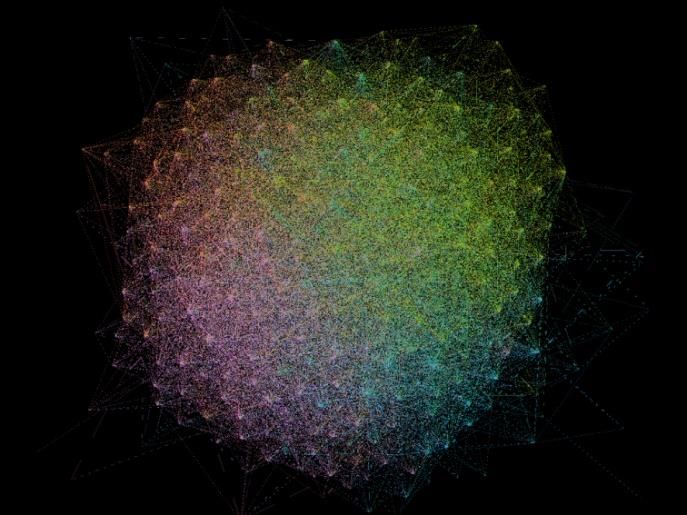
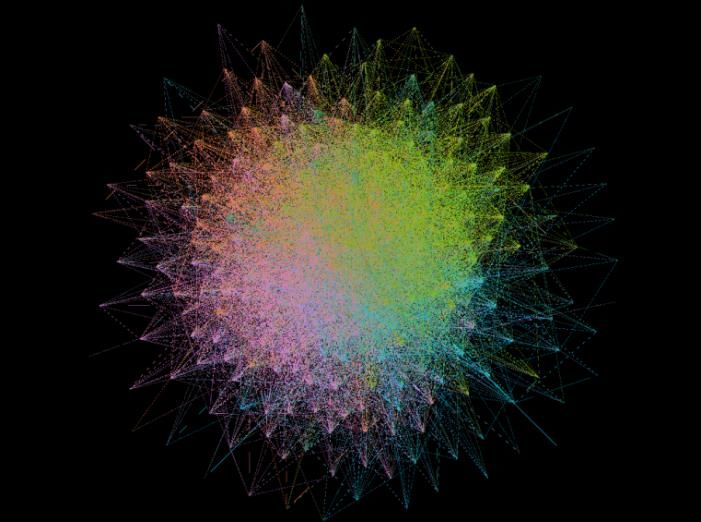
28 Analysis of Indonesia Politics Polarization before 2019 President Election Using Sentiment
 Analysis and Social Network Analysis

 The second visualization was done using the Force
 Atlas algorithm. The network that is formed although it is
 difficult to see it in plain sight, but the location between
 individuals tends to be more tenuous compared to using
 the Frutcherman Reingold algorithm, making it more
 possible to use the Force Atlas algorithm to implement
 complex data. Based on the results of the two algorithms
 above, the spread of network interactions is divided into
 five major communities. Here are the central actors in
 each community in the network the formula mentioned
 above, the results of the centrality calculation are as
 follows.

 Table 5. Central Actor
 Communities Actor
 Fig.5 Frutcherman Reingold Implementation
 Dark Green SBYudhoyono
 The first visualization was done using the Frutcherman Light Green Mohmahfudmd
Reingold algorithm. The network formed is very difficult
to see because the location of the nodes is very close Orange Yjuniardi
together and difficult to identify with the naked eye. It can Blue Detikcom
be concluded that these individuals are quite close to one
 Purple Jokowi
another.

 Based on the calculation above, it is known that the
 Jokowi actor excels at all centrality values, so it can be
 said that the Jokowi actor is the most influential actor in
 the Indonesian political polarization interaction network
 on Twitter. The SBYudhoyono actor also has a stable
 calculation from the various centrality calculations above
 and it can be said that the SBYudhoyono actor was ranked
 second as an influential actor.

 Fig.6 Force Atlas Implementation

 Table 6. Centrality Value
 Betweeness Degree Closeness Centrality Eigenvector
 Actor Centrality Centrality Centrality

 Score Score Score Score
 SBYudhoyono 704.5 136 0.6618 0.9267
 mohmahfudmd 432.4 120 0.6344 0.8340
 yjuniardi 422.7 119 0.6359 0.8487
 detikcom 712.9 132 0.6524 0.8577
 jokowi 1087.7 156 0.6969 1.0

 dataset (89.99% positive sentiment, 9.06% negative
 V. RESULT AND FUTURE WORKS sentiment, and 0.95% neutral sentiment. The accuracy
 Data collection on Indonesian political polarization results obtained from ROC processing for the jokowi’s
using data crawling, the programming language used is R dataset is 0.69 with a poor diagnosis classification level
language. Based on the results of sentiment classification and for prabowo’s dataset is 1.00 with an excellent
of Indonesian political polarization, on the jokowi’s classification. One important thing that affects the
dataset (92.65% positive sentiment, 5.88% negative outcome of accuracy is the amount of training data used,
sentiment, and 1.47% neutral sentiment) and prabowo’s the more data the training used will be the higher the

Copyright © 2019 MECS I.J. Modern Education and Computer Science, 2019, 11, 22-30
Analysis of Indonesia Politics Polarization before 2019 President Election Using Sentiment 29
 Analysis and Social Network Analysis

accuracy. Mistakes in preprocessing can also affect [12] Cheliotis, D. G. (2010). Social Network Analysis (SNA).
overall accuracy. The results of the representation of National University of Singapore, Singapore.
relations between Indonesian political entities produced 5 [13] The Computer Advisor. Web site scraper the most
large communities in the network. Interconnected actors effective tool for web data extraction, Retrieved
 November 28, 2018 from:
numbered 277 and 7,950 relations. Based on the http://www.thecomputeradvisor.net/web-site-scraper-the-
calculation of centrality value, the account of Jokowi is most-effective-tool-for-web-data-extraction /
first rank as the account that most influences the course of [14] Vatrapu Ravi, Raghava Rao, Abid Hussain. (2016). Social
interaction in the network. The second rank is occupied by Set Analysis: A Set Theoretical Approach to Big Data.
the SBYudhoyono account and the detikcom account as Copenhagen Business School, Computational Social
third rank. Science Laboratory, Frederiksberg, Denmark
 Suggestions for further research are as follows: It is [15] Mujilahwati Siti. (2016). Pre-Processing Text Mining
necessary to use the server to retrieve data from the pada Data Twitter. Universitas Islam Lamongan,
crawler automatically every time, this needs to be done Lamongan.
 [16] Rozi, Imam Fahrur; Pramono, Sholeh Hadi, Dahlan, Erfan
because Twitter API limits the time of withdrawal of Achmad. Implementasi Opinion Mining (Analisis
tweets. Choosing tweets that really contain community Sentimen) untuk Ekstraksi Data Opini Publik pada
opinion according to the topic. Add a collection of words Perguruan Tinggi. Jurnal EECCIS, [S.l.], v. 6, n. 1, p. pp.
to the data dictionary so that the classification provided 37-43, mar. 2013. ISSN 2460-8122. Available at:
can be more accurate. Adding several stages in . Date accessed: 26 Maret 2019
and adding abbreviations and non-formal language that is [17] Bo Pang, Lillian Lee, Shivakumar Vaithyanathan.
not in accordance with the dictionary. Sentiment Classification Using Machine Learning
 Techniques.EMNLP '02 Proceedings of the ACL-02
 REFERENCES conference on Empirical methods in natural language
 processing - Volume 10 Pages 79-86.
[1] Asri Maspupah, Asep ID Hadiana. (2018). Pemetaan [18] Rodiyansyah, Sandi Fajar; Winarko, Edi. Klasifikasi
 Bidang Keilmuan Organisasi Dengan Social Network Posting Twitter Kemacetan Lalu Lintas Kota Bandung
 Analysis. Universitas Jenderal Ahmad Yani, Bandung. Menggunakan Naive Bayesian Classification. IJCCS
[2] Mahdi Shiddieqy, Dodie Tricahyono. (2017). (Indonesian Journal of Computing and Cybernetics
 Impementasi Social Network Analysis dalam Penyebaran Systems), [S.l.], v. 6, n. 1, jan. 2013. ISSN 2460-7258.
 Country Branding “Wonderful Indonesia”. Universitas Available at:
 Telkom, Bandung. . Date
[3] Liu B, “sentiment analysis and subjectivity, Hanbook of accessed: 26 Maret. 2019.
 natural language processing”, vol.2, pp 627-666, 2010 [19] Vinita Chandani, Romi Satria Wahono, Purwanto. 2015.
[4] S Padmajal and Prof. S. Sameen Fatima, “Opinion Mining Komparasi Algoritma Klasifikasi Machine Learning Dan
 and Sentiment Analysis -An assessment of People’s Belief: Feature Selection pada Analisis Sentimen Review
 A Survey, International Journal of Ad hoc, Sensor & Film.Universitas Dian Nuswantoro, Semarang.
 Ubiquitous Computing (IJASUC) Vol. 4 No. 1, February [20] Nur Azizah Vidya. 2015. Twitter Sentiment Analysis
 2013 Terhadap Brand Reputation: Studi Kasus PT XL
[5] G. Fiarni, C., Maharani, H., & Pratama, R. (2016). AXIATA Tbk. Universitas Indonesia, Jakarta.
 Sentiment analysis system for Indonesia online retail shop [21] Jurafsky, D S. (2000). Speech and Language Processing
 review using hierarchy Naive Bayes technique. 2016 4th "An Introduction to Natural Language Processing,
 International Conference on Information and Cmputationak Linguistics, and Specch Reconition.
 Communication Technology (ICoICT) Prentice-Hall, Inc. New Jersey.
[6] Parveen, H., & Pandey, S. (2016). Sentiment analysis on [22] M. Yusuf Nur Sumarno Putro. 2011 “Analisis Sentimen
 Twitter Data-set using Naive Bayes algorithm. 2016 2nd pada Dokumen berbahasa Indonesia dengan Pendekatan
 International Conference on Applied and Theoretical Support Vector Machine”. Masters, Binus.
 Computing and Communication Technology (iCATccT) [23] Rustiana, deden. 2017. Analisis sentiment pasar otomotif
[7] Yusainy Cleoputri, Anif Fatma Chawa, Siti Kholifah. mobil: tweet twitter Jurnal simetris, vol 8. No 1. April
 (2017). Social Data Analytics sebagai Metode Alternatif 2017
 dalam Riset Psikologi. Universitas Brawijaya, Malang. [24] Novantirani A, Sabariah MK, Effendy V. 2004. Analisis
[8] Hu Jie, Junchi Zhang, Mengchi Liu. (2014). A Semantic Sentimen pada Twitter mengenai Penggunaan
 Model for Academic Social Network Analysis. Hubei Transportasi Umum Darat dalam Kota dengan Metode
 University, Wuhan. Support Vector Machine. Universitas Telkom, Bandung.
[9] Jaka Eka S, Erwin Budi S., Abdurahman Baizal (2018). [25] Putranti, Noviah Dwi, Winarko, Edi. Analisis Sentimen
 Data Crawling pada Twitter. Telkom University, Bandung. Twitter untuk Teks Berbahasa Indonesia dengan
[10] Liu Guojun, Zhang Ming, Fei Yan. (2010). Large – Scale Maximum Entropy dan Support Vector Machine. IJCCS
 Social Network Analysis based on MapReduce. Peking (Indonesian Journal of Computing and Cybernetics
 University, Beijing. Systems), [S.l.], v. 8, n. 1, p. 91-100, jan. 2014. ISSN
[11] Akhtar Nadeem. (2014). Social Network Analysis Tools. 2460-7258. Available at:
 Aligarh Muslim University. Aligarh . Date
 accessed: 26 Maret. 2019.

Copyright © 2019 MECS I.J. Modern Education and Computer Science, 2019, 11, 22-30
30 Analysis of Indonesia Politics Polarization before 2019 President Election Using Sentiment
 Analysis and Social Network Analysis

Authors’ Profiles Sunjana: He is a lecturer in
 Informatics at the Faculty of
 Mohammad Nur Habibi: He has Engineering of Widyatama University.
 completed his Bachelor of Computer In teaching, he has been focusing in
 Science from Widyatama University artificial intelligence, numerical
 on Faculty of Engineering. His areas method, and machine learning. In
 interest are data mining, business research, his current interests include
 intelligence, and social network numerical analysis, machine learning,
 analysis. and data science.

How to cite this paper: Mohammad Nur Habibi, Sunjana, " Analysis of Indonesia Politics Polarization before 2019
President Election Using Sentiment Analysis and Social Network Analysis ", International Journal of Modern
Education and Computer Science(IJMECS), Vol.11, No.11, pp. 22-30, 2019.DOI: 10.5815/ijmecs.2019.11.04

Copyright © 2019 MECS I.J. Modern Education and Computer Science, 2019, 11, 22-30
You can also read