Impact of local network characteristics on network reconstruction
←
→
Page content transcription
If your browser does not render page correctly, please read the page content below
PHYSICAL REVIEW E 103, 022305 (2021)

                          Impact of local network characteristics on network reconstruction

                                    Gloria Cecchini ,1,2,* Rok Cestnik ,2,3,* and Arkady Pikovsky2,4
                    1
                       CSDC, Department of Physics and Astronomy, University of Florence, Sesto Fiorentino, Florence, Italy
  2
    Institute of Physics and Astronomy, University of Potsdam, Campus Golm, Karl-Liebknecht-Straße 24/25, 14476 Potsdam-Golm, Germany
3
  Faculty of Behavioural and Movement Sciences, Vrije Universiteit Amsterdam, Van der Boechorststraat 7, 1081 BT Amsterdam, Netherlands
         4
           Department of Control Theory, Lobachevsky University of Nizhny Novgorod, Gagarin Av. 23, 603950, Nizhny Novgorod, Russia

                                   (Received 3 August 2020; accepted 12 January 2021; published 8 February 2021)

                    When a network is inferred from data, two types of errors can occur: false positive and false negative
                 conclusions about the presence of links. We focus on the influence of local network characteristics on the
                 probability α of false positive conclusions, and on the probability β of false negative conclusions, in the case
                 of networks of coupled oscillators. We demonstrate that false conclusion probabilities are influenced by local
                 connectivity measures such as the shortest path length and the detour degree, which can also be estimated from
                 the inferred network when the true underlying network is not known a priori. These measures can then be used
                 for quantification of the confidence level of link conclusions, and for improving the network reconstruction via
                 advanced concepts of link weights thresholding.

                 DOI: 10.1103/PhysRevE.103.022305

                         I. INTRODUCTION                                   reliable reconstruction is to minimize both these probabilities
                                                                           simultaneously.
    Complex systems are of key interest in multiple scientific
                                                                               In [28–30], the analysis of the errors of both types was
fields, ranging from medicine, physics, mathematics, engi-
                                                                           focused on the influence of false positive and false negative
neering, economics, etc. [1–4]. Many complex systems can be
                                                                           conclusions about links on the reconstructed network charac-
modeled, or represented as dynamical networks, where nodes
                                                                           teristics. It was demonstrated, that within the same network
are the dynamical elements and links represent the interac-
                                                                           topology, the values for α and β, leading to the least biased
tions between them. In this context, networks are widely used
                                                                           network characterization, change depending on the network
in studies of synchronization phenomena of coupled oscilla-
                                                                           property of interest. In this paper, the analysis is reversed: the
tors as well as in the analysis of chaotic behavior in complex
                                                                           study focuses on the influence of network characteristics on
dynamical systems [5–8]. A deep understanding of network
                                                                           the probabilities of type I and type II errors.
characteristics allows controlling the network dynamics [9],
                                                                               Below, we first assume the knowledge of the true under-
e.g., in case of optimizing vaccination strategies with the aim
                                                                           lying network. In Sec. III we perform a simulation study to
of controlling the spread of diseases [10]. Very often one faces
                                                                           show the dependence of the probability of false positive and
an inverse problem: the underlying network is not known,
                                                                           false negative links on their shortest path length and their
and a reliable inferring of the network structure from the ob-
                                                                           detour degree (defined later in Sec. II A). In Sec. IV, these
servation is crucial for understanding the system’s operation
                                                                           results are applied to a scenario where the underlying network
[11–20].
                                                                           is unknown a priori, so we evaluate the shortest path length
    When a network is to be inferred from observation data,
                                                                           and of the detour degree from the reconstruction to improve
typical analysis techniques provide measures of connectivity
                                                                           the quality of the latter, i.e., to decrease the number of falsely
strength for each link. Several methods have been suggested
                                                                           concluded links.
in the literature to reconstruct the network structure and de-
cide whether these measures pass a certain threshold, thereby
providing a means to decide if the corresponding links are
considered as present or not [21–27].                                                     II. NETWORKS AND METHODS
    If a nonexisting link is erroneously detected, it is called
                                                                               In this section we present some network definitions which
a false positive link and is referred to as a type I error.
                                                                           are necessary for the understanding of the paper. A network
Likewise, an existing link that remains undetected is called
                                                                           is defined as a set of nodes with links between them [31]. In
a false negative link and is referred to as a type II error
                                                                           graph theory, a branch of mathematics that studies networks,
[see Fig. 1(a)]. The probability of detecting a false positive
                                                                           a different notation is used: networks are called graphs, and
link is usually denoted by α, while β denotes the probabil-
                                                                           nodes and links are called vertices and edges, respectively.
ity that an existing link remains undetected. The goal of a
                                                                           Below, the notations from network theory and graph theory
                                                                           are used synonymously.
                                                                               In this paper, Erdős-Rényi networks are used for the simu-
 *
     These authors contributed equally to this work.                       lation study. Erdős-Rényi networks are random networks in

2470-0045/2021/103(2)/022305(8)                                     022305-1                                 ©2021 American Physical Society
CECCHINI, CESTNIK, AND PIKOVSKY                                                                 PHYSICAL REVIEW E 103, 022305 (2021)

       (a)                                                               nodes. Namely, for every oriented node pair i → j, the detour
                              True        Reconstructed                  degree is the number of oriented paths of length 2 from i to
                                                                          j. For example, in the case shown in Fig. 1(b), the DD is
           True pos.                                                     i j = 2, corresponding to two directed paths of length 2 from
                                                                         i to j through v1 and v3 . Since the edge between v4 and j
           False pos.
                                                                         is oriented towards v4 , a path from i to j through v4 does
           False neg.                                                    not exist. Similarly to the SPL, the DD is nonsymmetric for
           True neg.                                                     directed networks. Notice also some connection between the
                                                                         SPL and the DD: if i j  3, then i j = 0.

       (b)                                                                                     B. Weighted networks
                       v1                 v2                                 Often it is useful to define a network where links are not
                                                                         binary connections, but are instead described by continuous
                                                                         weights. The adjacency matrix elements of weighted networks
             i                   j                    k                  are real numbers. Definitions provided in the previous section
                                                                         for the SPL, iSPL, and the DD in binary networks are here
                                                                         generalized for weighted networks.
                       v3                 v4                                 We consider the direct path length from node i to node j to
                                                                         be the inverse of the corresponding adjacency matrix element
      FIG. 1. (a) Outline scheme for different types of reconstructed    Ai j [32] or, in other words, the inverse of the link weight.
links with respect to the true ones. (b) Example of a network with de-   Therefore, the SPL from node i to node j is the minimal sum
tour degrees (DDs) i j = 2 and  jk = 0, shortest path length (SPL)     of pairwise path lengths for all available paths between i and
i j =  jk = 1 and ik = 2, indirected shortest path length (iSPL)
                                                                         j, i.e.,
˜i j = 2 and ˜ jk = 3. Notice also that ˜ik = ik = 2.
                                                                                          i j = min A−1               −1
                                                                                                        ik1 + · · · + Akn j ,        (2)
which the set of nodes is fixed, and each pair of nodes is               where nodes k1 through kn belong to all possible paths from i
connected with independent probability p.                                to j (for iSPL the direct path is excluded from consideration).
                                                                         Note that for binary networks, this definition is coherent with
                        A. Binary networks
                                                                         the one in the previous section. For a binary network, an
                                                                         existing link corresponds to weight 1 and an absent link to
    The adjacency matrix A of a binary network with n nodes              weight 0, the latter would lead to an infinite contribution in
is an n × n matrix with elements                                         the sum. Therefore, Eq. (2) reduces to the number of links
                                                                        separating i and j if the shortest path is taken. As a side note,
               1 if there is link from node i to node j,
       Ai j =                                            (1)             one can draw a parallel here with circuit theory [33], with
               0 otherwise.
                                                                         link weights representing directed conductances, making the
Networks can be directed or undirected. In an undirected                 shortest path correspond to the path of least resistance and the
network, connection from i to j implies the connection from              SPL quantify its effective resistance.
 j to i. Note that this implies that the adjacency matrix is                The DD of an oriented node pair i → j measures the
symmetric. In a directed network, this symmetry is broken,               contribution of all the possible two-step paths from i to j.
therefore, if a path from i to j exists, a path from j to i does         In weighted networks, such a contribution must consider the
not necessarily exist. We will consider directed networks and            weights of the edges. Namely, the DD is scaled by the product
hence nonsymmetric adjacency matrices.                                   of weights of the two edges that form the two-step path
      For two randomly selected nodes i, j in a network of n
nodes, the shortest path length (SPL) i j measures the num-                                    i j =      Aik Ak j .                 (3)
                                                                                                          k
ber of links separating them if the shortest path is taken.
For connected nodes i, j, i.e., when the oriented edge i → j             For binary networks, this definition is coherent with the def-
exists, the SPL is i j = 1. For directed networks generally             inition in the previous section since for Akh ∈ {0, 1}, Eq. (3)
i j =  ji . For reasons explained in a later Sec. III A, we will      reduces to the total number of paths of length 2 from node i
also be considering a generalization of SPL, i.e., the indirect          to node j. In the circuit theory analogy [33], the DD roughly
shortest path length (iSPL) ˜i j . Namely, iSPL is the shortest         corresponds to the effective conductance of all paths of length
                                                                                           A A
path length when the direct link, if it exists, is disregarded.          2 (that would be k Aikik+Ak jk j ). Note that, in both the binary and
For binary networks therefore, iSPL is larger or equal to 2,             weighted cases, Eq. (3) can be expressed elegantly in matrix
˜i j  2. Notice also that in case the considered link is not           form as  = A2 .
present, iSPL and SPL coincide. A simple network example
with evaluated SPLs and iSPLs is depicted in Fig. 1(b).
      Inspired by the idea of a local clustering coefficient [31],                        C. Network inference examples
a unique network characteristic, which we refer to as the                    It is not a goal of this study to develop a novel network
detour degree (DD) i j , is defined here. Detour degree is              inference method; rather, we take methods from the previous
a pairwise measure that quantifies detours between a pair of             literature and consider how they are affected by the network

                                                                   022305-2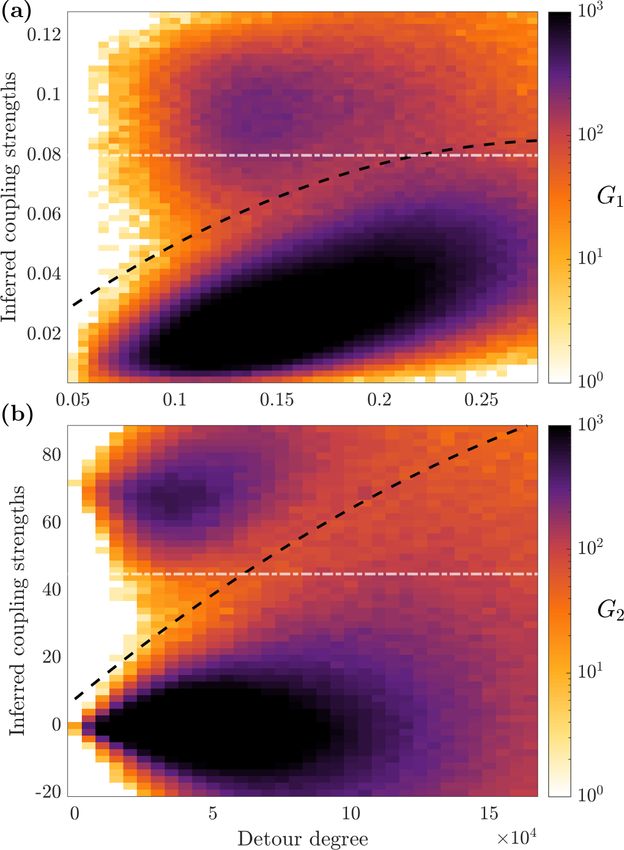
IMPACT OF LOCAL NETWORK CHARACTERISTICS ON …                                                          PHYSICAL REVIEW E 103, 022305 (2021)

    FIG. 2. Inferred coupling strengths, relationship of α and β as function of the iSPL and DD using two inference techniques: G1 [(a), (c),
(e)] and G2 [(b), (d), (f)]. (a), (b) Histograms of the inferred coupling strengths and selected threshold (0.08 for G1 and 45 for G2 ) used for
(c)–(f). (c), (d) Probability of false positive α (in blue asterisks) and probability of false negative β (in red triangles) as functions of the iSPL.
(e), (f) Probabilities of α (blue asterisks) and β (red triangles) as functions of the DD for a specific value of the threshold.

properties. We perform our studies with two network infer-                   curves Zk (which we do not use in the analysis below) and
ence techniques. The first one takes continuous signals of                   real values (positive and negative) for interactions Tk j . For
all oscillators and assumes they follow the Kuramoto model                   details, see Ref. [5]. A network, inferred using this technique,
dynamics [4]:                                                                is indicated in this paper with G2 , and Fig. 2(b) shows an
                                                                            example of inferred coupling strengths.
            φ̇k = ωk +    Tk j sin(φ j − φk − jk ),   (4)
                             j
                                                                                   III. DEPENDENCE OF FALSE CONCLUSIONS ON
where  is the coupling strength, φk the phases, ωk the natural                            NETWORK CHARACTERISTICS
frequencies, and jk phase shifts. It returns, based on the
                                                                                 This section focuses on the dependence of false positive
maximum likelihood approximation of the phase dynamics,
                                                                             and false negative link conclusions on the network charac-
both the phase shifts jk (which we do not use in the analysis
                                                                             teristics introduced in Sec. II. To this aim, we simulate an
below) and strictly positive values for interactions Tk j . For
                                                                             ensemble of oscillatory networks, and infer their connectivity
details, see Ref. [21]. A network inferred using this technique
                                                                             from limited observations of its time series. We consider two
is indicated in this paper with G1 , and Fig. 2(a) shows an
                                                                             different inference techniques, both of which yield continuous
example of inferred coupling strengths.
                                                                             values for link weights (see Sec. II C).
   The second technique is designed for pulse-coupled oscil-
                                                                                 We denote the true network’s binary adjacency matrix with
lators. It takes the observed spike times and assumes that the
                                                                             T and the inferred weighted one with W . The aim is to recon-
interaction can be well represented with a network based on
                                                                             struct the original binary network T from the inferred one W ,
the Winfree phase equation [34]
                                                                             i.e., determine on the basis of link weights Wi j whether the

              φ̇k = ωk + Zk (φk )    Tk j δ(t − t j ),      (5)             links are present or not. This is typically done by thresholding
                                        j
                                                                             the weights, i.e., if an inferred link weight passes a certain
                                                                             threshold, the link is assumed to be present.
where Zk (φ) is the phase response curve and t j are the spike                   The inferred coupling strengths Wi j have a certain distri-
times of oscillator j. It returns, based on minimizing the sim-              bution [see Figs. 2(a) and 2(b) as an example]. The shape of
ulated phase error at times of spikes, both the phase response               this distribution is affected by many factors, the main being

                                                                     022305-3
CECCHINI, CESTNIK, AND PIKOVSKY PHYSICAL REVIEW E 103, 022305 (2021)
the network topology and the inference method itself: how The false conclusion rates for different values of iSPL are
the inferred weights are scattered due to data limitations and depicted in Figs. 2(c) and 2(d). What we observe is that false
unaccounted effects. Consequently, depending on the chosen conclusions happen more often for links with shorter iSPL.
threshold value, different numbers of false positive and false This observation can be explained using the following reason-
negative conclusions occur. This is commonly represented ing: the smaller the (indirect) distance between two nodes, the
with a receiver operating characteristic, commonly referred to more they influence each other via indirect coupling, which
as a ROC curve [35]. In this paper the interest is focused on can disrupt the inference algorithms [5,21] into misinterpret-
the influence of the probabilities of false conclusions on the ing the connectivity. This holds true for both α and β [see
local network characteristics SPL and DD. Figs. 2(c) and 2(d)].
The simulation study is performed on Erdős-Rényi net- We perform a similar analysis using the DD in place of
works with n = 100 nodes and probability of connection the iSPL [Figs. 2(e) and 2(f)]. The probabilities of false con-
p = 0.15. In particular, for G1 the frequencies ωk are uni- clusions α and β are evaluated for subsets of links with the
formly distributed within the interval (0.5,1.5), the phase same DD. We find that both α and β typically increase with
shifts jk are uniformly distributed in the interval (0, 2π ), the DD. This can again be explained by the same reasoning
the original coupling strength is set to = 0.3, and 500 data we used when considering iSPL, namely, if the DD is low,
points are used to perform the network inference. For G2 , the the indirect interaction between the nodes is low regardless of
frequencies ωk are uniformly distributed within the interval whether the direct connection exists or not. This means that
(1.0,2.0), the coupling strength is set to = 0.5, all oscil- there are less interferences to be picked up by the inference
lators are assigned the same phase response curve: Z (ϕ) = algorithms. These dependencies are depicted in Figs. 2(e) and
− sin(ϕ) exp[3 cos(ϕ − 0.9π )]/ exp(3), and all spikes that oc- 2(f).
cur within 500 observed periods of the slowest oscillator are Here, we point out that the DD is effectively a measure of
considered for network inference. We perform 100 simula- connectivity while iSPL is a measure of detachment, i.e., they
tions of each network to have enough statistical data. For both measure opposite things. In circuit theory, analogy DD is a
G1 and G2 the parameters are chosen such that the weight measure of effective conductance while iSPL is a measure of
distributions of present and absent links significantly overlap effective resistance.
[see Figs. 2(a) and 2(b)]. The main way in which this is
achieved is by limiting the amount of data available to the
inference techniques: with fewer observations, the inference IV. WHEN THE TRUE GRAPH IS UNKNOWN
of connectivity is less accurate, which is reflected in the width
of the distributions. A. Using network characteristics from the reconstruction
As we have seen in Sec. III A, false conclusion probability
increases with the measure of indirect distance between nodes,
i.e., it increases with iSPL and decreases with DD. The study
False conclusions with respect to local network structures presented above will be now reversed: suppose the true net-
In this section we study how the inferred weights, and work T is not known and we only have access to the inferred
therefore false conclusions, depend on the local characteristics wights W . In this section we investigate the possibility of
of the true network T , namely, the shortest path length (SPL) using local network information of the inferred graph W to
and the detour degree (DD). Since T is binary, the values gain additional insight on the probability of link existence.
of SPL and DD are integers. It is worth noting here that we We can evaluate iSPL with Eq. (2), and DD with Eq. (3)
consider that all possible links i → j can be falsely identified on the inferred network W . If any weights are negative, we
regardless whether they are present in T or not. Their presence take their absolute value, the reasoning being that we are inter-
simply determines whether they are candidates for a false ested in the estimated interaction between nodes and negative
positive conclusion (not present in T ), or a false negative one weights represent a kind of interactions as well. Then, we
(present in T ). compare the relationships between the inferred link weight
In the following, the proportions of false conclusions are Wi j , the iSPL ˜i j , and the DD i j , all obtained from W .
evaluated on subsets of links with certain values of SPL and In Fig. 3, we show scatter plots of the inferred coupling
DD, i.e., links are separated into categories according to the strengths (or weights) versus their corresponding links’ iSPL
value of their SPL and DD and then probability of false con- [Figs. 3(a) and 3(b)], and versus DD [Figs. 3(c) and 3(d)], us-
clusions is proportionally evaluated for each category. Unlike ing the two network inference methods explained in Sec. II C
the DD, SPL is by definition related to the type of possible and indicated as G1 and G2 . We color the points differently for
conclusions, i.e., SPL equal to 1 means the true link is present, the ones that represent a true link, Ti j = 1 (red, corresponding
therefore excluding the possibility of false positives, and on to the cluster with higher inferred coupling strength), and
the other hand SPL larger than 1 means the true link is not the ones that do not, Ti j = 0 (black, corresponding to the
present, therefore excluding the possibility of false negatives. cluster with lower inferred coupling strength). This reveals
In order to relax this limitation we here amend the definition the qualitative dependence of weights on indirect measures
and consider the indirect shortest path length (iSPL), i.e., SPL of connectivity: iSPL and DD. The ranges of inferred true
when the direct link is disregarded [see Fig. 1(b)]. Note that and false weights overlap more for lower values of iSPL and
iSPL of binary networks is by definition greater or equal than larger values of DD. These findings are reflective of those
2. Also, if the direct link is not present, then SPL and iSPL in Sec. III A since they imply that the probabilities of false
coincide. conclusions decrease with iSPL and increase with DD. This
022305-4IMPACT OF LOCAL NETWORK CHARACTERISTICS ON … PHYSICAL REVIEW E 103, 022305 (2021)
FIG. 3. Scatter plots of the inferred coupling strengths (weights) versus the iSPL [(a) and (c)] and versus the DD [(b) and (d)] for both
inference methods, G1 [(a) and (b)] and G2 [(c) and (d)]. Points corresponding to true links are depicted with red (corresponding to the cluster
with higher inferred coupling strength) and to nonexisting links with black (corresponding to the cluster with lower inferred coupling strength).
The SPL-relative threshold in depicted as a green line in (a) and (c).
means that these measures can be used to represent the level B. Alternative thresholding
of confidence in detected links, i.e., links with low DD and The results presented in Sec. III A show the dependence
high iSPL are more likely to be accurately reconstructed by of the inferred coupling strengths on two network character-
thresholding. Note that the difference in the scale of DD istics: the indirect shortest path length (iSPL) and the detour
between Figs. 2 and 3 comes from the difference in the scale degree (DD). These results suggest that network reconstruc-
between true weights and inferred weights, in addition to the tions might benefit from different strategies of determining
difference between inference techniques G1 and G2 . The G1 the existence of links. The naive choice consists of selecting
technique on average scales down the weights, while the G2 a threshold value, and considering all links with inferred cou-
technique scales them up. The scaling up becomes even more pling larger than the threshold as present, while the rest as not
prominent when we compute the DD [Eq. (3)] which contains present. In this section, two advanced thresholding strategies
a product of weights, and this is the reason for having factor are discussed.
104 in Fig. 3(d). The first possibility we discuss takes into account the
We illustrate this with ROC curves evaluated on only relationship between the link’s inferred coupling strength
a selected portion of links, according to their DD and and its SPL. Specifically, one of many natural choices is to
iSPL. In particular, we consider the more confident half of only consider links as present when their inverse coupling
links and compute false conclusions proportionally. These strength corresponds to their SPL. In other words, consider
partial-consideration ROC curves are shown alongside the present all links for which the inferred SPL goes through
full-consideration curve as comparison (see Fig. 4). The DD the direct link. This choice can be graphically represented
in particular seems to be a good indicator of confidence in a with a curved threshold, taking the 1/x curve in the plot
link conclusion. of Figs. 3(a) and 3(c). We refer to this as the SPL-relative
022305-5CECCHINI, CESTNIK, AND PIKOVSKY PHYSICAL REVIEW E 103, 022305 (2021)
FIG. 4. ROC curves corresponding to complete network recon-
struction (thick gray line), 50% of links with the lowest DD (dashed
brown line), and 50% of links with the highest iSPL (dotted green
FIG. 5. Mountain-pass threshold (black dashed line) and a possi-
line). Best results correspond to the upper left corner of the ROC
ble choice for the naive threshold (white dotted-dashed line) on top of
plot. The point corresponding to the mountain-pass thresholding
the density histogram for the inferred coupling strengths as a function
is depicted with a blue triangle, and the one corresponding to the
of the DD for both inference methods G1 (a) and G2 (b). Color code
SPL-relative thresholding with a red circle. Methods G1 and G2 are
expresses the density in the logarithmic scale.
represented in (a) and (b), respectively.
refer to it as the mountain-pass threshold. The corresponding
threshold. Figure 4 shows the ROC curve corresponding to result of the mountain-pass threshold in terms of false conclu-
the naïve choice for the threshold, and the circle red marker sion is illustrated in Fig. 4 with a blue triangular marker. For
corresponds to the SPL-relative threshold. While this does not both G1 and G2 , this choice of the threshold results in a better
seem to improve the reconstruction for G1 , it does signifi- reconstruction of the true links than both the SPL-relative and
cantly enhance the results for G2 . Further, we could consider the naive thresholds.
combining SPL-relative threshold with the naïve threshold,
by simply thresholding the remaining links. Namely, among
V. DISCUSSION AND CONCLUSIONS
the links whose strength corresponds to the reciprocal of the
SPL, we perform simple thresholding. With this combined In this paper, the influence of local network characteristics
thresholding the reconstruction is marginally improved for G1 on the probability of false conclusions about the links inferred
as well, i.e., within a range of threshold values both α and β from typical data analysis methods has been examined.
are marginally reduced. We considered binary directed networks of coupled os-
For the second thresholding, consider Figs. 3(b)–3(d). In cillators and assumed a setup where only individual nodes
the figure, the naive threshold corresponds to a horizontal can be observed. Namely, connectivity cannot be measured
separation line. We suggest to make use of the extra dimension directly, but instead can only be estimated from dynamical
gained with the new DD measure and consider a separation observations of individual oscillators. The particular methods
line that bends and therefore possibly separates true links from of connectivity inference adopted in this paper take signals of
nonlinks more efficiently, i.e., with less false conclusions. individual nodes and yield a real-valued connectivity matrix
To this aim, we first compute the histogram of the inferred representing link weights. In order to obtain binary connectiv-
coupling strengths as a function of the DD (see Fig. 5). Then, ity from weighted connections, one would typically threshold
we calculate the curve that follows the local density minimum link weights to determine their presence. A portion of links
between the two bulges of the histogram (black dashed line in is almost always misidentified. In this paper we investigate
Fig. 5). This curve is then used as the new threshold and we the relationship between these false conclusions and local
022305-6IMPACT OF LOCAL NETWORK CHARACTERISTICS ON … PHYSICAL REVIEW E 103, 022305 (2021)
network characteristics. In particular, we look into two net- sented two sample cases in which the decision of considering
work characteristics: the shortest path length and the detour a link present, or not, lies in a gray area. More specifically,
degree. By performing a statistical analysis on simulations the inferred coupling strengths show a distribution which
where the ground truth is known, we found that these local cannot be clearly separated into two. This is a prototypical
characteristics can provide additional information regarding scenario where our method should be employed to improve
the probability of false conclusions. The knowledge of the the network reconstruction. If, for instance, the inferred cou-
dependency of the inferred link weights and these characteris- pling strengths presented a distribution made of two clearly
tics allows the links to be represented in a higher dimensional separated peaks, then simply choosing a threshold for the
space, where more advanced thresholding techniques can be inferred coupling strengths to split the two distributions would
used. Two thresholding techniques are proposed as examples, lead to a nearly perfect reconstruction, and therefore our
both decreasing the proportion of false conclusions for the strategy would be superfluous. However, typically in exper-
tested conditions. imental settings the inference accuracy is limited and network
Additionally, we demonstrated that such a posteriori reconstructions would benefit from our approach. The com-
calculated local network characteristics can provide good es- putational cost of such analyses is small, and the approach
timators of confidence in obtained links. These results can be does not require strong assumptions, therefore, this can be
applied to real experimental settings, where the underlying easily applied with any network reconstructed from data. We
true network is not known a priori. As such, these multidi- suggest that one should employ our strategy as a simulation
mensional thresholding techniques show potential for use in a study tailored to their own case. Such analysis might reveal
variety of further investigation. strong dependencies between the inferred coupling strengths
The computational cost to perform such analyses is small and local network characteristics which can be used to im-
since both DD and SPL can be evaluated for every node prove the reconstruction by lowering down the ratio of false
pair in time proportional to third power of number of nodes positive and false negative detected links, possibly even more
O(n3 ). DD simply involves squaring the adjacency matrix, than the examples shown in this investigation.
which with a textbook algorithm scales with O(n3 ), and even In future studies, different reconstruction methods as well
slightly faster implementations have been found scaling with as different network topologies should be considered to check
O(n2.4 ) [36]. SPL (as well as iSPL) can be evaluated us- whether the common rules found in this paper apply to a wider
ing, for example, Warshal’s algorithm [37], which although range of cases. Furthermore, deliberating knowledge-based
slightly more time consuming than matrix multiplication still criteria for determining how effective a particular local char-
scales with O(n3 ) when efficiently implemented. Such com- acteristic is for the purpose of network reconstruction could
putational scaling makes it feasible to analyze networks of lead to conception of optimized network characteristics.
several thousands of units on a modern laptop. For even larger
networks (millions of nodes) heuristic algorithms for DD and
SPL should be considered, sacrificing optimality for a signifi-
ACKNOWLEDGMENTS
cant reduction in computation cost.
This paper provides insight into the concept of thresh- This project has received funding from the European
olding and offers a general strategy applicable to network Union’s Horizon 2020 research and innovation programme
reconstructions. Here, we showed two examples of different under the Marie Sklodowska-Curie Grant Agreement No.
inference methods used to reconstruct ER networks, but we 642563. A.P. thanks Russian Science Foundation (Grant No.
expect this would work also in many other cases, for different 17-12-01534). The authors declare no competing financial
inference methods as well as network topologies. We pre- interests.
[1] A. Barrat, M. Barthelemy, and A. Vespignani, Dynamical Pro- [8] A. Pikovsky, Phys. Rev. E 93, 062313 (2016).
cesses on Complex Networks (Cambridge University Press, [9] M. Bahadorian, H. Alimohammadi, T. Mozaffari, M. R. R.
Cambridge, 2008). Tabar, J. Peinke, and K. Lehnertz, Sci. Rep. 9, 19831 (2019).
[2] S. Boccaletti, V. Latora, Y. Moreno, M. Chavez, and D.-U. [10] P. Clusella, P. Grassberger, F. J. Pérez-Reche, and A. Politi,
Hwang, Phys. Rep. 424, 175 (2006). Phys. Rev. Lett. 117, 208301 (2016).
[3] R. Cohen and S. Havlin, Complex Networks: Structure, Robust- [11] T. Rings and K. Lehnertz, Chaos: An Interdisciplinary Journal
ness and Function (Cambridge University Press, Cambridge, of Nonlinear Science 26, 093106 (2016).
2010). [12] J. Casadiego, D. Maoutsa, and M. Timme, Phys. Rev. Lett. 121,
[4] A. Pikovsky, M. G. Rosenblum, and J. Kurths, Synchronization, 054101 (2018).
A Universal Concept in Nonlinear Sciences (Cambridge Univer- [13] J. Casadiego, M. Nitzan, S. Hallerberg et al., Nat. Commun. 8,
sity Press, Cambridge, 2001). 2192 (2017).
[5] R. Cestnik and M. Rosenblum, Phys. Rev. E 96, 012209 (2017). [14] J. Casadiego and M. Timme, in Mathematical Technology
[6] B. Kralemann, A. Pikovsky, and M. Rosenblum, New J. Phys. of Networks, edited by D. Mugnolo (Springer, Cham, 2015),
16, 085013 (2014). pp. 39–48.
[7] S. Li, F. Li, W. Liu, and M. Zhan, Physica A (Amsterdam) 404, [15] B. Lusch, P. D. Maia, and J. N. Kutz, Phys. Rev. E 94, 032220
118 (2014). (2016).
022305-7CECCHINI, CESTNIK, AND PIKOVSKY PHYSICAL REVIEW E 103, 022305 (2021)
[16] N. M. Mangan, S. L. Brunton, J. L. Proctor, and J. N. Kutz, [26] A. Banerjee, J. Pathak, R. Roy, J. G. Restrepo, and E. Ott, Chaos
IEEE Trans. Mol., Biol. Multi-Scale Commun. 2, 52 (2016). 29, 121104 (2019).
[17] M. G. Leguia, C. G. B. Martínez, I. Malvestio, A. T. Campo, R. [27] M. J. Panaggio, M.-V. Ciocanel, L. Lazarus, C. M. Topaz, and
Rocamora, Z. Levnajić, and R. G. Andrzejak, Phys. Rev. E 99, B. Xu, Chaos 29, 103116 (2019).
012319 (2019). [28] G. Cecchini, M. Thiel, B. Schelter, and L. Sommerlade,
[18] Z. Levnajić and A. Pikovsky, Phys. Rev. Lett. 107, 034101 J. Neurosci. Meth. 307, 31 (2018).
(2011). [29] G. Cecchini and B. Schelter, Phys. Rev. E 98, 022311
[19] M. G. Leguia, R. G. Andrzejak, and Z. Levnajić, J. Phys. A: (2018).
Math. Theor. 50, 334001 (2017). [30] G. Cecchini and B. Schelter, Commun. Nonlin. Sci. Numer.
[20] I. Adam, G. Cecchini, D. Fanelli, T. Kreuz, R. Livi, M. di Volo, Simul. 88, 105286 (2020).
A. L. A. Mascaro, E. Conti, A. Scaglione, L. Silvestri, and F. S. [31] M. E. J. Newman, Networks: An Introduction (Oxford Univer-
Pavone, Chaos, Solitons Fractals 140, 110235 (2020). sity Press, New York, 2010).
[21] A. Pikovsky, Phys. Lett. A 382, 147 (2018). [32] T. Opsahl, F. Agneessens, and J. Skvoretz, Soc. Networks 32,
[22] M. Asllani, T. Carletti, F. Di Patti, D. Fanelli, and F. Piazza, 245 (2010).
Phys. Rev. Lett. 120, 158301 (2018). [33] D. J. Klein and M. Randić, J. Math. Chem. 12, 81 (1993).
[23] R. Burioni, M. Casartelli, M. di Volo, R. Livi, and A. Vezzani, [34] A. T. Winfree, The Geometry of Biological Time (Springer, New
Sci. Rep. 4, 4336 (2014). York, 1980).
[24] S. G. Shandilya and M. Timme, New J. Phys. 13, 013004 [35] T. Fawcett, Pattern Recog. Lett. 27, 861 (2006).
(2011). [36] A. M. Davie and A. J. Stothers, Proc. R. Soc. Edinburgh, Sect.
[25] M. G. Leguia, Z. Levnajić, L. Todorovski, and B. Ženko, Chaos A, Math. 143, 351 (2013).
29, 093107 (2019). [37] R. W. Floyd, Commun. ACM 5, 345 (1962).
022305-8You can also read