Diversity at Ofcom 2020/21 and Pay gap 2020/21 report
←
→
Page content transcription
If your browser does not render page correctly, please read the page content below
Diversity at Ofcom 2020/21 and Pay gap
2020/21 report

Diversity at Ofcom 2020/21 – Welsh overview
A Braille copy of this report is available on request and we welcome requests for formats other than
print, for example an audio recording or a British Sign Language video

Publication date: 30 July 2021
Contents
Section
1. Overview                                   3
2. About our diversity data                   5
3. Ofcom’s diversity and inclusion strategy   6
4. Ofcom’s diversity profile                  9
5. Pay gap report                             31
Diversity at Ofcom and pay gap report 2020/21

1. Overview
Ofcom makes sure people get the best from their broadband, home phone and mobile services
wherever they are in the UK. We monitor standards on TV and radio. We also oversee the universal
postal service, look after the airwaves used by wireless devices, and help to make sure people don’t
get scammed and are protected from bad practices.

We have set new expectations on telecoms firms for supporting lower income and vulnerable
consumers. Alongside this we are setting clearer rules to make TV accessible to people with hearing
or sight impairments.

We have recently taken on the regulation of video-sharing platforms, and we are preparing to take
on new powers to ensure a safer life online for everyone. Protecting consumers is at the heart of
what we do.

If we are to do our job effectively for everyone in the UK – across our nations, regions and
communities, and for people of all ages and backgrounds - Ofcom itself must reflect the country as it
is today.
At Ofcom we are determined to do all we can to promote diversity, equality and inclusion inside
our organisation and in the sectors we regulate. These are fundamental to achieving our purpose: to
make communications work for everyone.

A new diversity and inclusion strategy
In January 2021, we published a new Diversity and Inclusion Strategy 2021-2026. We are setting
more stretching goals to deliver a better balance of gender and ethnicity at senior levels and a new
target to improve the representation of disabled people at Ofcom. We are committing to making our
boards and advisory committees truly representative of the UK. We aim to meet all these targets by
2026.
Our targets have been informed by data in our 2019/2020 Diversity at Ofcom report, along with
other evidence including our colleague surveys and work with our nine employee network groups.
We have a clear vision for the type of organisation we want to be, and the areas to which we will
give particular focus. We want Ofcom to have:
   •   a truly diverse workforce;
   •   a naturally inclusive culture;
   •   processes, systems and policies that are fair;
   •   colleagues who take personal responsibility for diversity and inclusion;
   •   leaders who are role models; and
   •   stronger connections with the communities we serve.
We will foster a culture in which everyone feels they are valued, have a voice and can be themselves
at work. This doesn't mean we agree all the time. It means we listen to each other, seek and give
challenge, and treat each other with professionalism, respect and kindness.

                                                                                                       3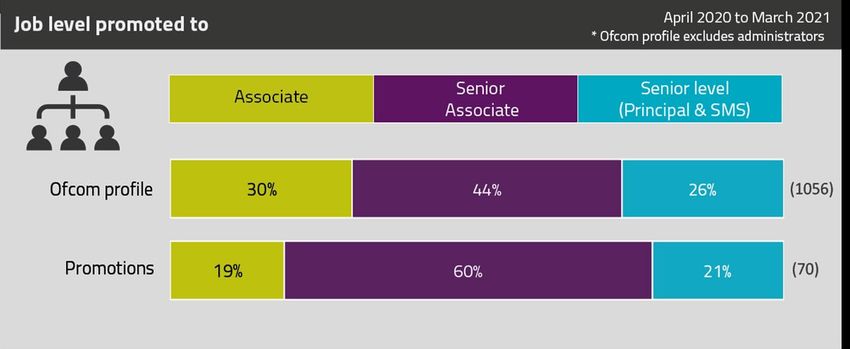
Diversity at Ofcom and pay gap report 2020/21

We expect to be judged against our aims, so we will report annually on whether we are making
progress towards our goals.

Being held to account
This annual report sets out the make-up of our workforce overall as well as the outcomes for
particular groups of employees, from jobseekers to new joiners to those deciding to move to a new
employer. We also look in depth at our pay gap data as of March 2021.
This is the first report under the new strategy, making this data the baseline. Data in this report
covers some of the protected characteristics under the Equality Act 2010 1 but also includes part-
time workers, a characteristic that is not protected under the Act. We aim to compare our overall
diversity profiles to the most recently available and robust population sources that are available.
Future reports will continue to set out in detail how we have progressed.

1Age, disability, gender reassignment, marriage and civil partnership, pregnancy and maternity, race, religion or belief, sex
and sexual orientation.
                                                                                                                            4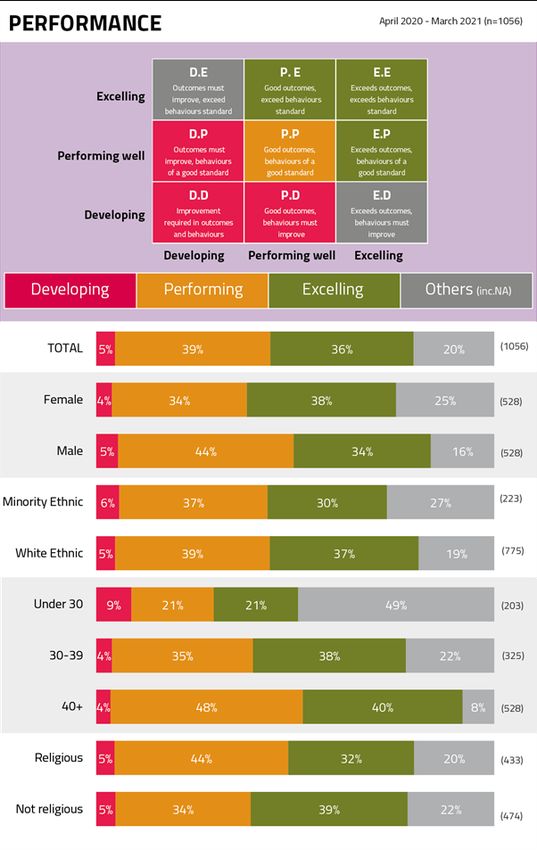
Diversity at Ofcom and pay gap report 2020/21

2. About our diversity data
When people join Ofcom, we ask them to complete a diversity monitoring form and to review their
information annually or when details need to be updated.
Data in this report is based on information provided by our workforce and covers April 2020 to
March 2021, unless indicated otherwise. This report fulfils part of our duties under the Equality Act
2010 and helps to inform our approach to equality, diversity and inclusion at Ofcom.
The questions we ask staff cover gender (referred to as ‘sex’ in the Equality Act 2010 and by which
we mean the sex assigned to a person at birth or the sex a person has legally transitioned to),
ethnicity (‘race’ in the Equality Act 2010), disability, sexual orientation and religion or belief. Age
data is taken from date-of-birth information and, along with gender, is a required field for HMRC
reporting purposes. Part-time working information is based on people’s contractual hours once they
join us.
In 2020 we added to our diversity monitoring form questions on caring responsibilities, category of
disability, gender identity (by which by mean an individual whose gender is different to or does not
sit comfortably with, that assigned at birth), and a set of questions to gauge socio-economic
background. Our completion rates are currently around 25% for these new questions and our aim is
for a 75% completion rate so we can analyse the data in a robust and meaningful way.
People are free to decide not to answer the questions, and this information is included in our
datasets. We also use information from our recruitment system, which is held separately and is
entirely voluntary. We have more work to do to improve data completion of applicants, particularly
from third party recruiters, and so there are some limitations when looking this data.
Only data that covers at least 10 people is captured in this report, to protect people’s private
information. There will therefore be some data points where we either aggregate data or where we
don’t show any data at all. This is often the case for ethnicity and any ethnicity breakdowns as well
as sexual orientation breakdowns. Internally we are considering all data points, particularly on
ethnicity breakdowns as we committed to in our diversity and inclusion strategy, and we will keep
focusing on differences in representation and experiences for different groups within Ofcom.
We have carried out internal communications campaigns to encourage our employees to share their
diversity data with us. These campaigns have notably decreased our 'no data' gaps, particularly
around disability, sexual orientation and religion or belief. 'No data' gaps are where colleagues have
not provided their information to us at all, which is different to choosing 'prefer not to say'. Closing
our 'no data' gaps has given us a much more accurate reflection of the profile of our workforce in
these areas, which enables us to better understand the impact of our processes, policies and
systems around areas such as progression and retention. Closing our no data gaps on disability has
enabled us for the very first time to voluntarily publish our disability pay gap in May 2021, alongside
our ethnicity pay gap, also published voluntarily, and our gender pay gap. As of March 2021, our no
data gaps for disability, sexual orientation and religion or belief were 7% respectively. We will run
further internal communications campaigns to continue to encourage our staff to share their
information with us, although the sharing of such information will always be voluntary.

                                                                                                        5
Diversity at Ofcom and pay gap report 2020/21

3. Ofcom’s diversity and inclusion strategy
A look at our 2015-2020 workforce targets
In this section, we set out our closing position on our most recent set of five-year workforce targets.
In 2015, we established three diversity targets to be achieved by the end of 2020:
   •   equal gender balance: women to make up 50% across Ofcom;
   •   more women at senior level (principal and senior managers and specialists): women to
       make up at least 40% of colleagues at senior level; and
   •   senior ethnic diversity: 13% of colleagues at a senior level to be from a minority ethnic
       background.
Where we refer to women in our targets and throughout this report, we mean people born with
characteristics that are labelled as female as well as people that may have legally changed their sex
to female.
We met our overall gender balance target in September 2020. We met and exceeded our senior
gender ambition of 40% - as at December 2020 this was 44%. While we made some progress on our
senior ethnicity target, we failed to meet our ambition; 11% of senior roles were held by people
from minority ethnic backgrounds at the end of December 2020, two percentage points short of our
13% target. We recognise there is more work to do in this area. The infographic below tracks our
progress over the 2015-2020 period.

Covers the 2015-2020 target period. Base: all Ofcom employees as at the end of March in each year, apart
from 2020 which is based on 31 December as we were then working to determine a new set of five-year targets
which was to start from March 2021.

                                                                                                         6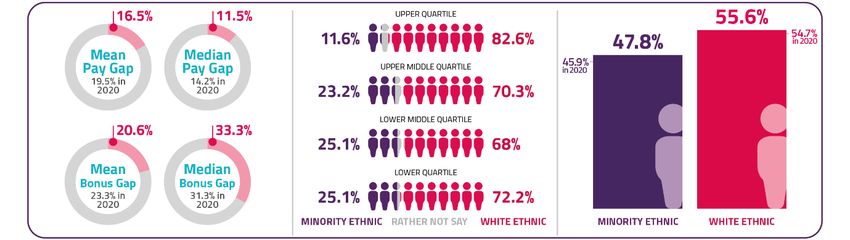
Diversity at Ofcom and pay gap report 2020/21

Our 2021-2026 targets and key areas of focus in our diversity and
inclusion strategy
Our starting position
Our new diversity and inclusion strategy sets out our focus and commitment to minority ethnic and
gender representation at senior levels, alongside disability across our entire workforce. This includes
new workforce targets in these areas of under-representation:
   •   senior ethnicity: 16% of our senior leaders from minority ethnic backgrounds (starting
       position 11%)
   •   senior gender balance: An equal gender balance at senior levels (44% starting position)
   •   disability: 15% of our workforce are disabled (12% starting position)
We have also, for the first time, set targets for our boards and committees over which we have
recruitment control:
   •   an approximately equal gender balance and a level comparable with the relevant populations
       on disability (15%) and ethnicity (10%). Progress on this will be published in our Annual
       Reports and Accounts.
Our diversity and inclusion strategy also includes a new focus on socio-economic diversity at Ofcom.
Our first step is to gather and understand relevant data and we have introduced three questions in
our HR database to help us do this: parental occupation of main/highest income earner in household
when the employee was aged 14; the type of school the person mainly attended between the ages
of 11 and 16 (state or private including whether it was selective or not, or overseas); and highest
level of qualification achieved by either parent(s)/guardian(s) by the time the person was 18. We
may consider setting targets on socio-economic diversity in the future once our data is robust
enough (at least a 75% completion rate) and if it indicates under-representation.
In addition, we made commitments to increasing our out-of-London presence and on improving the
representation and experiences of our Black employees.

Achievements since the launch of our diversity and inclusion strategy
Developed group-level action plans.
There are a number of groups within Ofcom. These are: Network and Communications; Broadcasting
and Online; Technology; Economics; Spectrum; Strategy and Research; and Legal and Corporate.
Each group’s individual plans and KPIs include workforce aspirations, linked to our new workforce
targets on senior gender, senior ethnicity and disability Ofcom-wide. This is alongside inclusion
aspirations and consideration of internal and external talent pipelines. They also contain specific
areas of focus relevant to each professional area and their local setting.
New Manchester Hub. We will open a new hub in Manchester later in 2021 as we grow by
approximately 30% in the next five years to take on the regulation of the online safety and telecoms
security regimes.
New strategy on ethnicity. We launched a refreshed strategy to improve the representation and
experiences of our Black colleagues.
                                                                                                      7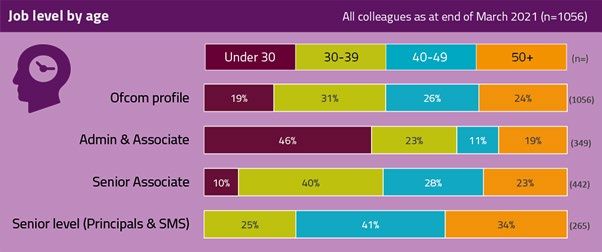
Diversity at Ofcom and pay gap report 2020/21

Partnership with external recruiter to focus on diverse hiring. As we transform our recruitment
practices and approach in year one of our strategy, we have partnered with an external recruiter
who operate as an extension of our own internal resourcing team. They have created a diversity and
inclusion recruitment strategy which supports our goals and will be reviewing our selection and
assessment approach later this year to make them as fair and inclusive as possible. And we have
started the work on overhauling our performance management approach and have held a series of
workshops with a wide range of employees of all job levels and a variety of roles. We are also
seeking feedback from our colleague diversity networks through surveys they are carrying out with
their members.
More input from external partners on best practice. We value external perspectives on our
diversity, inclusion and equality work. This enables us to see what others are doing to improve their
workplaces for different people. This helps us to identify where we are doing well and where we can
do more. We therefore use the following external benchmarking:
   •   Social Mobility Foundation’s Social Mobility Index;
   •   Investing in Ethnicity’s Maturity Index;
   •   Stonewall’s Workplace Equality Index;
   •   Time Top 50 Employers for Women from Business in the Community;
   •   Employers for Carers/Carers UK Carers Confident accreditation; and
   •   Business in the Community’s Race at Work Survey
Named a Times Top 50 Employer for Women. We were delighted to again be named a Times Top 50
Employer for Women in April 2021 and proud to have achieved Carer Confident Accomplished level
2 (level 3 is the highest) in November 2020, just before the launch of our strategy. We have recently
entered the Social Mobility Index and Maturity Index for ethnicity, and will be entering the Stonewall
Workplace Equality Index in the autumn. The Business Disability Forum provides us with invaluable
perspectives as we transform our recruitment, performance and career processes and approach,
and we are committed to working towards Disability Confident Level 3 (the highest level) status as
part of our disability ambitions.
Guidance we get from these different benchmarking organisations is purely advisory, and we make
our final decisions on any organisational policies, approaches and procedures after discussing them
with our colleagues and through our Ofcom governance process.

                                                                                                      8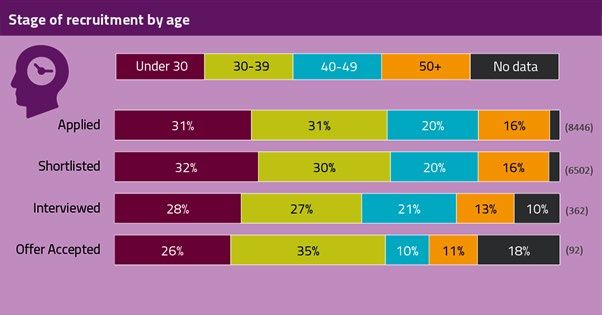
Diversity at Ofcom and pay gap report 2020/21

4. Ofcom’s diversity profile
This section focuses in more detail on the diversity make up of our organisation overall, as well as
across the following areas:
   •   job level;
   •   line managers;
   •   recruitment stages;
   •   new starters;
   •   performance ratings;
   •   promotion outcomes; and
   •   leavers.
To make sense of the data, we compare the proportions of each group to the proportions they
represent at Ofcom. As well as some ‘no data’ gaps in our statistics, ‘prefer not to say’ can also
contribute to the results and therefore to what we can learn from the numbers, particularly where
the proportions they account for are larger. To narrow or close these gaps, we will continue to build
on previous internal communications campaigns to encourage our people to provide their diversity
data and to build a culture in which people feel comfortable sharing their information with us.
Some of the data shown may not add up to 100% due to rounding of values.

Organisational portrait
Ofcom is a vibrant organisation of just over 1,000 people. In non-Covid times we have staff based in
our London, Birmingham, Warrington and Baldock offices as well as Cardiff, Edinburgh and Belfast.
Most of our people have worked from home in the past year during lockdown, except for some of
our key workers, such as spectrum engineers.
Eighty-one per cent of our workforce use London as their primary base and 19% are based outside of
London with Warrington (5%), Baldock (5%) and Edinburgh (4%) making up most of this.
There are five grades across Ofcom ranging from Administrator to Senior Management and
Specialists (‘SMS’ – director level). The largest proportion of employees are Senior Associates who
make up two-fifths of our organisation (42%) followed by Associates (28%). There are broadly similar
proportions of SMS (7%) and Administrators (5%) and close to a fifth (18%) are Principals.

                                                                                                       9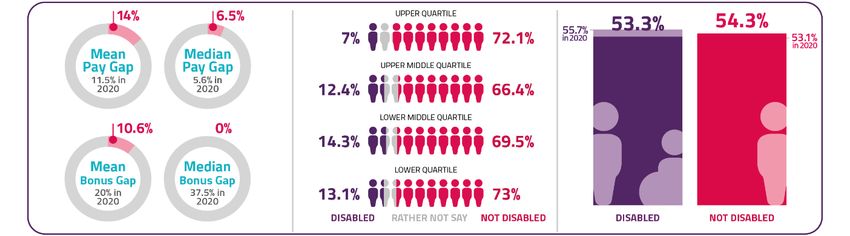
Diversity at Ofcom and pay gap report 2020/21

Base: all Ofcom as at the end of March 2021 (n=1056)

                                                       10
Diversity at Ofcom and pay gap report 2020/21
White ethnic = White British, Irish, Gypsy or Irish traveller and any other White ethnic background. Religious =
Christian, Muslim, Hindu, Sikh, Jewish, Buddhist, other religion/faith.
11Diversity at Ofcom and pay gap report 2020/21
Our workforce diversity
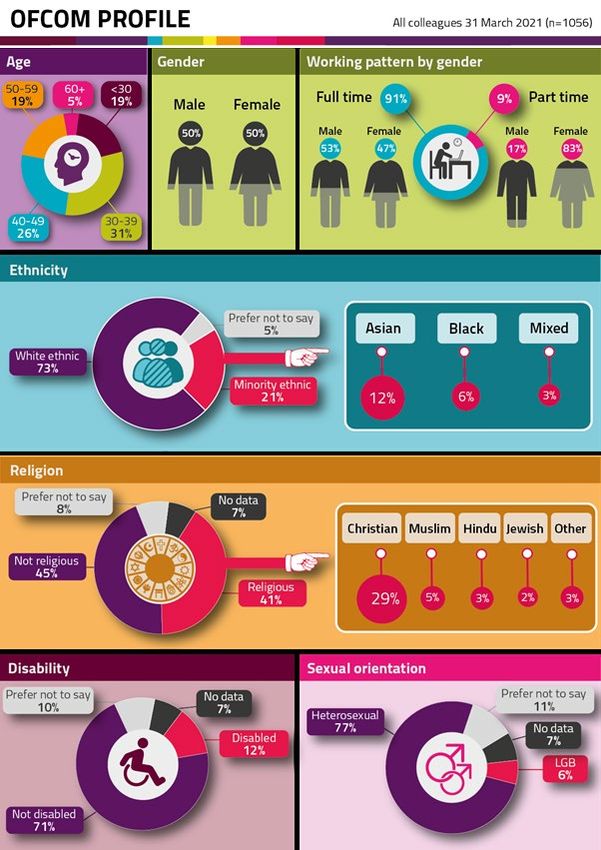
Gender
Fifty per cent of our workforce are women, broadly comparable to the UK working age population of
48% (ONS, May 2021). Looking at each grade and the gender split within each grade, women make
up over half in Administrator (61%) and Associate roles (57%) and under half in principal (45%) and
SMS (41%) jobs. There is a closer balance in the Senior Associate band where women make up just
under half (48%).
Ethnicity
Twenty one per cent of our colleagues are from minority ethnic backgrounds, above the working age
population of 12% across the UK (ONS, May 2021). Of this 21%, people from Asian backgrounds
make up the largest proportion at 12% followed by Black people (6%) and people from mixed
heritage backgrounds (3%). Looking at the breakdown of these groups further, of Asian people at
Ofcom 5% are of Indian heritage, 2% are Pakistani and 2% are of other Asian backgrounds. People
from a Chinese or Bangladeshi backgrounds each account for 1%. Among the 6% Black employees at
Ofcom, those of African heritage make up 4% while 2% are of Caribbean heritage (and a very small
proportion from other Black backgrounds).
As with gender, our data shows that our minority ethnic population is not evenly spread across our
organisation. There is above-average representation in Administrator (25%) and Associate roles
(27%) relative to the Ofcom average representation of 21%, and below-average presence in our
most senior roles of principals and SMS combined (11%). However, representation in Senior
Associate jobs (22%) is in line with the Ofcom average.
Disability
Just over a tenth (12%) of our staff have told us they are disabled. This is below the working age
population of 19%, which is why this is a priority area of focus for us in the next five years, supported
by our new workforce target on disability. We think that an ambition of 15% disabled representation
Ofcom wide is a stretching yet realistic aspiration, which we hope to achieve through our
organisational growth as well as creating a culture in which people feel comfortable and safe to tell
us they are disabled. Our new disability colleague network, SOUND, aims to support all disabled
staff, including developing the understanding of all employees to have an open conversation about
disability, long-term conditions and neurodiversity. We have introduced a question asking our
disabled colleagues to share with us which category of disability or long-term condition applies to
them. This will help us to understand and identify where we can offer more, or better, targeted
support.
Sexual orientation
Six percent of our workforce have told us they are lesbian, gay or bi (LGB). In March 2020 this was
4%. Six percent is above adult population trends (ONS 2019 cites that 3% of the adult population
identify as LGB in their Annual Population Survey), but others think that the figure might be closer to
12Diversity at Ofcom and pay gap report 2020/21
6-7%. Creating a culture of inclusion and belonging will be key for us to maintain representation of
LGB colleagues across Ofcom.
Religion or belief
Forty one per cent of our staff say they are religious and 45% say they are not. Of those that say they
have a faith, the majority (29%) are Christian, 5% are Muslim, 3% are Hindu, 2% are Jewish and 3%
are from a combination of other religions/faiths.
Our ‘religious’ statistic is below the Census 2011 figure of 75% for adults in England and Wales and
our ‘not religious’ statistic is above the 25% stated in the Census. The biggest variant in the
distribution of people by the established faiths is in the proportion who say they are Christian – 59%
in the Census 2011 compared to 29% at Ofcom. Given that the Census is now a decade old we can
draw on more recent population estimates on religion/belief from research by the National Centre
for Social Research in its British Social Attitudes (BSA) report. Its 2019 report suggests that 47% of
Britain in 2018 identity as religious with 38% of this figure saying they are Christian and 9% that they
are non-Christian (Muslim, Jewish and other non-Christian). 52% of people in Britain say they do not
regard themselves as belonging to any religion according to their research. We will evaluate our
religion/belief profile once Census 2021 data is made available.
Age and working patterns
By age, a quarter (24%) of employees are aged 50 years and above (compared to 33% of the working
age population being 50+ according to latest ONS estimates), of which 5% are aged 60 years and
above. Nineteen percent are below 30 years old. The highest concentration of colleagues is in the
30-39 age bracket (31%), followed by 40-49 (26%), accounting for a combined 56% of our workforce.
These trends are very similar to last year.
People who work part-time make up 9% of Ofcom and of this 9%, 83% are women.
Job level
We have five job levels across Ofcom; Administrator, Associate, Senior Associate, Principal and SMS.
13Diversity at Ofcom and pay gap report 2020/21
Compared to our overall gender profile of 50%, women make up an above-average proportion in our
Administrator roles and Associate roles. Representation begins to fall below average at our Senior
Associate, Principal, and SMS levels.
A higher-than-average proportion of our minority ethnic workforce is in our two grades of
Administrator and Associate. The proportion of minority ethnic staff at Senior Associate grade is
consistent with the Ofcom average, while the proportion of minority ethnic people is below the
Ofcom average in our two highest grades combined.
Disabled representation at Associate and Senior Associate grades are broadly consistent with our
average disability profile of 12%. However, at more than double the Ofcom average, 25% of people
in Administrator roles are disabled. Disabled representation in our top two bands at 9% is below the
Ofcom average.
14Diversity at Ofcom and pay gap report 2020/21
LGB representation is consistent across our grades and with the Ofcom LGB profile, though some job
levels have needed to be aggregated due to our minimum data reporting cut off.
While Administrators and Associates make up a fifth (19%) of Ofcom colleagues, by age almost half
(46%) of our youngest employees (under 30) are in our most junior Administrator and Associate
grades combined with none in our most senior positions. Most of this will be driven by our graduate
and apprentice cohorts who are at the start of their careers. At Senior Associate level, the largest
proportion of people (40%) are aged 30-39 while the largest proportion of staff in our top two job
bands are in the next age bracket up of 40-49 (41%). The proportion of colleagues aged 50+ at Senior
Associate level is consistent with their Ofcom average profile (24%) but increases to above average
in our two most senior bands and decreases in our most junior band of Administrators and
Associates.
15Diversity at Ofcom and pay gap report 2020/21
The balance between colleagues who have a faith and those that say they have no religion across
each of our grades varies. Staff who are not religious make up a higher proportion in Administrator,
SMS and Principal roles (each above our average profile of 45%), while the highest proportion of
people who say they are religious are Associates (47%), above the overall average of 41%. The
remaining grades have the same or are broadly in line with our overall religious population.
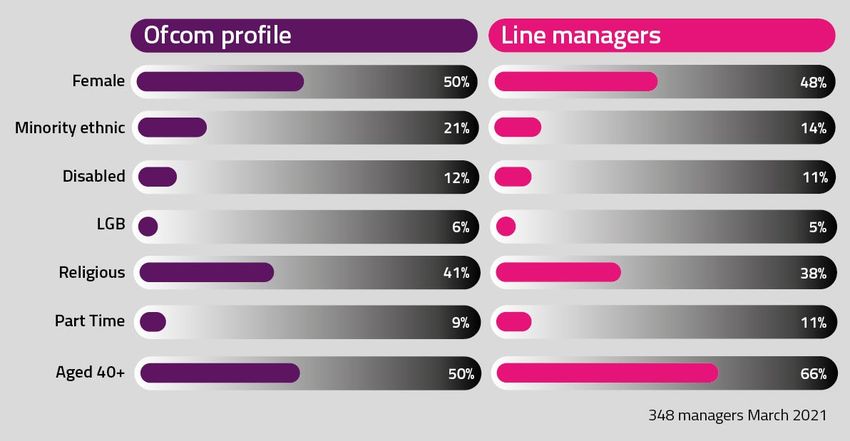
Line managers
A third (33%) of employees at Ofcom have line management responsibility.
Women make up 48% of our colleagues who have line management responsibility (44% in March
2020). There is lower representation of minority ethnic line managers at 14% compared to the 21%
minority ethnic average profile at Ofcom, although this proportion has increased from 12% in 2020.
Representation of disabled and LGB line management staff is broadly reflective of their Ofcom
profile, while there is a marginally lower proportion of colleagues of faith compared to the Ofcom
average and higher proportion of line managers work part-time compared to the Ofcom average.
There is a higher proportion than average of line managers in the 40+ age bracket at 66% (against
their 50% representation Ofcom-wide).
16Diversity at Ofcom and pay gap report 2020/21
Recruitment
Our recruitment information is taken from our online recruitment system and from our recruitment
partners. When people apply for jobs with us, we ask them to fill in a diversity monitoring form. We
have a lot more work to do to encourage people to share their information with us, particularly
applicants coming through our external recruitment partners. We will continue to focus on this in
the coming year so that we can have a fuller and clearer picture of diversity at every stage of our
recruitment process.
Our data looks at each stage of the recruitment process by demographic group. From application to
shortlisting (following an exercise to evaluate legal eligibility as well as suitability against the
advertised job description), to those invited for interviews through to an offer being accepted.
17Diversity at Ofcom and pay gap report 2020/21
Of applicants, a slightly lower proportion of women (46%) applied for jobs with us than men and
while their proportion fell during shortlisting (to 41%), the proportion subsequently increased during
interviews and ending at 52% of eventual job offers accepted.
On ethnicity, four in 10 (39%) applicants were from minority ethnic backgrounds. The proportion
who were shortlisted stayed consistent (40%) but tailed off at the interview stages before
accounting for a third (33%) of hires.
Looking at the data in more detail by individual ethnic groups shows that the proportion of Black
ethnic candidates throughout each four stages of recruitment stayed consistent at 11-12% apart
from at interview, where the proportion dipped to 9%. Nonetheless, the proportion who accepted
jobs with us (12%) was virtually the same as the proportion who applied and who were shortlisted
for interview. 12% is double the proportion of Black people at Ofcom (6%).
Asian ethnic applicants accounted for a fifth (around 20%) at application and shortlisted stages but
this dropped off to 14% at the last two stages of recruitment respectively, slightly above the figure
of (12%) of our existing Asian employees.
White ethnic people made up over just over half of applicants and shortlisted candidates. This
proportion increased to 1 in 6 of interviewed candidates before accounting for 57% of job offers that
were accepted. White ethnic colleagues make up 73% of all Ofcom employees.
18Diversity at Ofcom and pay gap report 2020/21
By age, around a third of applicants were aged under 30 and 30-39 respectively. The proportion of
each of these age groups stayed broadly consistent from application to shortlist but dipped at the
interviews stage. While the proportion who accepted jobs with us slightly dipped again for under
30s, it increased for those aged between 30-39 years. Representation from those aged 40-49 years
stayed constant at a fifth (20-21%) during application, shortlist and interviews but the proportion
who accepted job offers halved (10%). People aged 50+ years accounted for 16% of applicants and
of those shortlisted but dipped between interviews and acceptance of a job (11%).
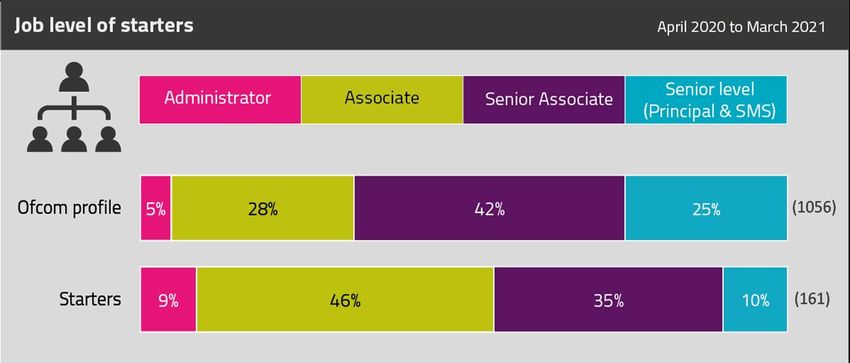
Starters
In the last year 161 people joined Ofcom as we continued hiring during the pandemic. Once
colleagues start jobs with us, they are asked to fill in a new employee diversity form. They are also
able to check and update their diversity information at any time through a self-service online
database.
Most of our intake were into the Associate grade (46%) followed by Senior Associate (35%). The
19Diversity at Ofcom and pay gap report 2020/21
combined proportion of people joining us in Administrator and Associate roles was 55%, reflecting
our early careers strategy. Ten percent of new joiners took up jobs in principal and SMS roles.
Sixty-one per cent of starters were women and around a third of starters (32%) were from minority
ethnic backgrounds – above our average female and minority ethnic profiles (50% and 21%
respectively).
Disabled people accounted for 14% of new starters, two percentage points higher than our 12%
Ofcom profile. Ofcom supports the Disability Confident Scheme which provides, where practicable,
disabled applicants with a first stage interview if the minimum criteria are reached. Given our move
into digital recruitment practices this can be a video presentation, video interview or panel
interview.
20Diversity at Ofcom and pay gap report 2020/21
Nine percent of new starters were LGB, higher than our average LGB representation of 6%.
By age, the highest proportion of new starters were aged 30-39 (37%) followed by those under 30
(35%). These new starter rates were respectively above their average representation across Ofcom.
We recruited much lower proportions of people in the 50+ years age bracket, relative to their
average representation at Ofcom and recruitment was also lower for people aged 40-49.
A slightly higher proportion of people who joined us said they were religious (45%) compared to the
Ofcom average (41%), while the proportion of new starters who said they were not religious (42%)
was generally consistent with the Ofcom-wide picture (45%).
21Diversity at Ofcom and pay gap report 2020/21
Seven percent of new starters joining our organisation had part-time working hours, compared to
9% of Ofcom colleagues who do.
Performance
We’re changing how we manage and measure performance through 2021/22, ready for a new
approach in 2022. Currently, we evaluate colleagues’ performance with equal emphasis on what
they have achieved against their development objectives and how well their behaviour has reflected
our values. This approach results in a double letter assessment reflecting the what and the how. The
ratings are ‘developing’, ‘performing well’ and ‘excelling’, as well as ‘other’ when staff are too early
to rate or their rating does not naturally fit into the three former distinct categories (for example
those who are excelling on either behaviours or delivery, but also developing in one of the other
areas). It’s important to note that ‘developing’ doesn’t always indicate lower standard of
performance as it can also indicate someone is new in their role.
Our people and transformation team brought more rigour and challenge to our annual performance
evaluation process in April 2018. They now report in real time on the distribution of performance
ratings by diversity in the moderation process, as decisions are made about employees, to ensure
challenge and fairness. Any outliers and anomalies are investigated further by our HR team.
22Diversity at Ofcom and pay gap report 2020/21
23Diversity at Ofcom and pay gap report 2020/21
Base: all colleagues eligible for a performance rating. Excelling = exceeded objectives and the expectations for
the job role and job grade throughout the year, as evidenced by feedback. Performing = performing well.
Meeting objectives and expectations of the job role and job grade, are delivering good outcomes and living our
values. Developing = recognises development needs to reach the required level of the job role and/or grade and
does not automatically indicate under-performance. Examples include people who are new in their role, or
where standards of work have dipped below of that expected of their job role or grade or in their behaviours.
Others = includes graduates who do not receive ratings during their programme, people who have been rated
as DE or ED or who are too early in role to be formally rate (for example, in the role for less than six months).
For performance year 2019/20, a slightly higher proportion of women (38%) received an ‘excelling’
rating compared to men (34%), while a lower proportion received a ‘performing well’ assessment
(34% vs 44% of men). A comparable proportion (5%) received a ‘developing’ assessment compared
to men (4%).
The distribution of ‘performing well’ ratings for minority ethnic colleagues and White ethnic
colleagues were similar at 37% and 39% respectively. Thirty per cent of minority ethnic employees
were assessed as ‘excelling’ compared to 37% of White ethnic employees, and the proportions rated
‘developing’ were similar for both groups.
The data suggests that the award of ‘excelling’ ratings increases with age and seniority. Although
we’ve had to aggregate all age groups from age 40+ upwards which can skew the results, data from
last year’s report supports this pattern. A lower proportion of under-30s received an ‘excelling’
rating or a ‘performing well’ rating compared to those in the next age bracket of 30-39. Forty-nine
percent of under-30s received an ‘other’ rating which is largely due to being new starters or new in
role, including graduates and apprentices, who do not receive ratings while they are on their
programme and too early to rate during the analysis period.
A lower proportion of colleagues of faith were awarded an ‘excelling’ rating (32%) compared to
those who are not religious (39%) while a higher proportion (44%) were assessed as ‘performing
well’ (34% for non-religious employees). The same proportion (5%) of each group were assessed as
‘developing’ in their role.
Although not shown in the infographic above, the proportion of disabled staff assessed as ‘excelling’
was lower at 32% compared to non-disabled staff (37%), while a higher proportion were rated as
‘performing well’ (41% vs 35% for non-disabled people). It’s not possible to show the breakdown for
‘developing’ and ‘other’ ratings separately due to low numbers of people in them and so we have
combined them. It shows that a similar proportion of disabled (27%) and non-disabled people (28%)
were in this combined category and that most of this was driven by an ‘other’ assessment.
The proportion of LGB colleagues assessed as ‘excelling’ was slightly lower at 32% compared to 36%
of heterosexual staff and the distribution for ‘performing well’ was also similar at 31% for LGB
employees and 37% for heterosexual colleagues. 37% of LGB employees received a combined
‘developing’ and ‘other’ assessment with the majority of this in the ‘other’ category. It was 27% for
heterosexual employees.
Similar proportions of people who work part-time and people who work full-time were assessed as
‘excelling’ in role (36% and 38% respectively). A higher proportion of employees who work part-time
were rated as ‘performing well’ (47% vs 38% for those who work full time) and a notably lower
24Diversity at Ofcom and pay gap report 2020/21
proportion (14%) were assessed as ‘developing’ or ‘other’ compared to people who work full time
(26%).
Promotion
Seventy Ofcom employees were promoted between March 2019 and March 2020, similar to the 65
people that were promoted the previous year. Promotions take place as part of our internal
promotion process or by colleagues successfully applying for positions at a higher level which are
widely advertised internally and externally. In-role promotions are open to Administrators and
Associates, allowing them to gain promotion to the level above. Their application is endorsed by
their line manager if there is evidence they have increased the responsibilities of their job, have
consistently excelled at their objectives and have demonstrated the competencies/skill level
required of the grade above.
The grades shown are those that a colleague is promoted to. Associates were formerly Administrators, Senior
Associates were Associates, Principals were Senior Associates and SMS were formerly Principals. Base =
Associate levels upwards only (n=1005) therefore the Ofcom grade profiles here will be different to the
proportions shown for the full base of 1056 staff.
Across the last year, the majority (60%) of promotions were into a Senior Associate role. A fifth
(21%) were into our top two most senior positions, compared to 34% last year, while 19% were into
Associate grade.
25Diversity at Ofcom and pay gap report 2020/21
Fifty-nine per cent of promotions were to women, above the Ofcom female profile of 50%, and 26%
were to minority ethnic staff (compared to 21% Ofcom profile).
67% of promotions were to those aged below 40 (against 50% under 40’s across Ofcom) reflecting
the notably younger age skew of staff in Administrator and Associate roles. Much of this (39% of the
67%) was driven by the under-30 age group. A third (33%) of those promoted were aged 40+, below
their average representation of 50%.
26Diversity at Ofcom and pay gap report 2020/21
The proportions of people who said they are religious or non-religious and who were promoted
were broadly in line with their representation across the organisation as a whole.
Leavers
Seventy-six people left Ofcom across 2019/2020, 20 people fewer than last year, as the pandemic
took hold from March 2020. To give context to the leavers rate, we compare the statistics for each
demographic against their organisational profile. The bigger the proportion of leavers relative to
their profile, the lower the retention rate.
Thirty-nine percent of people leaving us were in Administrator and Associate roles, higher than the
combined 33% they represent across Ofcom. Most of this total was driven by Associates.
The leavers rate for Principals (17%) was in line with their organisational profile, while it was higher
than average for those in SMS positions (14%). Of all grades, the variance between the leavers rate
and the profile for Administrators and then Senior Associates shows that retention was highest at
these grades this year. This is compared to principal and SMS roles showing higher retention last
year.
27Diversity at Ofcom and pay gap report 2020/21
The leavers rate for women was 39%, relative to an Ofcom female profile of 50%. The opposite
pattern was seen among men, who accounted for 61% of leavers. This contrasts with 2019-2020
where the proportion of male and female colleagues who left us was almost identical to the
proportions they represented Ofcom-wide. Our range of Covid-19-specific policies and wrap around
support for all our colleagues, some of which are arguably more critical for women, might explain
these leavers patterns this year. We created an enhanced, paid dependant leave policy for staff who
were home schooling or caring for others. We also made it flexible, so this time could be taken in
hourly, half-day or whole-day increments as needed. And we adopted a ‘families first’ and
‘maximum flexibility’ approach, giving flexibility on working hours and patterns for all employees. As
women continue to be primary caregivers for children and for families and loved ones, they’ve been
able to continue working and to blend work and life commitments in a much more agile way. We
have also been fortunate not to have furloughed any employees or to have made any redundancies.
We continue to support colleagues with our range of Covid-19 support and these measures are
outlined in more detail in our Annual Report and Accounts 2021-21, page 95.
By ethnicity, the proportion of minority ethnic colleagues who left us was the same as their
representation across Ofcom (21%). It was higher than the average last year.
28Diversity at Ofcom and pay gap report 2020/21
The highest proportions of leavers were in the 30-39 and 50+ age brackets, accounting for 26% of
leavers each, a figure that isn’t too different from their respective Ofcom profiles. The largest
variance between the leavers rate relative to their Ofcom profile was among those aged under 30 –
24% of leavers were in this age group against their 19% representation Ofcom-wide. Overall,
however, the proportions of leavers by age group were fairly similar to their average profile,
showing good levels of retention.
The proportion of religious and non-religious colleagues who left us were both above their
representation at Ofcom overall, and of similar variance. However, it should be noted that there is a
much higher proportion of people where we don’t hold data on their religion or belief or who prefer
not to share this information with us. This can skew the picture.
29Diversity at Ofcom and pay gap report 2020/21
The proportion of leavers (14%) who worked part-time was notably higher than their average
representation of 9% at Ofcom.
30Diversity at Ofcom and pay gap report 2020/21
5. Pay gap report
Introduction
Pay gaps are not the same as equal pay and are an equality measure based on the pay of people
across an organisation as a whole, regardless of the job they do. They compare the salaries of one
characteristic with another – such as women with men – and the ‘gap’ is the difference between the
two. (The pay gap does not show differences in pay for comparable jobs, something which is against
the law.) Pay gaps are influenced by the make-up of the organisation based on the characteristic in
question (such as gender, ethnicity or disability), and where particular types of jobs are
concentrated. We have also continued to audit equal pay at Ofcom, including that of disabled
colleagues, and we provide an update on this.
As a public sector organisation, Ofcom reports its gender pay gap information under regulations that
came into force in April 2017. However, since 2004 we have gone beyond these requirements by
publishing gender pay data as part of our equal pay audit. Since 2018 we have also published our
ethnicity pay gap, and last year we published our disability pay gap information for the first time and
will continue to do so.
Although we are making progress in some areas, such as making sure we have greater levels of
diversity in our graduate and apprenticeship population, we know that the impact of these decisions
will take time to come to fruition. Our gender pay gap has increased slightly compared to the
previous year so we are looking at the reasons for this and will feed insights into our programme of
work. We take a long-term view of the pay gap challenge and will make sure any decisions we take
will help to meet our goals not just now, but in five years’ time.
Overview
We report the following pay gap statistics each year as at 31 March.
We report on the following for gender, ethnicity and disability:
• mean (average) pay gap;
• median pay gap;
• percentage of men and women, white ethnic and minority ethnic and disabled and non-
disabled in each pay quartile;
• mean (average) bonus gap; and
• median bonus gap.
For this report, our data is taken as at 31 March 2021 and includes all employees and pay elements,
in line with government reporting requirements.
Ofcom’s bonus gap is made up of our annual bonus scheme and our recognition awards, which are
given to colleagues who deliver beyond expectations while also working in a way that demonstrates
our organisational values. In 2021 no colleague received a pay rise (except those earning under
31Diversity at Ofcom and pay gap report 2020/21
£24,000) due to the ongoing impact of the pandemic. No annual bonus was paid this year and this
will be captured in the report for July 2022.
Figure 1: Ofcom employee make-up. Data as of 31 March 2021.
How we are doing
Gender
Figure 2: Gender Pay and Bonus Gap, % of employees by quartile and % of employees receiving a
bonus
Between March 2020 and March 2021, Ofcom’s gender pay gaps (mean and median) showed an
increase of 1 percentage point to 10.9% in the mean pay gap and 0.2 percentage points increase to
12.3% in the median pay gap.
Bonus gaps have increased for gender (from 4.9% to 5.4% mean and from 19.5% to 25.9% median).
There was the same proportion of women receiving a bonus (54.0%) as men (53.8%).
32Diversity at Ofcom and pay gap report 2020/21
Ethnicity
Figure 3: Ethnicity Pay and Bonus Gap, % of employees by quartile and % of employees receiving a
bonus
For ethnicity, the pay gap decreased by 3 percentage points to 16.5% for mean and by 2.7
percentage points to 11.5% for median.
The percentage of minority ethnic employees receiving a bonus increased by 1.9 percentage points
to 47.8% in 2021 and increased for White ethnic employees by 0.9 percentage points to 55.6%. As a
result, the ethnicity bonus gaps decreased last year in mean to 20.6%, and increased in median to
33.3%.
Disability
Figure 4: Disability Pay and Bonus Gap, % of employees by quartile and % of employees receiving a
bonus
In the second year of reviewing our disability pay, the data shows there are gaps in mean and
median pay which have increased. The median gap has risen by 0.9 percentage points to 6.5%, and
the mean by 3 percentage points to 14%. The bonus gaps have dropped substantially to 10.6% mean
(from 20.0%) and 0% median (from 37.5%).
Analysis
As a relatively small organisation of just over 1,000 people, staff movements can make a significant
difference to Ofcom’s pay gaps as the mean and median can move quite materially. For example,
relatively small changes in the number of women in the upper quartile (in the top quarter when
listing all employees according to hourly rate of pay, in order of highest to lowest paid, and splitting
33Diversity at Ofcom and pay gap report 2020/21
it into four equally sized parts), has had a direct impact on the size of our gender pay gap. We are
looking to understand the root causes of increase in our gender pay gap and we will feed it into our
programme of work.
Similarly, as we increase the gender and ethnicity diversity of our graduate cohort, we have seen this
have a negative effect on our pay gap as it contributes to the proportion of our workforce that is
lower paid – but potentially has a positive effect on our future senior diversity. As we make progress
on our diversity and inclusion programme, we acknowledge that this might affect our pay gaps in the
short term. We will continue to monitor the effectiveness of the programme to make sure it brings
about the results we need, both for our workforce targets and for reducing our pay gaps.
What we are doing
Diversity and inclusion strategy
As part of our diversity and inclusion strategy 2021- 2026 we’re focusing on transforming three main
areas: recruitment; career progression; and performance management; all of which can positively
impact our pay gap. In recruitment, how we set pay for new joiners and considering relativities in
pay for our existing staff is important, as is setting up a reward framework to support our new
performance management approach and how we support colleagues to progress their careers and
boost their pay.
Recruitment
In our diversity and inclusion strategy, we committed to improving our recruitment
practices to create better opportunities for hiring more diverse talent. Hand in hand
with this must be fair pay practices such as transparency of salaries when advertising
roles and in deciding pay offers for candidates, while remaining competitive in the
labour market. We have already started to work through our current processes.
Careers
To support our work in developing a pipeline of diverse leaders, in 2019 we launched
Rise, our targeted development programme for high-performing individuals from
under-represented groups. We will build on this by looking at our career frameworks to
support people in progressing, how we allocate our work, and how we create career
paths for both technical and management roles. This framework will also be supported
by a promotion pay structure that encourages movement of colleagues across teams.
Performance management
Performance management and reward are inextricably linked. Having the right tools
available to managers is essential to embedding a performance culture where
everyone can do their best. During 2021 we are undertaking a full review of our
performance management processes, considering how they affect everybody and
could help us to reduce pay gaps. We will make changes from 2022 onwards.
34You can also read


