Reopening, Reflation, Reset - Global Credit Conditions Q3 2021
←
→
Page content transcription
If your browser does not render page correctly, please read the page content below
Global Credit Conditions Q3 2021:                                                                                                 Global Head of Research
                                                                                                                                  Alexandra Dimitrijevic

Reopening, Reflation, Reset                                                                                                       London
                                                                                                                                  +44-20-7176-3128
                                                                                                                                  alexandra.dimitrijevic@
                                                                                                                                  spglobal.com
June 30, 2021

  Key Takeaways                                                                                                                   Research
                                                                                                                                  Joe Maguire
  – Forward-looking indicators point to rapidly improving credit trends. The global corporate                                     New York
    net negative outlook bias—a measure of future downgrade risk—has continued to decline.                                        joe.maguire@spglobal.com
    It’s now just 14%, down from a high of 37% a year ago, and defaults are trending down from                                    +1-212-438-7507
    their pandemic peak. Our upwardly revised forecast for global GDP growth of 5.9% this year
    will help underpin broadly favorable credit conditions.                                                                       David Tesher
                                                                                                                                  New York
  – The pre-pandemic credit cycle is resuming after a pause, but with added leverage for                                          david.tesher@spglobal.com
    corporates and sovereigns and the share of riskiest credits near an all-time high. Roughly                                    +1-212-438-2618
    40% of speculative-grade corporates in the U.S., and more than 30% in Europe, are rated ‘B-’
    and lower, leaving some borrowers vulnerable to credit deterioration and defaults if income                                   Gareth Williams
    recovers more slowly than we expect, especially if the cost of debt starts to rise.                                           London
                                                                                                                                  gareth.williams@spglobal.com
  – Though not our base case, a build-up in inflation is among our top risks. As price pressures                                  +44-20-7176-7226
    build, central banks may be forced to accelerate monetary-policy tightening, which could
    threaten the orderly normalization of credit conditions. A rapid repricing of risk would hit                                  Yucheng Zheng
    asset prices, raise the cost of debt, and weigh on funding access—hurting low-rated                                           New York
    corporates and some emerging markets.                                                                                         yucheng.zheng@spglobal.com
                                                                                                                                  +1-212-438-4436
  – Vaccine rollouts offer optimism, and countries are becoming better at coping with the
    economic effects of surges in COVID-19 even during lockdowns. But the picture remains
    mixed for emerging markets, where the threat of a resurgence in cases (and the consequent                                     Links
    drag on the economy) persists even in countries that have improved immunization rates.

(Editor’s Note: S&P Global Ratings’ Credit Conditions Committees meet quarterly to review macroeconomic conditions in each of
four regions (Asia-Pacific, Emerging Markets, Europe, and North America). Discussions center on identifying credit risks and
their potential ratings impact in various asset classes, as well as borrowing and lending trends for businesses and consumers.
This commentary reflects views discussed in the global committee on June 24, 2021.)

Credit trends are improving rapidly, albeit with significant differences across regions and
sectors. The primary positive drivers remain intact: rebounding economies, vaccination progress,
plentiful liquidity, and a strong appetite for risk even at the weakest end of the credit spectrum.
                                                                                                                                  Daily research updates,
We’ve revised our 2021 global GDP growth forecast up to 5.9% and see upside risks. Crucially, the                                 including a summary of related
U.S. and China—which account for almost 40% of the global economy—are both growing rapidly.                                       ratings actions, are available at:
We expect China’s GDP to grow 8.3% this year, and for the U.S. economy to expand 6.7%, in the                                     https://www.spglobal.com/ratin
                                                                                                                                  gs/en/research-
biggest jump since 1984. A rapid vaccine rollout in the U.S. has made for a rapid easing of social                                insights/topics/special-report-
restrictions, allowing social and economic activity to normalize and reinforcing massive                                          shape-of-recovery
government stimulus programs. Emerging markets, however, remain a concern given that it could
take another year to achieve widespread vaccination in those countries. Vaccine-resistant variants
remain the primary risk to global normalization, given their potential to undermine even the most
successful rollouts and potentially force the reimposition of restrictions.

Reflecting these positive factors, there have been three times as many upgrades as downgrades
this year (see chart 1). That said, these upgrades remain a fraction of the total 2020 downgrades
triggered by the pandemic and the collapse in oil prices. Companies at the lower end of the scale, in
the ‘B’ and ‘CCC’ categories, have accounted for the majority of upgrades (see chart 2). Many of

S&P Global Ratings                                                                                                          June 30, 2021 1
Global Credit Conditions Q3 2021: Reopening, Reflation, Reset
these more vulnerable issuers, which represented the bulk of last year’s downgrades, are
benefitting from favorable financing conditions and a better-than-expected economic recovery.
Media and entertainment, consumer products, retail and restaurant, and technology are among the
sectors that have seen the largest number of upgrades—on the back of the economic rebound,
easing of social restrictions, and pick-up in oil prices (see chart 3).
Chart 1 Chart 2
Positive Rating Actions Peaked In April But Remain Strong Rating Actions By Rating Category
Upgrade
Downgrade Downgrade Upgrade Share Of Upgrades (%)
Overall Net Negative Bias (%)
100 40% 400 30%
0 35%
200 25%
-100 30%
0 20%
25%
-200
20% -200 15%
-300
15%
-400 10%
-400
10%
-500 -600 5%
5%
-600 0% -800 0%
AA A BBB BB B CCC
01/20
02/20
03/20
04/20
05/20
06/20
07/20
08/20
09/20
10/20
11/20
12/20
01/21
02/21
03/21
04/21
05/21
and
below
Rating actions as of June 7, 2021. Downgrades and upgrades are trailing Rating Actions are from Jan. 31, 2020 to June 7, 2021. Source: S&P
four-week. Net negative bias is calculated by subtracting the positive bias Global Ratings.
from the negative bias. Overall net bias (%) excludes sovereigns. Source: S&P
Global Ratings.
Chart 3 Chart 4
Rating Actions By Sector Net Negative Bias By Sector
Downgrade Upgrade Current Dec-20
100 60%
50
50%
0
-50 40%
-100 30%
-150
20%
-200
10%
-250
-300 0%
Source: S&P Global Ratings. Rating Actions are from Jan. 31, 2020 to June 7, 2021. Aer&D—Aerospace & Defense. Auto—Automotive. Chemicals,
P&ES—Chemicals, Packaging and Environmental Services. HomeRE—Homebuilders/Real Estate. FP&BM—Forest Products and Building Materials.
Med&Ent—Media & Entertainment. Ret/Res—Retail/Restaurants. Transp—Transportation. Telecom—Telecommunications. Net negative bias is
calculated by subtracting the positive bias from the negative bias.
Looking ahead, the net negative outlook bias (indicative of potential rating actions) is now back
to pre-pandemic levels at 14%, down from a peak of 37% a year ago, indicating a stabilization of
credit quality. While the improved outlook has been most noticeable for the chemicals, oil and gas,
automotive, and retail and restaurants sectors, others—such as media and entertainment, and
transportation—will likely remain under pressure well into 2022 or later (see chart 4).
S&P Global Ratings June 30, 2021 2Global Credit Conditions Q3 2021: Reopening, Reflation, Reset
Funding conditions remain very supportive, with spreads on corporate debt remarkably tight.
Issuers at nearly all ratings levels (as well as in industries where secular headwinds predate the
pandemic) have been able to tap the capital markets at welcoming terms. Secondary-market
spreads are narrower than they were before the pandemic, and the compression in ‘B’ and ‘CCC’
category spreads illustrates the huge appetite among investors for riskier assets (see charts 5 and
6). The economic recovery and stability in financial markets have brought our estimated spreads
closer to observed spreads—after market pricing of risk during the pandemic remained
consistently more optimistic than economic and financial indicators suggested.
Chart 5 Chart 6
Secondary Market Spreads Are Tighter ‘B’ and ‘CCC’ Category Spread Compression
Than Pre-Pandemic Levels Showcases Market Appetite For Riskier Assets
GFC Median Taper Tantrum Median GFC Median Taper Tantrum Median
COVID Median Beg. of 2019 COVID Median Beg. of 2019
Beg. of 2021 Most Recent Beg. of 2021 Most Recent
1,200 1400 1314
984 1091
1,000 1200
807
1000
800 816
(bps)
(bps)
616 800
573 632
600 504 503 608
459 459 600 532
387 355 419
344 347 382
400 315
268 292 264 295 257 400 321
281
223 222 242
176 216
172 146
200 113 200 98 62 101 71 97 135
- 0
U.S. IG U.S. SG Europe Emerging Asia Latin EEMEA AAA AA A BBB BB B CCC
SG Markets America
Note: IG—Investment-grade, SG—Speculative-grade. Data as of June 21, 2021.
Sources: S&P Global Ratings, Federal Reserve Bank of St. Louis, and Bank of America Merrill Lynch.
This is not a new credit cycle, but rather a resumption of the pre-pandemic one, characterized by
borrower-friendly deal terms and the hunt for yield. Speculative-grade issuance in the U.S. and
Europe has soared to new year-to-date highs. Combined spec-grade bond and leveraged-loan
issuance through May topped $536 billion in the U.S. and €160 billion in Europe—about 3-4
months ahead of the typical annual pace. With much of the issuance used to refinance and extend
maturities, borrowers in both regions are on more-solid footing to weather any inflation/interest-
rate risks. But U.S. speculative-grade corporate real bond yields have fallen below zero, which
raises questions about whether prospective returns adequately compensate for credit risk.
Top risks
Beyond the evolving health crisis, the top risks we are watching include the potential for a
sustained upturn in inflation, rapid market repricing, and new highs in global leverage.
Inflation and market repricing
Our base case is that the surge in inflation will be transitory, given that many of the prices now
soaring are rebounding from pandemic lows or distortions and are unlikely to continue rising at the
current pace. We expect supply-chain constraints and labor imbalances will slowly ease in the
second half of the year, helping central banks keep policy rates unchanged until the first quarter of
2023 for the U.S. Federal Reserve and late 2024 for the European Central Bank (ECB). Emerging
market central banks face a more difficult challenge, with some already having to raise rates,
notably Russia, Brazil, and Mexico. However, it’s our view that the central banks that most affect
global financing conditions—particularly the Fed and the ECB—have the tools to subdue
inflationary pressures and are unlikely to have to raise rates substantially in the medium term. The
greater challenges lie in managing market expectations and timing policy shifts in a way that
S&P Global Ratings June 30, 2021 3Global Credit Conditions Q3 2021: Reopening, Reflation, Reset
doesn’t choke of recovery too soon or allow inflation expectations to build to a degree that requires
higher interest rates to control.
Inflation remains a key risk to our base case, as a build-up in inflationary pressure could hit
credit in multiple ways. In a sensitivity analysis on more than 10,000 corporates (equivalent to
about 31% of estimated corporate debt, both rated and unrated), we estimated that a twin shock of
1970s-style cost inflation and spreads at the levels of the Global Financial Crisis (GFC) could
almost double potential defaulters, to 12%, by 2023 (see “Global Debt Leverage: Spreads, Costs
Shock May Double Rate Of Loss-Making,” published June 22). The share of “highly indebted”
companies could reach almost 40%. But for most, their pushing out of debt maturities in recent
years has cushioned them against interest-cost rises—at least for now. Over time, rate rises would
increasingly weigh on debt sustainability as more debt comes due. Cost inflation is more worrying
for most, as many may not be able to pass on input-cost increases to customers.
Inflationary pressures could also make it difficult for central banks to normalize credit
conditions without triggering excessive market volatility. They may be forced to tighten monetary
policy sooner than they’d like, potentially triggering financial market volatility and a sharp market
repricing akin to 2013’s so-called “taper tantrum.” A rapid and volatile market repricing—affecting
financial and real asset prices, debt-servicing costs, and funding access—would hurt lower-rated
corporates and some emerging markets. The EMs most reliant on external financing are vulnerable
to volatile capital flows and fragile investor sentiment, while those with material foreign-currency
borrowings could suffer from an appreciation in the U.S. dollar.
Global leverage and defaults
Our base case is for default rates to fall further from their pandemic peak, as the economic
recovery drives additional improvements in credit quality, and fiscal and monetary policy remain
supportive and unlikely to be derailed by inflation. We now forecast the U.S. trailing-12-month
speculative-grade corporate default rate to decline to 4% by March 2022, from 6.3% in March of
this year (see chart 7). The outlook is similar in Europe, where we forecast the default rate to fall to
5.25% from 6.1% in March.
Chart 7
We Expect Trailing-12-Month Speculative-Grade Default Rates
To Decline In Europe And The U.S. By March 2022
U.S. speculative-grade default rate (actual) European speculative-grade default rate (actual)
U.S. base forecast (4%) Europe base forecast (5.25%)
16
12
(%)
8
4
0
Sources: S&P Global Ratings; S&P Global Market Intelligence's CreditPro®.
Increased market exposure to weaker credits is one potential risk to this view. Continuing a pre-
pandemic trend, the proportion of riskier corporate credits reached new highs with 40% of spec-
S&P Global Ratings June 30, 2021 4Global Credit Conditions Q3 2021: Reopening, Reflation, Reset
grade issuers rated ‘B-’ and below in the U.S. and 33% in Europe. Although liquidity has allowed
many borrowers to reset themselves to cope with the strains of the pandemic, it could take years
for some sectors to recover their pre-pandemic credit metrics. The weakest credits will remain
highly vulnerable to any unforeseen market or economic shocks.
Record-high debt could make for a drawn-out default cycle. Both sovereigns and corporates have
taken on substantial amounts of debt to survive or help the broader economy survive the pandemic.
A resumption of economic growth and profitability will be critical to help alleviate these debt
burdens, with a positive feedback cycle of higher profits boosting tax receipts and limiting the need
for tax increases. If the recovery proves slower than hoped, default risks might rise sharply again,
and the cost of the pandemic could rise.
As extraordinary stimulus recedes, credit pressures will continue to build on corporates in
industries that we expect won’t fully recover earnings before next year or later. This could keep
default rates above average for longer, fuel credit losses at banks, and weigh on investments and
long-term growth. For sovereigns, the impact of high debt on credit quality will depend on the
effectiveness policies to restore growth, fiscal and monetary flexibility, and exposure to shifts in
market conditions.
Sector Focus
Corporates: Recovering, but leverage risks are elevated
The pace of recovery from COVID-19 continues to vary widely by industry. Some sectors—e.g.,
telecoms, tech, and utilities—have been relatively unscathed by the pandemic, and others—such
as capital goods—have recovered rapidly. But we think it will take until well into next year, at least,
for many to recover to pre-pandemic credit metrics (see “COVID-19 Heat Map: Pent-Up Demand
And Supply Shortages Further Improve Recovery Prospects For Credit Quality,” published June 8).
Chart 8
Global M&A Deals Have Surged In Recent Quarters
Total Deal Activity (rolling 4Q) Total Deals (rolling 4Q, RHS)
4000 5000
4000
3000
3000
$ bn
2000
2000
1000
1000
0 0
*Q2 2021 is as of June 15, 2021. Data includes deal value greater than $100 million. Source: S&P Global Market Intelligence.
With many industries not returning to the pre-COVID world, capex, and M&A are likely to surge.
Shifts in consumer and corporate behavior triggered—or accelerated—by the pandemic will likely
have sustained effects that require a repositioning of business models. Capital expenditures
(capex) and mergers and acquisition (M&A) activity are the two primary routes to adjusting these,
and we expect substantial use of both routes. We expect global nonfinancial corporate capex to
increase 12% this year, its fastest pace since 2007. Similarly, global M&A exceeded $1 trillion in the
fourth quarter of last year and January-March of 2021, and we expect deal activity to remain high
(see chart 8).
S&P Global Ratings June 30, 2021 5Global Credit Conditions Q3 2021: Reopening, Reflation, Reset Economic recovery and ample liquidity have bought time, but leverage and solvency risks remain. Balance-sheet cash remains plentiful to finance investments, and private equity also has substantial capacity to acquire or reshape businesses. However, execution risk is always significant and is heightened by the uncertainties of when we will reach a post-COVID world and what form it takes. While corporates in aggregate have plentiful cash, they also have higher leverage. Moreover, much of this cash is often concentrated in the hands of investment-grade issuers in sectors seeking to be disruptors (technology), cope with disruptors (retail, autos), or deal with climate transition (utilities). Consequently, financial returns on investment could be low. The dash for cash through the pandemic was more elemental for speculative-grade issuers and, with leverage elevated, the risks posed by a stalled recovery or irrevocable industry changes are all the greater and, arguably, not fully reflected in current yields. Banks: Largely resilient In the U.S., regulations implemented since the GFC—related to banks’ capital and liquidity, underwriting, operational risk, and governance—have bolstered their resilience. Most banks were displaying good financial performance prior to the COVID-19 shock, and the pandemic’s hit to credit losses and earnings has been less severe than we first thought. As a result, we may revise the anchor—or starting point—for our ratings on U.S. banks to ‘A-’ from ‘BBB+’ in the next 1-2 years, if the stringency of regulation remains in place, the economy continues to grow and reflation is orderly, and banks maintain strong balance sheets and good asset quality. A higher anchor would lead us to raise our ratings on a number of U.S. banks that now have positive outlooks. In Europe, the effectiveness of government support and the strength of the economic rebound are benefitting banks by curbing the expected asset-quality deterioration. We remain mindful that we have yet to see the full effect of the pandemic on banks’ asset quality. Nevertheless, we think the vast majority of European banks will report improved profits this year, aided by lower credit- impairment charges, and gradually improving fee and commission income. But the threat of longer- term challenges persists, whether from a yield curve that remains quite flat in the euro area in particular, overbanked markets affecting risk-based pricing, and the battle to digitize. In Asia-Pacific, slow vaccinations in some jurisdictions could constrain the economic recovery, which could cause rigidity in banks’ credit losses. But even as relief measures are withdrawn, and with the noteworthy exception of China, we expect credit losses to decline in most major Asia- Pacific banking jurisdictions in 2021 and 2022. We expect that many systemically important banks would be beneficiaries of extraordinary government support in the unlikely event it’s needed. Emerging Markets: Pandemic perils and the risks of falling too far behind Many EMs remain far behind in vaccine availability and distribution and continue to suffer the economic drag of social restrictions to prevent the spread of the pandemic. New strains of the disease continue to surface, and the vaccines in use in many EM countries have proven less effective, posing additional threats. But the economic recovery means that pressures on sovereign ratings—while still tilted to the negative—are showing signs of a gradual stabilization. Countries’ uneven emergence from the crisis means government fiscal and monetary support is still needed and poses another risk: the resurgence of inflation and its subsequent upward pressures on interest rates coming from developed markets where economic activity is fast resuming. This could hit sovereigns reliant on foreign funding to meet their financing needs. It could also weigh on the debt-servicing capacity of governments that have piled on debt in the past year. Along these lines, a scenario in which the U.S. is “too far” ahead of the rest of the world could become problematic. The Fed’s policy rate could rise faster than is warranted by global macroeconomic conditions. And higher yields on U.S. Treasuries (which have been fairly steady so far) could raise borrowing costs for a host of countries and entities. Because global capital flows chase yields and growth, this would push investment to the U.S. and away from EMs, in particular. S&P Global Ratings June 30, 2021 6
Global Credit Conditions Q3 2021: Reopening, Reflation, Reset

A third key risk for EM sovereign ratings revolves around the social impact of the pandemic, which
could reverberate for years. Social tensions, already high before COVID-19, have been amplified and
could constrain policy makers as they unwind fiscal and monetary support.

Longer-Term Structural Risks
In the longer-term, cyber-risks continue to pose a systemic threat and significant single-entity
risk—especially as new targets and methods are emerging. As public and private organizations are
forced to accelerate their digital transformation, we believe those that employ a combination of
risk-management actions, both before and after an attack, followed by swift remediation, are best-
positioned to face this threat. By contrast, entities lacking well-tested playbooks to shape their
responses are most vulnerable.

Another secular risk is related to environmental, social, and governance (ESG) concerns—Amid
increased global awareness on climate change and recognition of the need to move to a carbon-
neutral economy, the focus on energy transition is likely to accelerate regulatory changes, disrupt
some operating models, and weigh on funding access for carbon-intensive industries. As investors
and policymakers intensify their focus on ESG factors, borrowers that are (or are perceived as
being) ESG-noncompliant could face increasing policy risks or limited access to capital—with
restrictions ranging from having to pay a premium to borrow to being shut out of capital markets.

S&P Global Ratings                                                                             June 30, 2021   7
Global Credit Conditions Q3 2021: Reopening, Reflation, Reset

Table 1
Top Global Risks
Near-Term Risks
Debt: Corporate insolvencies and new highs in government debt

Risk level*          Very low        Moderate           Elevated            High           Very high        Risk trend**            Improving            Unchanged             Worsening
With aggregate debt levels at or near record highs, some corporates and governments remain vulnerable to credit deterioration and defaults if income recovers
more slowly than expected—especially if the cost of debt starts to rise. As extraordinary stimulus recedes, credit pressures will continue to build on corporates in
industries that we expect won’t fully recover earnings before next year or later. This could keep default rates higher for longer, fuel credit losses at banks, and
weigh on investments and long-term growth. For sovereigns, the effects of high debt on credit quality will depend on policies to restore growth, fiscal and
monetary flexibility, and exposure to shifts in market conditions.

COVID-19: Uneven vaccine rollouts and new variants impede return to normal activity

Risk level*          Very low        Moderate           Elevated            High           Very high        Risk trend**            Improving            Unchanged             Worsening
Slow and uneven rollouts of vaccines in many regions, combined with a potential surge in more-contagious coronavirus variants, could make it difficult to contain
the pandemic—particularly with the highly transmissible delta variant becoming the dominant strain worldwide. Countries are becoming better at coping with the
economic effects of surges in the COVID-19 cases even during lockdowns, but any backslide in progress against the pandemic could hamper the global economic
recovery and result in challenging credit implications for some countries and sectors. Many emerging markets face higher risks due to their health-care
infrastructure and more-limited resources, with some also heavily dependent on tourism.

Markets: Disorderly reflation and market repricing risk

Risk level*          Very low        Moderate           Elevated            High           Very high        Risk trend**            Improving            Unchanged             Worsening
As inflationary pressures build (because of rising demand as social restrictions ease, supply-chain disruption, and—in certain areas—labor imbalances) central
banks may be forced to tighten monetary policy sooner than they’d like. This could make it difficult to normalize credit conditions without triggering excessive
market volatility. A rapid and volatile market repricing or inflation shock, affecting financial and real asset prices, debt-servicing costs, and funding access, would
hurt lower-rated corporates and some emerging markets. Those emerging markets most reliant on external financing are vulnerable to volatile capital flows and
fragile investor sentiment, while those with material foreign-currency borrowings could suffer from U.S. dollar appreciation.

Longer-Term Structural Risks

Secular shifts: Energy Transitions, And ESG- and cyber-related risks

Risk level*          Very low        Moderate           Elevated            High           Very high        Risk trend**            Improving            Unchanged             Worsening
Amid increased global awareness on climate change and recognition of the need to move to a carbon-neutral economy, the focus on energy transition is likely to
accelerate regulatory changes, disrupt some operating models, and weigh on funding access for carbon-intensive industries. There have also been accelerated
secular shifts across a range of industries regarding different work and consumer habits that intensify the risks of technology obsolescence for traditional
businesses. Cyber-attacks continue to pose a systemic threat and significant single-entity risk, and new targets and methods are emerging. As public and private
organizations are forced to accelerate their digital transformation, those lacking well-tested playbooks to shape their responses are most vulnerable.

Politics: Tensions spill over to economic and social conditions, exacerbate inequalities

Risk level*          Very low        Moderate           Elevated            High           Very high        Risk trend**            Improving            Unchanged             Worsening
Amplified geopolitical tensions and economic nationalism have weighed on global trade and could prompt long-term structural shifts in global supply chains.
Under President Biden, tensions between the U.S. and China have persisted, especially in technology, intellectual property, and market access. China is
continuing its drive to be less reliant on markets and technology from foreign countries, including the U.S. At the same time, the pandemic has widened
socioeconomic inequalities. Job losses have hit low-income workers harder—worsening the wealth gap in the largest economies and increasing poverty in low-
income economies—heightening the risks to political and social stability.
Sources: S&P Global Ratings.
*Risk levels may be classified as very low, moderate, elevated, high, or very high, are evaluated by considering both the likelihood and systemic impact of such an event occurring over the next
one to two years. Typically, these risks are not factored into our base-case rating assumptions unless the risk level is very high.
**Risk trend reflects our current view on whether the risk level could increase or decrease over the next 12 months.

S&P Global Ratings                                                                                                                               June 30, 2021          8
Global Credit Conditions Q3 2021: Reopening, Reflation, Reset
Related Research
Credit Conditions
– Credit Conditions Asia-Pacific Q3 2021: One Region, Two Recoveries, June 29, 2021
– Credit Conditions Emerging Markets Q3 2021: Slow Vaccination Prevents A Robust
Recovery, June 29, 2021
– Credit Conditions Europe Q3 2021: Late-Cycle Redux, June 29, 2021
– Credit Conditions North America Q3 2021: Looking Ahead, It’s Looking Up, June 29, 2021
Economic Outlook
– Global Economic Outlook Q3 2021: Picking Up Steam, Fueled By Vaccinations, June 30,
2021
– Economic Research: Asia-Pacific's Recovery Regains Its Footing, June 24, 2021
– Economic Outlook Emerging Markets Q3 2021: Despite Rising Resilience, Vaccinations Are
The Key To Recovery, June 28, 2021
– Economic Outlook Europe Q3 2021: The Grand Reopening, June 24, 2021
– Economic Outlook Latin America Q3 2021: Despite A Stronger 2021, Long-Term Growth
Obstacles Abound, June 24, 2021
– Economic Outlook U.S. Q3 2021: Sun, Sun, Sun, Here It Comes, June 24, 2021
Research
– Global Sovereign Rating Trends Midyear 2021: Recovery Will Be Uneven As Pandemic Risks
Linger, June 29, 2021
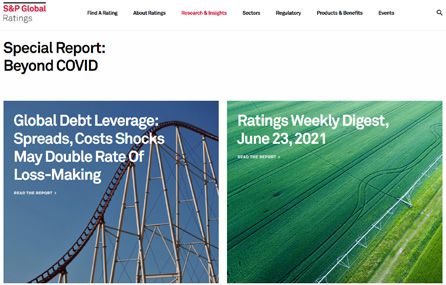
– Global Debt Leverage: Spreads, Costs Shocks May Double Rate Of Loss-Making, June 22,
2021
– COVID-19 Heat Map: Pent-Up Demand And Supply Shortages Further Improve Recovery
Prospects For Credit Quality, June 8, 2021
– The U.S. Speculative-Grade Corporate Default Rate Could Fall To 4% By March 2022, May
26, 2021
– The European Speculative-Grade Corporate Default Rate Could Fall To 5.25% By March
2022, May 26, 2021
– Take A Hike: Which Sovereigns Are Best And Worst Placed To Handle A Rise In Interest
Rates, May 24, 2021
– Credit FAQ: How The Economy, Profitability, And Regulations Could Support Certain U.S.
Bank Ratings, May 24, 2021
Only a rating committee may determine a rating action and this report does not constitute a rating action.
S&P Global Ratings June 30, 2021 9No content (including ratings, credit-related analyses and data, valuations, model, software or other application or output therefrom) or any part thereof (Content) may be modified, reverse engineered, reproduced or distributed in any form by any means, or stored in a database or retrieval system, without the prior written permission of Standard & Poor’s Financial Services LLC or its affiliates (collectively, S&P). The Content shall not be used for any unlawful or unauthorized purposes. S&P and any third-party providers, as well as their directors, officers, shareholders, employees or agents (collectively S&P Parties) do not guarantee the accuracy, completeness, timeliness or availability of the Content. S&P Parties are not responsible for any errors or omissions (negligent or otherwise), regardless of the cause, for the results obtained from the use of the Content, or for the security or maintenance of any data input by the user. The Content is provided on an “as is” basis. S&P PARTIES DISCLAIM ANY AND ALL EXPRESS OR IMPLIED WARRANTIES, INCLUDING, BUT NOT LIMITED TO, ANY WARRANTIES OF MERCHANTABILITY OR FITNESS FOR A PARTICULAR PURPOSE OR USE, FREEDOM FROM BUGS, SOFTWARE ERRORS OR DEFECTS, THAT THE CONTENT’S FUNCTIONING WILL BE UNINTERRUPTED, OR THAT THE CONTENT WILL OPERATE WITH ANY SOFTWARE OR HARDWARE CONFIGURATION. In no event shall S&P Parties be liable to any party for any direct, indirect, incidental, exemplary, compensatory, punitive, special or consequential damages, costs, expenses, legal fees, or losses (including, without limitation, lost income or lost profits and opportunity costs or losses caused by negligence) in connection with any use of the Content even if advised of the possibility of such damages. Credit-related and other analyses, including ratings, and statements in the Content are statements of opinion as of the date they are expressed and not statements of fact. S&P’s opinions, analyses, and rating acknowledgment decisions (described below) are not recommendations to purchase, hold, or sell any securities or to make any investment decisions, and do not address the suitability of any security. S&P assumes no obligation to update the Content following publication in any form or format. The Content should not be relied on and is not a substitute for the skill, judgment and experience of the user, its management, employees, advisors and/or clients when making investment and other business decisions. S&P does not act as a fiduciary or an investment advisor except where registered as such. While S&P has obtained information from sources it believes to be reliable, S&P does not perform an audit and undertakes no duty of due diligence or independent verification of any information it receives. To the extent that regulatory authorities allow a rating agency to acknowledge in one jurisdiction a rating issued in another jurisdiction for certain regulatory purposes, S&P reserves the right to assign, withdraw, or suspend such acknowledgement at any time and in its sole discretion. S&P Parties disclaim any duty whatsoever arising out of the assignment, withdrawal, or suspension of an acknowledgment as well as any liability for any damage alleged to have been suffered on account thereof. S&P keeps certain activities of its business units separate from each other in order to preserve the independence and objectivity of their respective activities. As a result, certain business units of S&P may have information that is not available to other S&P business units. S&P has established policies and procedures to maintain the confidentiality of certain nonpublic information received in connection with each analytical process. S&P may receive compensation for its ratings and certain analyses, normally from issuers or underwriters of securities or from obligors. S&P reserves the right to disseminate its opinions and analyses. S&P’s public ratings and analyses are made available on its Web sites, www.standardandpoors.com (free of charge), and www.ratingsdirect.com and www.globalcreditportal.com (subscription) and www.spcapitaliq.com (subscription) and may be distributed through other means, including via S&P publications and third-party redistributors. Additional information about our ratings fees is available at Copyright © 2021 by Standard & Poor’s Financial Services LLC. All rights reserved. STANDARD & POOR'S, S&P and RATINGSDIRECT are registered trademarks of Standard & Poor's Financial Services LLC. spglobal.com/ratings
You can also read