FY18 CORPORATE PRESENTATION - Capital First
←
→
Page content transcription
If your browser does not render page correctly, please read the page content below

FY18 CORPORATE PRESENTATION
Disclaimer

This presentation has been prepared by and is the sole responsibility of Capital First Limited (together with its subsidiaries, referred to as the
“Company”). By accessing this presentation, you are agreeing to be bound by the trailing restrictions.
This presentation does not constitute or form part of any offer or invitation or inducement to sell or issue, or any solicitation of any offer or
recommendation to purchase or subscribe for, any securities of the Company, nor shall it or any part of it or the fact of its distribution form the basis of, or
be relied on in connection with, any contractor commitment therefore. In particular, this presentation is not intended to be a prospectus or offer document
under the applicable laws of any jurisdiction, including India. No representation or warranty, express or implied, is made as to, and no reliance should be
placed on, the fairness, accuracy, completeness or correctness of the information or opinions contained in this presentation. Such information and
opinions are in all events not current after the date of this presentation. There is no obligation to update, modify or amend this communication or to
otherwise notify the recipient if information, opinion, projection, forecast or estimate set forth herein, changes or subsequently becomes inaccurate.
Certain statements contained in this presentation that are not statements of historical fact constitute “forward-looking statements.” You can generally
identify forward-looking statements by terminology such as “aim”, “anticipate”, “believe”, “continue”, “could”, “estimate”, “expect”, “intend”, “may”,
“objective”, “goal”, “plan”, “potential”, “project”, “pursue”, “shall”, “should”, “will”, “would”, or other words or phrases of similar import. These forward-looking
statements involve known and unknown risks, uncertainties, assumptions and other factors that may cause the Company’s actual results, performance or
achievements to be materially different from any future results, performance or achievements expressed or implied by such forward-looking statements or
other projections. Important factors that could cause actual results, performance or achievements to differ materially include, among others: (a) material
changes in the regulations governing our businesses; (b) the Company's inability to comply with the capital adequacy norms prescribed by the RBI; (c)
decrease in the value of the Company's collateral or delays in enforcing the Company's collateral upon default by borrowers on their obligations to the
Company; (d) the Company's inability to control the level of NPAs in the Company's portfolio effectively; (e) certain failures, including internal or external
fraud, operational errors, systems malfunctions, or cyber security incidents; (f) volatility in interest rates and other market conditions; and(g) any adverse
changes to the Indian economy.
This presentation is for general information purposes only, without regard to any specific objectives, financial situations or informational needs of any
particular person. The Company may alter, modify or otherwise change in any manner the content of this presentation, without obligation to notify any
person of such change or changes.

                                                                                                                                                               2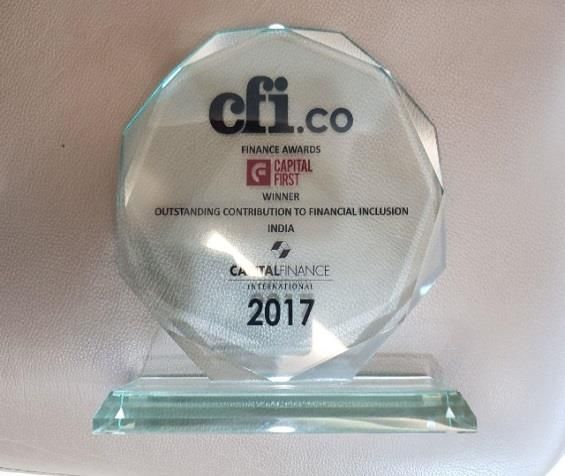
Glossary

    AUM           :             Asset Under Management
    bn            :             Billion
    CAR           :             Capital Adequacy Ratio
    CCPS          :             Compulsorily Convertible Preference Shares
    CFL           :             Capital First Limited
    Cr            :             Crore
    DII           :             Domestic Institutional Investor
    FII           :             Foreign Institutional Investor
    FPI           :             Foreign Portfolio Investor
    HFC           :             Housing Finance Company
    MSME          :             Micro, Small and Medium Enterprises
    NBFC          :             Non-Banking Finance Companies
    NCD           :             Non-Convertible Debentures
    NHB           :             National Housing Bank
    mn            :             Million
    NPA           :             Non Performing Assets
    OPEX          :             Operating Expenditure
    PAT           :             Profit After Tax
    PBT           :             Profit Before Tax
    QIP           :             Qualified Institutional Placement
    RBI           :             Reserve Bank of India
    Note: For purposes of this presentation, the exchange rate used for converting Rs to $ has been assumed as 65 unless specified.

                                                                                                                                      3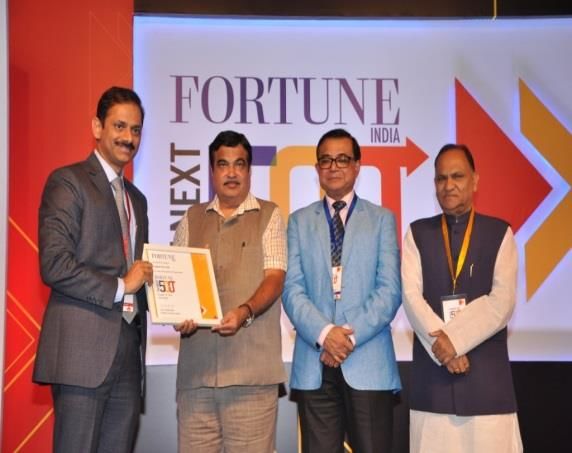
01 Overview of the Company      Page : 5

         02 Changing Asset Composition   Page : 9

         03 Product Offering             Page : 11

         04   Credit Processes

Agenda
                                         Page : 16

         05 Capital Position             Page : 20

         06 Board of Directors           Page : 21

         07 Shareholding Pattern         Page : 24

         08 Financial Results            Page : 25

                                           4
1    OVERVIEW OF   2 CHANGING ASSET   3   PRODUCT    4     CREDIT    5   CAPITAL    6   BOARD OF    7   SHAREHOLDING   8   FINANCIAL
     THE COMPANY       COMPOSITION        OFFERING       PROCESSES       POSITION       DIRECTORS         PATTERN           RESULTS

    Company’s Vision

                                               To be a leading financial services provider- admired and respected for high
                                               corporate governance, ethics and values.

                                               To primarily support the growth of MSMEs in India with debt capital through
                                               technology enabled platforms and processes

                                               To finance the aspirations of the Indian Consumers using new-age analytics
                                               and technology solutions

                                                                                                                                       5
1       OVERVIEW OF   2 CHANGING ASSET   3   PRODUCT    4     CREDIT    5   CAPITAL    6   BOARD OF    7   SHAREHOLDING   8   FINANCIAL
        THE COMPANY       COMPOSITION        OFFERING       PROCESSES       POSITION       DIRECTORS         PATTERN           RESULTS

    Introduction to Capital First
    •     Capital First Ltd, listed on BSE and NSE, is a leading Indian Financial Institution specializing in providing debt financing to Self-
          employed Entrepreneurs, MSMEs and consumers in India.

    •     The core purpose of existence for Capital First is to provide financing to India’s 50 million self employed entrepreneurs, MSMEs
          and India’s fast-emerging middle class- in a sustainable manner, with a differentiated model based on new technologies.

    •     Unlike traditional models of financing, Capital First has successfully created new, technology led models to finance MSMEs and
          Indian consumers, in the hitherto unbanked and under-served segments.

    •     With this differentiated approach, the company expanded its business operations to more than 225 locations across India

    •     Within eight years, the company has built loan assets of Rs. 26,997 Cr ($4.15 bn) as on 31 March 2018, with 94% of its loan
          assets in the Consumer & MSME financing space.

    •     Capital First has consistently maintained high asset quality over the years. The Gross and Net NPA of the Company are 1.62%
          and 1.00% respectively as of 31 March, 2018 on 90 DPD NPA recognition basis.

    •     The Book Value per Share of Capital First is Rs. 264.49 ($ 4.07) as of 31 March 2018.

                                                                                                                                          6
1 OVERVIEW OF 2 CHANGING ASSET 3 PRODUCT 4 CREDIT 5 CAPITAL 6 BOARD OF 7 SHAREHOLDING 8 FINANCIAL
THE COMPANY COMPOSITION OFFERING PROCESSES POSITION DIRECTORS PATTERN RESULTS
History of Capital First
The Company was first listed on Stock Exchanges in January 2008. Between 2010 to 2012, Mr Vaidyanathan acquired a stake in the company
and executed a Management Buyout (MBO) of the Company with equity backing of Rs. 810 Crore ($125 mn) from Warburg Pincus, and created
a new brand and entity called Capital First. As part of the MBO, the company raised fresh equity, reconstituted a new Board and got new
shareholders, including open offer to public. A brief history of the company is as follows:
2008-10 The Company was largely in the business of Wholesale Financing, PE, Asset Management, Foreign Exchange and Retail Equity Broking.
The total AUM of the Company was Rs. 935 crores ($145 mn) of which Retail AUM was 10%, Rs. 94 crores ($14 mn).
2010-11 Mr. V Vaidyanathan joined the Company and prepared the ground for executing a Management Buyout by taking significant corporate
actions including divesting Forex JV to JV partner, merging a subsidiary NBFC with itself, by winding down other non core businesses and
launching retail businesses in the Company. The Company launched technology driven financial businesses for the consumer and SME
segments. The Retail loan book crossed Rs. 700 crores ($108 mn) by March 2011. The Company presented this as proof of concept to many
global private equity players for Buyout.
2011-12 The company continued to present the concept to prospective PE players throughout the year. The Company undertook additional
corporate actions and further wound down non-core business subsidiaries and launched more retail financing businesses. The concept,
model and volume of retail financing businesses gained traction and reached to Rs. 3,660 crores ($554 mn), 44% of the overall AUM.
2012-13 Secured equity backing from Warburg Pincus for an MBO at Rs. 162 a share and thus Capital First was founded. As part of the
transaction an open offer was launched, the Company raised Rs. 100 Cr ($16 mn) of fresh equity capital, a new Board was reconstituted
and a new brand and entity “Capital First” was created.
2013-14 The Company further raised Rs. 178 Cr ($28 mn) as fresh equity at Rs. 153 ($2.35) / share. It acquired HFC license from NHB and launched
housing finance business under its wholly owned subsidiary.
2014-15 Company’s Assets under Management reached Rs. ~12,000 Cr ($1.85 bn) and the number of customers financed since inception crossed 1.0
million. The Company raised Rs. 300 Crores ($47 mn) through QIP at Rs. 390 ($6.00) / share from marquee foreign and domestic investors.
2015-16 The Company received recognition as “Business Today – India’s most Valuable Companies 2015” and “Dun & Bradstreet – India’s top
500 Companies, 2015”. The Company scrip was included in S&P BSE 500 Index.
2016-17 Company’s Assets under Management reached ~ Rs. 20,000 Cr ($3.07 bn) and the number of customers financed since inception crossed
4.0 million. The Company raised fresh equity capital of Rs. 340 Cr ($50 mn) from GIC, Singapore through preferential allotment @ Rs. 712
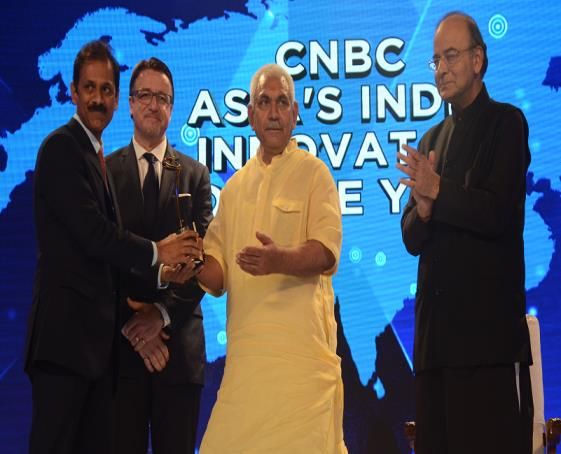
($10.95) / share. The Company received recognition as “CNBC Asia – Innovative Company of the Year, IBLA, 2017”, “Economic Times – 500
India’s Future Ready Companies 2016” and “Fortune India’s Next 500 Companies, 2016”.
2017-18 The Company’s Asset Under Management touched ~Rs. 27,000 Cr ($4.15 bn) with customers financed crossed 6.0 million. The Company
received “Best BFSI Brand Award 2018” at The Economic Times Best BFSI Brand Awards 2018 and “Financial Services Company of the
Year 2018” at VC Circle Awards 2018. In January 2018, the Company announced the merger with IDFC Bank subject to regulatory approvals.
7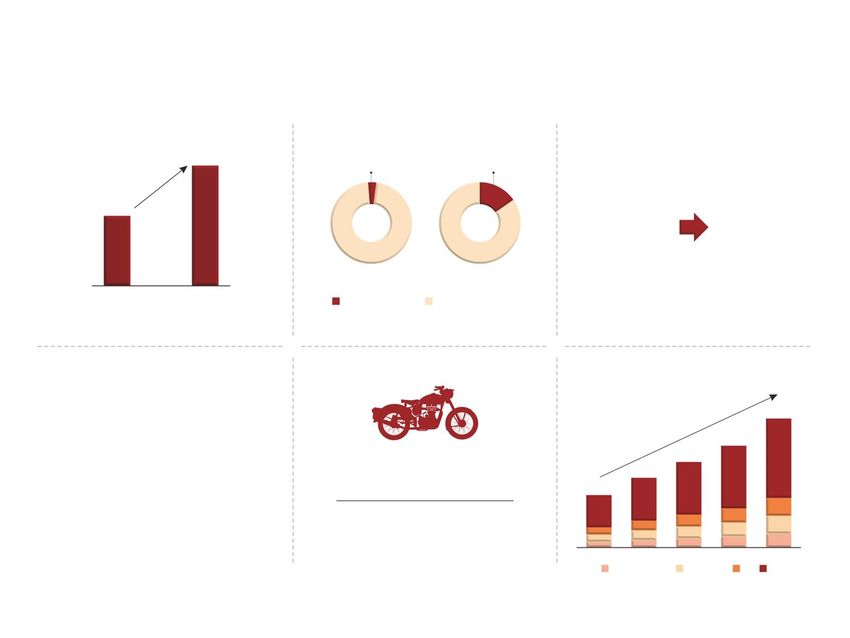
1    OVERVIEW OF     2 CHANGING ASSET   3   PRODUCT    4     CREDIT    5   CAPITAL      6    BOARD OF      7   SHAREHOLDING   8   FINANCIAL
     THE COMPANY         COMPOSITION        OFFERING       PROCESSES       POSITION          DIRECTORS           PATTERN           RESULTS

    History of Capital First (contd.)
    From 31-March-2010 to 31-Mar-2018, the company has transformed across all key parameters including:
            •      The total Capital has grown                                         from Rs. 691 Cr ($106 mn) to Rs. 3,993 Cr ($614 mn)

            •      The Assets under Management increased                               from Rs. 935 Cr ($145 mn) to Rs. 26,997 Cr ($4.15 bn)

            •      The retail Assets Under Management increased                        from Rs. 94 Cr ($14 mn) to Rs. 25,243 Cr ($3.88 bn)

            •      The long term credit rating has upgraded                            from A+ to AAA

            •      The number of lenders increased                                     from 5 to 332

            •      The Gross NPA reduced                                               from 5.28% (180 DPD) to 1.62% (90 DPD)

            •      The Net NPA reduced                                                 from 3.78% (180 DPD) to 1.00% (90 DPD)

            •      Cumulative customers financed reached                               over 6.0 million

The growth of the key parameters are as follows:
o      Total Asset Under Management has grown at a CAGR (FY13-FY18) of                29% from Rs. 7,510 Cr ($1.16 bn) (FY13) to Rs. 26,997 Cr ($4.15 bn) (FY18)

o      Total Income has grown at a CAGR (FY13-FY18) of                                47% from Rs. 357.5 Cr ($55 mn) (FY13) to Rs. 2429.6 Cr ($374 mn) (FY18)

o      Profit After Tax has grown at a CAGR (FY13-FY18) of                            39% from Rs. 63.1 Cr ($9.71 mn) (FY13) to Rs. 327.4 Cr ($50.37 mn) (FY18)

o      Earning Per Share has grown at a CAGR (FY13-FY18) of                           30% from Rs. 9 ($ 0.14) (FY13) to Rs. 33 ($0.51) (FY18)

                                                                                                                                                            8
1 OVERVIEW OF 2 CHANGING ASSET 3 PRODUCT 4 CREDIT 5 CAPITAL 6 BOARD OF 7 SHAREHOLDING 8 FINANCIAL
THE COMPANY COMPOSITION OFFERING PROCESSES POSITION DIRECTORS PATTERN RESULTS
Over the last Eight years the company has consistently stayed with the founding theme of financing self-
employed entrepreneurs MSME’s and consumers through the platform of technology & has grown the
retail franchise which has resulted in:
A highly diversified portfolio across 600 industries and over 6.0 million customers
Retail Loan Assets becoming 94% of the Overall Loan Assets
Wholesale loans reduced both in proportion of loan book as well as absolute size.
This transformation & diversification has resulted in high asset quality, consistency of growth, and sustained Rs. 26,997 Cr
increase in profits. $ 4,15 bn
Rs. 19,824 Cr
$ 3.05 bn
6%
Rs. 16,041 Cr
Retails loans $ 2.47 bn
Rs. 11,975 Cr
7%
Real Estate & Corporate Loans $ 1.84 bn
Rs. 9,679 Cr 14% 94%
Total AUM $ 1.49 bn
Rs. 7,510 Cr 16% 93%
$ 1.16 bn
19% 86%
Rs. 6,186 Cr 84%
$ 0.95 bn
26% 81%
Rs. 2,751 Cr
Rs. 935 Cr $ 0.42 bn 74%
$ 0.14 bn 44% 56%
10% 28%
72% As a result, the company’s profit growth has outpaced the growth of the loan book which
demonstrates increased efficiency in use of capital. The company plans to continue to build in
90%
this strategic direction and aims to grow the loan book at a CAGR of 25% over the next three
years.
FY10 FY11 FY12 FY13 FY14 FY15 FY16 FY17 FY18
9
1    OVERVIEW OF   2 CHANGING ASSET   3   PRODUCT        4     CREDIT    5   CAPITAL     6   BOARD OF    7   SHAREHOLDING   8   FINANCIAL
     THE COMPANY       COMPOSITION        OFFERING           PROCESSES       POSITION        DIRECTORS         PATTERN           RESULTS

    The company’s product launches have been highly successful in the marketplace and the
    company has emerged as a significant player in Indian retail financial services within eight
    years of inception with the Retail Loan Book crossing Rs. 25,243 Crores (USD 3.88 bn)

                                                                                                                                                Rs. 25,243 Cr
                                                                                                                                                ($3,884 mn)

                                                                                                                                Rs. 18,353 Cr
                                                                                                                                ($2,824Mn)

                                                                                                              Rs. 13,756 Cr
                                                                                                              ($2116 mn)

                                                                                             Rs. 10,113 Cr
                                                                                             ($1,556 mn)
                                                                             Rs. 7,883 Cr
                                                                             ($1,213 mn)
                                                             Rs. 5,560 Cr
                                                             ($855 mn)
                                          Rs. 3,460 Cr
                                           ($532 mn)
                         Rs. 771 Cr
       Rs. 94 Cr
                         ($119 mn)
       ($15 mn)

      31-Mar-10         31-Mar-11         31-Mar-12          31-Mar-13       31-Mar-14       31-Mar-15         31-Mar-16         31-Mar-17       31-Mar-18

                                                                                                                                                        10
1 OVERVIEW OF 2 CHANGING ASSET 3 PRODUCT 4 CREDIT 5 CAPITAL 6 BOARD OF 7 SHAREHOLDING 8 FINANCIAL
THE COMPANY COMPOSITION OFFERING PROCESSES POSITION DIRECTORS PATTERN RESULTS
There exists a large opportunity to finance the MSME Segment in India
Micro, Small and Medium enterprises form a large part of the Indian Economy. They generate employment and act as a catalyst for
socio-economic transformation in India. There are more than 5.1 Cr MSME enterprises across India employing more than 11.1 Cr
people.
95.1% Micro Enterprises
4.7% Small Enterprises
% of total number of MSME players in India
0.2% Medium Enterprises
Public / Private
Limited Companies Medium Enterprises
Partnership / Proprietorships /
Cooperatives Small Enterprises
Largely Proprietorship, Partnerships
Proprietorships Micro Enterprises
MSMEs account for 45% of the Indian Industrial output and 40% of the total exports
Source: “Micro, Small and Medium Enterprise Finance in India – A Research Study on Needs, Gaps and Way Forward” by IFC, Nov 2012, Ministry of MSME Annual Report, 2016-17
111 OVERVIEW OF 2 CHANGING ASSET 3 PRODUCT 4 CREDIT 5 CAPITAL 6 BOARD OF 7 SHAREHOLDING 8 FINANCIAL
THE COMPANY COMPOSITION OFFERING PROCESSES POSITION DIRECTORS PATTERN RESULTS
The Indian Consumer financing market is a huge and growing opportunity.
Rise in per capita income (US$) Rise in organized retail Urbanization and greater
brand awareness
2100
3% 18%
Urban Population to Rise
41%
1250
31%
(2011) (2030e)
2015 2020e
2013 2019e Organized retail market Unorganized retail market
Urban consumers have started to perceive
consumer durables as lifestyle products and
Increase in disposable income
Organized retail will facilitate higher are open to pay increased prices for branded
to drive affordability for higher valued
demand especially for high-end products. products.
consumer durables
Two wheeler industry* The market for white goods*
& Television has been Growing
Replacement cycle Figures are in Rs. bn
of consumer products 2021
has reduced from 1077
9-10 years 20.19 million 782
924
735
1305
No of two wheelers sold in FY18
to 674
514
618
231
4-5 years
435
108
14.80% (Y-o-Y) 86
86
81
96
87 98
223
74 262
Growth in two wheelers sales for FY18 87 101 122 140
2013 2014 2015E 2016E 2020P
Washing Machine Refrigerator AC TV
* Source: Society of India Automobile Manufacturers (SIAM) Source: MOSPI, EY study on Indian electronics and consumer durables April 2015, SIAM data
121 OVERVIEW OF 2 CHANGING ASSET 3 PRODUCT 4 CREDIT 5 CAPITAL 6 BOARD OF 7 SHAREHOLDING 8 FINANCIAL
THE COMPANY COMPOSITION OFFERING PROCESSES POSITION DIRECTORS PATTERN RESULTS
Capital First provides financing to select segments that are traditionally underserved by the
existing financing system
Traditionally these end uses are underserved by the financial system as ticket sizes are small, credit
evaluation is difficult, collections is difficult, and business is often unviable owing to huge operating
and credit costs.
Loans for Business
Loans for Plant & Expansion
Short Term
Machinery Business funding
MSMEs Loans for Two
Loans for office
display panels --------------- Wheeler purchase
Consumers
Loans for Air- Loans for Office
Conditioners Furniture
Loans for Office
Automation – PCs,
Laptops, Printers
151 OVERVIEW OF 2 CHANGING ASSET 3 PRODUCT 4 CREDIT 5 CAPITAL 6 BOARD OF 7 SHAREHOLDING 8 FINANCIAL
THE COMPANY COMPOSITION OFFERING PROCESSES POSITION DIRECTORS PATTERN RESULTS
Capital First has emerged as a Specialized Player in financing MSMEs by offering different
products for their various financing needs
Typical Loan Ticket Size From CFL Typical Customer Profile
To Small and Medium Entrepreneurs financing based on customised cash flow
Rs. 10 lacs - Rs. 2 crores
analysis and references from the SME’s customers, vendors, suppliers.
To Small Entrepreneurs/ partnership firms in need of immediate funds, for say,
Rs. 1 lakh - Rs. 10 lacs
purchase of additional inventory for an unexpected large order.
To Micro business owners and consumers for purchase of office PC, office furniture,
Rs. 15,000 - Rs. 1 lakh
Tablets, Two-Wheeler, etc.
141 OVERVIEW OF 2 CHANGING ASSET 3 PRODUCT 4 CREDIT 5 CAPITAL 6 BOARD OF 7 SHAREHOLDING 8 FINANCIAL
THE COMPANY COMPOSITION OFFERING PROCESSES POSITION DIRECTORS PATTERN RESULTS
Key Product Offerings
Average Loan Average Average Loan Challenges
Products Key Features Ticket Size Loan Tenor to Value Ratio
(Rs.) (Months) (%)
CFL provides long term loans to MSMEs after Evaluation of cash flows is a
proper evaluation of cash flows. 7,400,000 60* 45%
key challenge for credit
Backed by collateral of residential or ($ 114,000)
MSME Loans
appraisal of MSMEs.
commercial property.
Monthly amortizing products with no Businesses may undergo
moratorium. reverses over lifetime of the
CFL also provides unsecured short tenure loan that may affect
working capital loans to MSMEs. repayments
CFL provides financing to salaried segment High collection effort and
Two Wheeler Loans
as well as self employed individuals like small 53,000 24 72% costs as the collection efforts
traders, shop keepers for purchase of new ($815) required are significant due to
two-wheelers. small ticket size and large
number of customers running
into millions. Operating
expenditure is also very high.
CFL provides financing to salaried and self- High collection efforts and
22,000
Consumer Durable
employed customers for purchasing of 12 77% cost as the collection efforts
($338)
LCD/LED panels, Laptops, Air-conditioners required are significant due to
and other such white good products. They small ticket size and large
Loans
are also availed by small entrepreneurs for number of customers running
official purposes. into millions. Operating
expenditure is also very high.
Note: All the loan product related figures are for the period FY17 * On actuarial basis
161 OVERVIEW OF 2 CHANGING ASSET 3 PRODUCT 4 CREDIT 5 CAPITAL 6 BOARD OF 7 SHAREHOLDING 8 FINANCIAL
THE COMPANY COMPOSITION OFFERING PROCESSES POSITION DIRECTORS PATTERN RESULTS
Capital First is structured with inherent checks and balances for effective risk management
Credit Policy
Business Credit Loan Booking Portfolio
(For defining
Origination Underwriting & Operations Monitoring &
Lending
Team Team Team Collections
Norms)
Sales, credit, operations and collections are independent of each other, with independent
reporting lines for checks and balances in the system
161 OVERVIEW OF 2 CHANGING ASSET 3 PRODUCT 4 CREDIT 5 CAPITAL 6 BOARD OF 7 SHAREHOLDING 8 FINANCIAL
THE COMPANY COMPOSITION OFFERING PROCESSES POSITION DIRECTORS PATTERN RESULTS
Rigorous Credit Underwriting Process helps in maintaining high asset quality
In the Mortgages business at Capital First, about 38% of the
total applications are disbursed after passing through
several levels of scrutiny and checks, mainly centred
around cash flow evaluation, credit bureau and reference
checks. Most rejections are because of the lack of visibility
2-3 ✘ 38-40 or inadequate cash flows to service the loan.
✘
2-4
✘ 5-7 ✘
10-12
100 ✘
38
Application CIBIL / Credit Rejection Due to Rejection after Rejection due to Rejection for Net Disbursals
Logged in Bureau Rejection Insufficient Personal Interview Legal & Technical Other Reasons
Cashflow / Reasons
Documentation
171 OVERVIEW OF 2 CHANGING ASSET 3 PRODUCT 4 CREDIT 5 CAPITAL 6 BOARD OF 7 SHAREHOLDING 8 FINANCIAL
THE COMPANY COMPOSITION OFFERING PROCESSES POSITION DIRECTORS PATTERN RESULTS
As a result, CFL’s Asset Quality is among the best in the Indian Financial Services
Industry
The NPA in the Indian Financial services system have generally increased over the Avg. NPA Levels for top 10 Banks in India$
years. (as of 31 Mar 2018 @90 dpd NPA Recognition)
Over the last seven years, we have seen phases of reducing GDP growth rates (2010 to
2014), rupee and liquidity crisis (2013), National elections (2014), demonetisation (2016),
GST (2017).
Gross NPA Net NPA
Yet the company’s asset quality has continuously stable through these events 7.93% 4.30%
demonstrating the strong underwriting culture and capabilities in chosen product
segments.
In fact, the gross and net NPA have come down from 5.28% to 1.62% and the net NPA Avg. NPA Levels for top 10 NBFCs in India $
has come down from 3.78% to 1.00% over this period. (as of 31 Mar 2018 @90 dpd NPA Recognition)
NPA Trends for the Banks in India 8.40%
Gross NPA Net NPA
5.09% 2.23%
4.80% NPA Levels for Capital First Limited
4.10% 4.10% (as of 31 Mar 2018 @90 dpd NPA Recognition)
3.40%
2.90%
2.40% 2.50% 2.40% Gross NPA Net NPA
1.62% 1.00%
FY 08 FY 09 FY 10 FY 11 FY 12 FY 13 FY 14 FY 15 FY 16 $Numbers above represent weighted averages based on respective
loan book for the top 10 listed banks and NBFCs in India, ranked by
assets based on the published financials.
Source : RBI Gross NPA
181 OVERVIEW OF 2 CHANGING ASSET 3 PRODUCT 4 CREDIT 5 CAPITAL 6 BOARD OF 7 SHAREHOLDING 8 FINANCIAL
THE COMPANY COMPOSITION OFFERING PROCESSES POSITION DIRECTORS PATTERN RESULTS
The Company’s asset quality has consistently remained stable over the last seven years.
The Company reported NPA at 180 DPD till 2015, 150 DPD till FY16 at 120 DPD till FY17, and at 90 DPD since
FY 18 as per RBI norms. In order to enable easy comparability of NPA as a common scale, the NPA chart
below has been compiled at 90 DPD basis for the last 9 quarters.
1.74% 1.71% 1.72%
1.65% 1.63% 1.62%
1.59% 1.59%
1.52%
1.21%
1.13%
1.00% 1.00% 1.04% 1.00% 1.00%
0.97% 0.97%
Demonetization GST Launched
Nov 8th 2016 July 1st 2017
#
31-Mar-16 30-Jun-16 30-Sep-16 31-Dec-16 31-Mar-17 30-Jun-17 30-Sep-17 31-Dec-17 31-Mar-18
CFL-GNPA CFL-NNPA
191 OVERVIEW OF 2 CHANGING ASSET 3 PRODUCT 4 CREDIT 5 CAPITAL 6 BOARD OF 7 SHAREHOLDING 8 FINANCIAL
THE COMPANY COMPOSITION OFFERING PROCESSES POSITION DIRECTORS PATTERN RESULTS
The Total Capital of the Company has grown consistently from Rs. 691 Crores (31 March
2010) to Rs. 3,993 Crores (31 March 2018)
Total Capital Rs. 3,993 Cr
($ 614 mn)
Rs. 3399 Cr
($ 523 mn)
Rs. 2,739 Cr
($ 421 mn)
Rs. 2,239 Cr
($ 344 mn)
Rs. 1,787 Cr
Rs. 1,511 Cr ($ 275 mn)
($ 232 mn)
Rs. 1,032 Cr
Rs. 747 Cr ($ 159 mn)
Rs. 691 Cr
($ 106 mn) ($ 115 mn)
31-Mar-10 31-Mar-11 31-Mar-12 31-Mar-13 31-Mar-14 31-Mar-15 31-Mar-16 31-Mar-17 31-Mar-18
Note: Capital includes Networth, Perpetual Debt and Sub-Debt
201 OVERVIEW OF 2 CHANGING ASSET 3 PRODUCT 4 CREDIT 5 CAPITAL 6 BOARD OF 7 SHAREHOLDING 8 FINANCIAL
THE COMPANY COMPOSITION OFFERING PROCESSES POSITION DIRECTORS PATTERN RESULTS
Chairman, Capital First.
Mr. V. Vaidyanathan founded Capital First Ltd by first acquiring an equity stake in an existing NBFC, and then executing a
Management Buyout (MBO) by securing an equity backing of Rs. 810 crores in 2012 from PE Warburg Pincus. The MBO included (a)
buyout of majority and minority shareholders through Open Offer to public; (b) Fresh capital raise of Rs. 100 crores into the
company; (c) Reconstitution of the Board of Directors (d) Change of business from wholesale to retail lending; (e) Creation of a new
brand “Capital First”. Post the buyout he holds shares and options totalling 12% of the equity of the company on a fully diluted
basis.
He believes that financing India’s 50 mn MSMEs and India’s emerging middle class, with a differentiated model based on new
technology platforms, offers a unique opportunity in India. As part of this belief, on acquiring control of the management, he exited
legacy businesses of Real estate financing, Foreign Exchange, Broking, Investment management and instead transformed the
company into a large retail financing institution with operations in more than 225 locations across India. Between March 2010 to
March 2018, he has grown the retail financing book from Rs. 94 crores ($14 million) to Rs. 25,243 crores ($3.88 billion), has grown
the Equity Capital from Rs. 690 crores ($106 million) to Rs. 2,618 crores ($402.70 million), reduced Gross NPA and Net NPA from
5.36% (180 DPD) & 3.78% (180 DPD) to 1.62% (90 DPD) & 1.00% (90 DPD), got the long term credit rating upgraded to AAA. The
market cap of the company has increased from Rs. 790 crores ($122 million) to Rs 6,096 crores ($0.94 billion) in March 2018.
He joined ICICI Limited in early 2000 when it was a Domestic Financial Institution (DFI) and the retail businesses he built helped the transition of ICICI from a DFI to a
Universal Bank. He built the Retail Banking Business for ICICI Limited since its inception, and grew ICICI Bank to 1400 Bank branches in 800 cities, 25 million customers, a
vast CASA and retail deposit base, branch, internet and digital banking, built a retail loan book of over Rs. 1.35 trillion ($20 billion) in Mortgages, Auto loans, Commercial
Vehicles, Credit Cards, Personal Loans. He also built the SME business and managed the Rural Banking Business. These businesses helped the conversion of the
institution to a universal bank renowned for retail banking.
He was earlier the MD and CEO of ICICI Prudential Life Insurance Co (2009) and an Executive Director on the Board of ICICI Bank (2006). He was also the Chairman of
ICICI Home Finance Co. Ltd (2006), and served on the Board of CIBIL- India’s first Credit Bureau (2005), and SMERA- SIDBI’s Credit Rating Agency(2005). He started his
career with Citibank India in 1990 and worked there till 2000, where he learnt the ropes in Consumer Banking.
During his career, he and his organization have received a large number of domestic and international awards including the prestigious “Financial Services Company of
the Year, 2018 – VCCircle”, Entrepreneur of the Year Award at APEA 2017, CNBC Asia Innovative company of the year IBLA-2017, “Outstanding contribution to Financial
Inclusion, India, 2017” from Capital Finance International, London, Economic Times Most Promising Business Leaders of Asia Asian Business Leaders Conclave 2016,
‘Outstanding Entrepreneur Award’ in Asia Pacific Entrepreneurship Awards 2016, Greatest Corporate Leaders of India- 2014,Business Today – India’s Most Valuable
Companies 2016 & 2015, Economic Times 500 India’s Future Ready Companies 2016, Fortune India’s Next 500 Companies 2016, Dun & Bradstreet India’s Top 500
Companies & Corporates 2016 & 2015. During his prior stint, awards included “Best Retail bank in Asia 2001”, “Excellence in Retail Banking Award” 2002, “Best Retail
Bank in India 2003, 2004, and 2005” from the Asian Banker, “Most Innovative Bank” 2007, “Leaders under 40” from Business Today in 2009, and was nominated “Retail
Banker of the Year” by EFMA Europe for 2008. He is an alumnus of Birla Institute of Technology and Harvard Business School and is a regular contributor on Financial
and Banking matters in India and international forums.
He is a regular marathoner and has run 20 half-marathons and 8 full marathons. He lives in Mumbai with his family of father, wife and three children.
211 OVERVIEW OF 2 CHANGING ASSET 3 PRODUCT 4 CREDIT 5 CAPITAL 6 BOARD OF 7 SHAREHOLDING 8 FINANCIAL
THE COMPANY COMPOSITION OFFERING PROCESSES POSITION DIRECTORS PATTERN RESULTS
Eminent Board of Directors
N.C. Singhal Hemang Raja M S Sundara Rajan Dr. Brinda Jagirdar Dinesh Kanabar
Independent Director Independent Director Independent Director Independent Director Independent Director
Former Vice Chairman & Former Managing Director & Former Chairman & Former Chief Economist of Former Deputy CEO of KPMG
Managing Director of SCICI CEO of IL&FS Investsmart Managing Director of Indian State Bank of India. in India and Chairman of its
Ltd. (Since merged with ICICI Ltd. Bank. Tax practice. Presently, he is
Ltd.) She is an independent the CEO of Dhruva Advisors
He has served on the He is a Post graduate in consulting Economist with LLP. He has handled some of
He holds Post graduate executive committee of the Economics from university specialisation in areas the biggest tax controversies
qualifications in Economics, Board of the National Stock of Madras with relating to the Indian in India and has advised on
Statistics and Administration Exchange of India Limited specialisation in economy and financial complex structures for both
and was awarded the united and also served as a Mathematical Economics, intermediation. inbound and outbound
Nations Development member of the Corporate National Income and Social investments.
Programme Fellowship for governance Committee of Accounting. She is a Ph.D in Economics,
Advanced Studies in the field the BSE Limited. university of Mumbai, M.S. He is a Fellow Member of the
of Project Formulation and He has a total experience of in Economics from the ICAI.
Evaluation, in Moscow and He is an MBA from Abilene over 39 years in the Banking university of California at
St. Petersburg. Christian university, Texas, Industry. Davis, USA, MA in Economics He has over 25 years of
with a major emphasis on from Gokhale Institute of experience advising some of
He has 55 years of finance and an Alumni of Politics and Economics, Pune the largest multinationals in
experience in Corporate Oxford university, UK. and BA in Economics from India.
sector. Fergusson College, Pune.
He has a vast experience of
over 35 years in financial She has over 35 years of
services. experience in banking
industry.
221 OVERVIEW OF 2 CHANGING ASSET 3 PRODUCT 4 CREDIT 5 CAPITAL 6 BOARD OF 7 SHAREHOLDING 8 FINANCIAL
THE COMPANY COMPOSITION OFFERING PROCESSES POSITION DIRECTORS PATTERN RESULTS
Eminent Board of Directors
Vishal Mahadevia Narendra Ostawal Apul Nayyar Nihal Desai
Non-Executive Director Non-Executive Director Executive Director Executive Director
He is the Managing Director He is the Managing Director Prior to Capital First, Apul Prior to Capital First, Nihal
& Co-Head, Warburg Pincus of Warburg Pincus India has worked in leadership has worked with Serco India
India Private Ltd. Private Limited. positions across companies as Managing Director and
like India Infoline(IIFL), developed new markets for
Previously, he has worked Earlier, he has worked with Merrill Lynch and Citigroup. its core and new BPO
with Greenbriar Equity 3i India Private Limited (part business.
group, Three Cities of 3i group PLC, UK) and Apul is a qualified Chartered
Research, Inc., and McKinsey & Company. Accountant. He has
McKinsey & Company. successfully concluded With an Engineering degree
He holds a Chartered Global Program for in Computer Science and
He is a B.S. in Economics Accountancy degree from Management Development Post Graduate degree in
with a concentration in ICAI and an MBA from IIM, (GPMD) from Ross School of management, he has been
finance and a B.S. in Bangalore. Business, Michigan, USA. part of numerous
Electrical Engineering from management trainings from
the university of He has 13 years of He has more than 18 years institutes like Wharton and
Pennsylvania. experience in consulting and of experience in the IIM-Ahmedabad.
private equity segment. Financial Services Industry.
He has 21 years of He has more than 20 years
experience in Corporate of work experience in the
sector across the globe Financial Services domain.
231 OVERVIEW OF 2 CHANGING ASSET 3 PRODUCT 4 CREDIT 5 CAPITAL 6 BOARD OF 7 SHAREHOLDING 8 FINANCIAL
THE COMPANY COMPOSITION OFFERING PROCESSES POSITION DIRECTORS PATTERN RESULTS
Reputed marquee FIIs and DIIs have invested in CFL
Key Shareholders
Warburg Pincus, through its affiliate entities
V. Vaidyanathan
22.41%
GIC, Sovereign Wealth Fund, Singapore
FII & FPI
35.55% Government Pension Fund Global, Norway
Birla Asset Management, India
2.35%
HDFC Mutual Fund, India
HDFC Standard Life Insurance, India
15.30% Jupiter Asset Management, UK
TIAA, USA
DSP Blackrock, India
24.38%
Ashburton Limited, UK
Dimensions Group, USA
Warburg Pincus Affiliated Companies FII & FPI
Kotak Mutual fund, India
Financial Institution/Bank/MF/ Insurance Bodies Corporate ICICI Prudential Mutual Fund, India
Individuals & Others Vanguard, USA
Total # of shares as of 31 March, 2018: 9,89,65,244
Book Value per Share: Rs. 264.49 (US$4.07)
241 OVERVIEW OF 2 CHANGING ASSET 3 PRODUCT 4 CREDIT 5 CAPITAL 6 BOARD OF 7 SHAREHOLDING 8 FINANCIAL
THE COMPANY COMPOSITION OFFERING PROCESSES POSITION DIRECTORS PATTERN RESULTS
The Asset Under Management has consistently grown at a 5 year CAGR of 29%.
30,000 AUM (In Rs. Cr)-LHS Capital Adequacy-RHS 35.00%
26,997
24,755
22,974
30.00%
25,000
21,410
19,824
18,784
25.00%
17,937
17,212
20,000
16,041
14,973
20.00%
13,604
12,644
15,000
11,975
11,695
11,045
10,603
15.00%
9,679
9,071
8,244
8,024
10,000
10.00%
5,000
5.00%
- 0.00%
Q2-FY16
Q3-FY17
Q1-FY14
Q2-FY14
Q3-FY14
Q4-FY14
Q1-FY15
Q2-FY15
Q3-FY15
Q4-FY15
Q1-FY16
Q3-FY16
Q4-FY16
Q1-FY17
Q2-FY17
Q4-FY17
Q1-FY18
Q2-FY18
Q3-FY18
Q4-FY18
251 OVERVIEW OF 2 CHANGING ASSET 3 PRODUCT 4 CREDIT 5 CAPITAL 6 BOARD OF 7 SHAREHOLDING 8 FINANCIAL
THE COMPANY COMPOSITION OFFERING PROCESSES POSITION DIRECTORS PATTERN RESULTS
The Income growth at Capital First has continued to outpace growth in Operating
Expenses, resulting in continuously increasing Profitability over the years..
All figures are in Rs. Cr unless specified
Total Income Opex
712
639
564
514
476
428
395
390
346
336
306
289
274
262
242
224
210
207
200
184
176
171
158
155
144
133
116
114
110
106
103
100
98
94
91
90
86
78
75
74
Q1-FY14
Q2-FY14
Q3-FY14
Q4-FY14
Q1-FY15
Q2-FY15
Q3-FY15
Q4-FY15
Q1-FY16
Q2-FY16
Q3-FY16
Q4-FY16
Q1-FY17
Q2-FY17
Q3-FY17
Q4-FY17
Q1-FY18
Q2-FY18
Q3-FY18
Q4-FY18
261 OVERVIEW OF 2 CHANGING ASSET 3 PRODUCT 4 CREDIT 5 CAPITAL 6 BOARD OF 7 SHAREHOLDING 8 FINANCIAL
THE COMPANY COMPOSITION OFFERING PROCESSES POSITION DIRECTORS PATTERN RESULTS
Consequently, the Profit After Tax has grown with a CAGR of 39% in the last 5 years
120.0 PAT (In Rs. Cr)-LHS Cost to Income-RHS 100.00%
90.00%
100.0 95.3
80.00%
87.0
78.3 70.00%
80.0
70.8
67* 60.00%
61.4
60.0 57.6 50.00%
47.5 49*
44.5 40.00%
41.0
40.0 36.5
33* 30.00%
29.8 29.9
27.0
20.8 20.00%
20.0
10.1
7.2 10.00%
5.5
- 0.00%
Q1-FY14
Q2-FY14
Q3-FY14
Q4-FY14
Q1-FY15
Q2-FY15
Q3-FY15
Q4-FY15
Q1-FY16
Q2-FY16
Q3-FY16
Q4-FY16
Q1-FY17
Q2-FY17
Q3-FY17
Q4-FY17
Q1-FY18
Q2-FY18
Q3-FY18
Q4-FY18
*Includes one time impact of change in Standard Asset Provisioning Policy as per the RBI guideline
271 OVERVIEW OF 2 CHANGING ASSET 3 PRODUCT 4 CREDIT 5 CAPITAL 6 BOARD OF 7 SHAREHOLDING 8 FINANCIAL
THE COMPANY COMPOSITION OFFERING PROCESSES POSITION DIRECTORS PATTERN RESULTS
As a result of such business transformation, the Profit After Tax has consistently
outpaced the growth of assets every year, signifying increased profitability.
Rs. 327 Cr
($50 mn)
Rs. 239 Cr
($37 mn)
Rs. 166 Cr
($26 mn)
Rs. 114 Cr
($18Mn)
Rs. 63 Cr
Rs. 53 Cr
($10 mn)
($8 mn)
31-Mar-13 31-Mar-14 31-Mar-15 31-Mar-16 31-Mar-17 31-Mar-18
281 OVERVIEW OF 2 CHANGING ASSET 3 PRODUCT 4 CREDIT 5 CAPITAL 6 BOARD OF 7 SHAREHOLDING 8 FINANCIAL
THE COMPANY COMPOSITION OFFERING PROCESSES POSITION DIRECTORS PATTERN RESULTS
With enhanced business operations, the Return on Equity has continuously improved over the
quarters, from 2.28% in Q1-FY14 to 14.82% in Q4-FY18.
The company is confident of sustaining this trend to take the ROE to 18-20 % over the years.
13.31%
All figures are annualised
11.93%
10.14% 14.82%
14.08%
8.33%
4.93% 12.87% 13.06%
12.49%
12.10%
11.20% 11.39% 11.46%
11.09%
10.68%
10.29% 10.08%
9.58%
8.89%
8.32%
7.02%
4.15%
2.96%
2.28%
Q1 FY14
Q2 FY14
Q3 FY14
Q1 FY15
Q2 FY15
Q3 FY15
Q1 FY16
Q2 FY16
Q3 FY16
Q4 FY16
Q1 FY17
Q2 FY17
Q4 FY17
Q1 FY18
Q2 FY18
Q3 FY18
Q4 FY18
Q4 FY14*
Q4 FY15*
Q3 FY17*
*Includes one time impact of change in Standard Asset Provisioning Policy as per the RBI guideline
291 OVERVIEW OF 2 CHANGING ASSET 3 PRODUCT 4 CREDIT 5 CAPITAL 6 BOARD OF 7 SHAREHOLDING 8 FINANCIAL
THE COMPANY COMPOSITION OFFERING PROCESSES POSITION DIRECTORS PATTERN RESULTS
The Market Cap of the Company has grown steadily over the years…
Market Capitalization Rs. 7,628 Cr
($ 1,174 mn)
Rs. 6,096 Cr
($ 938 mn)
Rs. 3,937 Cr
Rs. 3,634 Cr ($ 606 mn)
($ 559 mn)
Rs. 1,478 Cr
Rs. 1,152Cr ($ 227 mn)
Rs. 781Cr ($ 177 mn)
($ 120 mn)
31-Mar-12 31-Mar-13 31-Mar-14 31-Mar-15 31-Mar-16 31-Mar-17 31-Mar-18
* Last date of Financial Year immediately preceding the Management Buyout
301 OVERVIEW OF 2 CHANGING ASSET 3 PRODUCT 4 CREDIT 5 CAPITAL 6 BOARD OF 7 SHAREHOLDING 8 FINANCIAL
THE COMPANY COMPOSITION OFFERING PROCESSES POSITION DIRECTORS PATTERN RESULTS
The Company has been steadily increasing dividend pay-out every year..
Dividend (as % of face value per share)
28%*
26%
24%
22%
20%
18%
31-Mar-13 31-Mar-14 31-Mar-15 31-Mar-16 31-Mar-17 31-Mar-18
* Dividend proposed for the year ended 31 March, 2018.
311 OVERVIEW OF 2 CHANGING ASSET 3 PRODUCT 4 CREDIT 5 CAPITAL 6 BOARD OF 7 SHAREHOLDING 8 FINANCIAL
THE COMPANY COMPOSITION OFFERING PROCESSES POSITION DIRECTORS PATTERN RESULTS
The Company has diversified its borrowing composition over the years..
Sep-17 Dec-17 Mar-18
43.5% 43.0% 45.5% 44.7% 46.0%
52.0%
4.5% 11.5% 9.3%
Total
Rs. 17,501 Cr Rs. 18,729 Cr Rs. 21,702 Cr
Borrowings
Term Loan and Cash Credit Commercial Papers NCDs
321 OVERVIEW OF 2 CHANGING ASSET 3 PRODUCT 4 CREDIT 5 CAPITAL 6 BOARD OF 7 SHAREHOLDING 8 FINANCIAL
THE COMPANY COMPOSITION OFFERING PROCESSES POSITION DIRECTORS PATTERN RESULTS
Consolidated Profit & Loss
Corresponding quarter (Q4-FY17 vs. Q4-FY18) All figures are in Rs. Cr unless specified
Particulars Q4-FY17 Q4-FY18 % Change
Interest Income 654.9 975.7 49%
Less: Interest Expense 280.4 392.6 40%
Net Interest Income (NII) 374.5 583.1 56%
Fee & Other Income 102.0 128.9 26%
Total Income 476.5 712.0 49%
Opex 241.9 394.9 63%
Provision 126.4 174.3 38%
PBT 108.2 142.8 32%
Tax 37.4 47.6 27%
PAT 70.8 95.3 35%
331 OVERVIEW OF 2 CHANGING ASSET 3 PRODUCT 4 CREDIT 5 CAPITAL 6 BOARD OF 7 SHAREHOLDING 8 FINANCIAL
THE COMPANY COMPOSITION OFFERING PROCESSES POSITION DIRECTORS PATTERN RESULTS
Consolidated Profit & Loss
Corresponding year (FY17 vs. FY18) All figures are in Rs. Cr unless specified
Particulars FY17 FY18 % Change
Interest Income 2,461.5 3,369.5 37%
Less: Interest Expense 1,160.7 1,382.5 19%
Net Interest Income (NII) 1,300.8 1,987.0 53%
Fee & Other Income 339.4 442.6 30%
Total Income 1,640.3 2,429.6 48%
Opex 829.9 1,293.9 56%
Provision 453.0 641.8 42%
PBT 357.4 493.9 38%
Tax 118.5 166.4 41%
PAT 238.9 327.4 37%
341 OVERVIEW OF 2 CHANGING ASSET 3 PRODUCT 4 CREDIT 5 CAPITAL 6 BOARD OF 7 SHAREHOLDING 8 FINANCIAL
THE COMPANY COMPOSITION OFFERING PROCESSES POSITION DIRECTORS PATTERN RESULTS
Consolidated Balance Sheet
All figures are in Rs. Cr unless specified
As on As on
Particulars
Mar 31, 2017 Mar 31, 2018
SOURCES OF FUNDS
Net worth 2,304 2,618
Loan funds 14,108 21,702
Total 16,412 24,319
APPLICATION OF FUNDS
Fixed Assets 65 95
Deferred Tax Asset (net) 72 98
Investments 44 117
Current Assets, Loans & Advances
Loan Book 15,091 23,158
Net current assets 16,231 24,008
Total 16,412 24,319
35Thank You
INVESTOR CONTACT Capital First Limited
One IndiaBulls Centre,
SAPTARSHI BAPARI Tower 2A & 2B, 10th Floor,
M : +91 22 4042 3534 Senapati Bapat Marg,
P : +91 99200 39149 Lower Parel (West),
E : saptarshi.bapari@capitalfirst.com Mumbai 400 013.
Kindly provide feedback about the presentation at Investor.relations@capitalfirst.com
www.capitalfirst.comANNEXURE
ANNEXURES

 With the increasing assets size, returns have shown a consistent growth over the last six
 years…

                    FY13      FY14       FY15        FY16         FY17       FY18        CAGR

AUM (Rs. Cr)        7,510    9,679       11,975      16,041      19,824     26,997      29%
Total Income
(Rs. Cr)
                    357.3    422.2       658.8       991.8       1,640.3    2,429.6     47%

PAT (Rs. Cr)        63.1      52.6       114.3       166.2       238.9       327.4      39%

Earning per
Share (Rs.)
                    9.00      6.37       12.56       18.24       24.53       33.34      30%

Market Cap
(Rs. Cr)
                    1,152    1,478       3,634       3,937       7,628       6,096      40%

                                                                                             38
ANNEXURES
Awards & Accolades…
“Asia Innovator Of The Year”
award at the CNBC - India “Digitalist Award” by Mint SAP,
Business Leader Awards, 2017, at Mumbai.
2017 – in Delhi
The company featured in Mr. V Vaidyanathan received
India’s Top 500 Companies & “Entrepreneur of The Year, 2017“
Corporates by Dun and award at the Asia Pacific
Bradstreet in 2017 and was Entrepreneur Award (APEA) held in
ranked 341 based on total Delhi
income.
39ANNEXURES
Awards & Accolades…
The company debuted in the
Fortune Next 500 list in August
2015 with a ranking of 273 and “Asia Pacific Entrepreneur Award
climbed to Rank 70 in the list (APEA) - Outstanding Category”,
of Fortune Next 500 2016, award at the held in Delhi
companies in August 2016 and
was awarded “Giants of
Tomorrow”
“Outstanding contribution to “Most Promising Leaders in Asia
Financial Inclusion, India, Award, 2016” by Economic Times
2017” from Capital Finance at Asian Business Leaders
International, London Conclave
40You can also read