Managing Packaging Waste in the ASEAN Region - Giz
←
→
Page content transcription
If your browser does not render page correctly, please read the page content below
Circular Economy Briefing Series
Managing Packaging Waste
in the ASEAN Region November 2018
FROM LINEAR TO CIRCULAR PACKAGING
VALUE CHAINS
Packaging is an indispensable part of retail, logistics open burning and open dumping. It blocks drainage
and the consumer goods industry. It contains, protects, systems, increasing the risk of flooding and providing
preserves and transports products from producers to breeding grounds for mosquitos carrying malaria and
consumers. Common packaging materials include plastic, other infectious diseases. Where regular waste collection
paper and board, metals, glass and wood. During the last is not available, citizens often dispose of their waste along
decades, the packaging industry has evolved significant- canals, leading to p lastic waste leakage into rivers and the
ly in terms of innovation, material use and complexity ocean. Joint efforts by policy makers and all stakeholders
of design. This trend continues in the rapidly growing along the packaging value chain are therefore required.
economies of the Association of Southeast Asian Nations
(ASEAN) where the amount of packaging has been 1) Packaging production and consumption
increasing together with the rising demand for products
and services. in the ASEAN region
The consumption of single-use packaging has
At the same time, there is growing global concern d ramatically increased in ASEAN member states due
with regard to the post-consumer management of to economic growth, rapid urbanisation and c hanging
packaging. Packaging waste constitutes a significant consumption and production patterns. In 2017, the
fraction of municipal solid waste (MSW) in the ASEAN combined population of the ASEAN region was 642
region. Plastic seems to have become an essential part of million people, with an annual population growth of
everyday lives. Increased consumption has c ontributed 1.3%.1 The combined gross domestic product (GDP) of
to waste management challenges in cities and rural the ASEAN member states totalled approximately 2.77
areas, and both human settlements and ecosystems are trillion US$, accounting for about 6.2% of global GDP.
increasingly overwhelmed with plastic pollution. Un- Growth is set to continue in ASEAN, fuelled by signifi-
managed plastic waste pollutes the air and land through cant increases in private consumption and i nfrastructure
initiatives.2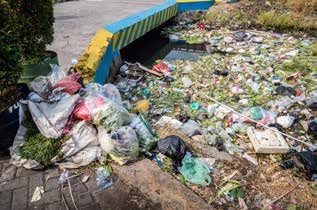
Accompanying these trends, the region has developed are sold in sachets for convenience and to serve the large
a growing “takeaway food culture’, ‘e-commerce population groups with lower purchasing power. The
activities’ and ‘sachet economy’. Consumption prefer- packaging market has increased between 2014 and 2018
ences are s hifting from traditional fresh food to pack- by an estimated 7.06% in Indonesia, 5.57% in Thailand,
aged food, while at the same time, shopping on digital 4.2% in Singapore, 3.61% in Malaysia and 3.31% in the
platforms (e-commerce) increases. Furthermore, small Philippines.3 Packaging production in ASEAN is not only
portions of products such as shampoo or instant coffee for domestic consumption but also for export markets.
PACKAGING WASTE RELATED TO GROWING E-COMMERCE IN ASEAN
Singapore (60%), Malaysia (52%) and Thailand (51%) are among the world’s top online markets with the h ighest
penetration rates for online shopping. ASEAN’s e-commerce sector is forecasted to grow by 32% to almost 90 b illion
US$ by 2025.4 A typical e-commerce parcel may use up to seven types of packaging materials: paper waybills,
envelopes, cardboard, plastic bags, woven bags, tape and buffer materials like bubble wrap, and Styrofoam.
Among these materials, cardboard represents the largest fraction of packaging waste stemming from e-commerce
activities.
Plastic production and consumption imported from China, Japan, the Republic of Korea and
Saudi A rabia.6 China is the regional leader in plastics
The ASEAN region accounts for about 20% of global production, accounting for another 20% of global plastics
plastic production. Plastics and plastic-derived prod- production. Plastics production worldwide has seen
ucts represent a significant trade sector of ASEAN, with astonishing increases since its invention: in 2015 around
41.65 billion US$ in exports and 49.28 billion US$ in 407 million tonnes were produced, compared to just 2
imports.5 Plastic resins for production are predominantly million tonnes in 1950.7
Flow Export 2017 Flow Import 2017
SG 14.8 bn VN 13.0 bn
TH 12.7 bn TH 8.6 bn
MY 7.5 bn ID 7.7 bn
VN 3.3 bn MY 7.7 bn
ID 2.4 bn SG 7.5 bn
PH 0.8 bn PH 3.5 bn
KH 0.2 bn MM 0.7 bn
MM 0.0 bn KH 0.5 bn
LA 0.0 bn LA 0.1 bn
BN 0.0 bn Total ASEAN BN 0.0 bn Total ASEAN
41.65 bn 49.28 bn
Figure 1: ASEAN export and import trade flows of 39 plastics and plastic articles in billion US$ (ASEAN Stats 2018) 8
2Growth in plastic production and consumption is »» The Philippines: Its plastic industries are expected to
strongest in ASEAN-6 (Indonesia, Malaysia, the grow with a compound annual growth rate (CAGR)16
Philippines, Singapore, Thailand, and Viet Nam). of 6.11% during 2018-2023.17 The packaging sector
uses around 48% of the total plastic production. The
»» Viet Nam: The plastic industry grew on average by annual plastic consumption is about 8 kg per capita.18
16-18% from 2010 to 2015. Packaging accounts for The country exported packaging worth 163.2 million
about 37.4% of plastic production in the country.9 PhP (3 million US$) in 2011.19
Plastics consumption in Viet Nam has increased
sharply from 33 kg per capita in 2010 to 41 kg per Flexible plastic packaging (sachets, pouches, bags and
capita in 2015.10 films) is one of the largest packaging markets in the
ASEAN region. It is forecasted to grow with a CAGR
»» Indonesia: The annual plastic consumption has risen of 5.7% for the period of 2016-2024, from 4.32 billion
to 17 kg per capita,11 with food packaging accounting US$ in 2015 to 6.71 billion US$ by the end of 2024.
for 70% of it. Indonesia imports more than 40% of its Indonesia and Thailand have the biggest markets, while
plastics from Malaysia, Thailand, Singapore, Europe the market is also growing in the Philippines, Viet Nam
and the US. and Myanmar.21
»» Malaysia: Malaysia’s plastic consumption is about Rigid plastic packaging such as PET bottles is also
35 kg per capita and year,12 of which around 45% increasing. PET packaging is used by beverage indus-
serve for packaging. The country counts over 1,500 tries to pack carbonated soft drinks, water, ready-to
production companies, exporting to other ASEAN drink tea and juice as well as packaged food, household
countries as well as to China and Europe.13 cleaning products and pharmaceuticals. Asia Pacific has
the largest market demand for global PET packaging
»» Thailand: Its plastic production industry has grown (31%), followed by North America (23%) and Western
rapidly with over 5,000 companies operating in the Europe (19%).22 The global PET packaging market was
country. Its annual plastic consumption is 40 kg per worth 48.1 billion US$ in 2014, amounting to almost 16
capita, one of the highest in the ASEAN region.14 million tonnes. Worldwide demand for PET packaging
Packaging accounts for 48% of Thailand’s plastic is expected to increase by an annual average of 4.6% over
consumption.15 the next five years, amounting to 19.9 million tonnes
worth 60 billion US$ by 2019.23
MARKET TRENDS FOR PACKAGING OTHER THAN PLASTICS IN THE ASEAN REGION
Cardboard packaging. There is a growing manufacturing base for cardboard packaging in ASEAN, mainly for healthcare
items, tobacco products, household care, and electrical goods. The booming online retail market (e-commerce) further
increases the demand, through e.g. online grocery shopping and added secondary packaging for handling and shipping.
The demand for corrugated cardboard in 2021 is expected to increase by 22.1% in Indonesia, 19.6% in Thailand, 12.7%
in Malaysia, 10.1% in the Philippines, and 1.6% in Singapore compared to 2016.24
Metal packaging. Metal packaging is growing mainly due to an increase in consumer preference for processed and
packaged food and beverage products as well as personal hygiene and cleaning products. Beverages still represent the
largest share with 65% of the global metal packaging market.25 In Thailand, there are 45 metal packaging companies.
A total of 579,511 tonnes of metal packaging was used in 2013 for seafood (45%), fruit and vegetable cans (25%) and
other packaging (30%).26
Glass Packaging. Glass packaging is forecast to have the lowest growth rate by 2020 compared to other p ackaging,
amounting to 63.87 billion US$ in the global market.27 It is often associated with luxury goods such as alcoholic
beverages, wine, champagne and perfumes. The healthcare industry is one of the leading users in the global glass
packaging market.28
Wooden Packaging. Wood is usually used as industrial packaging and for secondary or tertiary packaging such as
pallets and light wooden packaging. Such packaging materials are often for bulk transport and less likely to reach
end-consumers. Increased consumption of wooden packaging is therefore associated with corresponding growth in
manufacturing activities.
3Stakeholders in packaging value chains 2) Packaging waste generation and
management in the ASEAN region
Packaging value chains involve a wide array of stake-
holders. In the ASEAN region, packaging value chains
Most packaging waste is part of municipal solid
still follow a linear model of “take, make and dispose”
waste, reliable data on waste flows is often lacking.29
rather than a circular economy of “reduce, reuse, and
Unlike European countries, which are mandated by
recycle”. Packaging value chains consist of the following
the EU Packaging Directive to segregate and maintain
steps:
statistics on packaging waste generation and treat-
ment,30 ASEAN countries do not monitor total volumes
»» Resource extraction: material manufacturers use various
and types of packaging waste generation and flows. In
materials for different packaging e.g. oil for plastics,
addition, there are no separate statistics on the packaging
wood for paper and cardboard, and aluminium for
fraction in MSW.
beverage cans. Resource extraction and transport
causes greenhouse gas emissions and environmental The average municipal solid waste generation in
impacts on ecosystems. ASEAN is 1.15 kilogrammes per capita and day. It
consists of about 52% organic waste, 14% plastics, 9%
»» Design and production of packaging: packaging paper, 4% metals and 3% glass (Figure 3), however this
designers and manufacturers can choose input varies between countries and rural or urban settlements.
materials, use recycled materials and increase the Packaging waste is becoming a prominent component of
recyclability of packaging. The material composition, MSW in ASEAN member states.
form, size and weight of packaging influences the
degree of resource efficiency. Construction debris 14%
Grass/wood
waste 1%
»» Retail & consumption: Consumer goods companies
are key players. They procure packaging and sell Rubber 1%
Others
their packaged products to retailers. Supermarkets, 12%
Textile 2%
market stands and other merchants sell products to
Glass 3%
consumers, who dispose of the packaging waste.
Metal 4% Food/
organic
»» Waste collection, sorting and recycling: In the absence of waste
extended producer responsibility (EPR) mechanisms Plastic 52%
in the ASEAN region, post-consumer packaging waste 14%
management is usually the responsibility of local
Paper
governments and waste operators (public/private/ 9%
NGO, formal/informal).
Use of Resource Figure 3: MSW composition in ASEAN (in %); Data extracted
secondary raw extraction from UNCRD Regional 3R Forum; UNEP, AIT, ISWA,
materials 201731
Sorting & Circular
recycling economy
Design &
production
Collection
Retail &
consumption
Figure 2: Transforming packaging value chains from a
linear to a circular economy
4
TABLE 1: MSW Situation in ASEAN Member States *Diversion includes recycling, composting, energy recovery, etc. (not
landfilling and other disposal) ** In Singapore, share of total waste generated
COUNTRY GDP (% of Population Annual MSW Per Capita MSW Share of Waste
overall ASEAN (% of ASEAN generation MSW collection plastic, anagement
M
GDP), 201632 pop. of 639 generation coverage paper, metal status (in %)
million), (kg/capita/ (%) and glass in
201633 day) MSW (%)
Brunei 11.40 billion US$ 0.42 million 0.21 million t 1.4 50-70% 41% Diversion*: 30%
(0.45%) (0.07%) (2014)34 Disposal: 70%
Darus-
salam
Cambodia 20.02 billion US$ 15.76 million 1.08 million t 0.2036 80% 21%
(0.78%) (2.47%) (2014)35
Indonesia 932.26 billion 261.12 million 65.03 million t 0.76 45-50% 29% Diversion: 14%
US$ (36.49%) (40.89%) (2016)37 Disposal: 86%
Lao PDR 15.90 billion US$ 6.76 million 0.07 million t 0.69 40-70% 20% Diversion: 9 %
(0.62%) (1.06%) (2014)38 Disposal: 91%
Malaysia 296.97 billion 31.19 million 13.70 million t 1.17 70% 36% Diversion
US$ (11.60%) (4.88%) (2017)39 (recycling): 21%
Myanmar 67.43 billion US$ 52.89 million 2.04 million t 0.44 50% 13% Diversion: 8%
(2.64%) (8.28%) (2012)40 Disposal: 92%
Philippines 304.90 billion 103.32 million 14.60 million t 0.51 40-85% 26% Diversion: 47%
US$ (11.94%) (16.18%) (2016)41 Disposal: 53%
Singapore 296.97 billion 5.61 million 1.61 million t 0.81 100% 46%** Diversion: 97%
US$ (11.62%) (0.88%) Disposal: 3%
Thailand 406.84 billion 68.86 million 27.37 million t 1.13 58% 31% Diversion: 31%
US$ (15.93%) (10.78%) (2017)42 (2017) Disposal: 69%
Viet Nam 202.62 billion 92.70 million 19 (in 2015)43 1.2 40-85% 24% Diversion: 44%
US$ (7.93%) (14.52%) Disposal: 56%
Plastic packaging accounts for the largest fraction Parts of post-consumer packaging waste in MSW are
of packaging waste. Single-use packaging such as recycled. Some high value materials like PET bottles,
c arrier bags, bottles and food packaging as well as other glass bottles and metals (tin and aluminium) tend to be
single-use plastic items such as straws, cups, plates and collected and recycled through formal and/or informal
cutlery have grown exponentially over the last decades. channels to a certain extent. Recycling either takes
Despite various regulatory, economic and voluntary place domestically or recyclables are exported to other
measures to reduce plastic bags, consumers continue to countries. Before China’s prohibition on the import of
use them frequently. Plastic sachets, a multi-layered pack- recyclable items including plastic waste, ASEAN member
aging made of a thin film of plastic and aluminium, have states also exported recyclable waste to China. Low value
also become widespread. Because of their lightweight and items such as single-use plastic cups, straws, grocery bags
multi-layer nature, sachets often skip recycling and make and sachets tend to remain uncollected and often are
their way into landfills, drainage systems or waterways. landfilled, burned or disposed along waterways.
5According to estimates, four ASEAN countries Single-use packaging and products represent a
(Indonesia, the Philippines, Thailand, Viet Nam) and significant fraction of beach litter. As documented by
China contribute to about half of the world’s marine coastal clean-up events, the Top 10 items collected in the
plastic litter generation. In these five countries, around ASEAN region include: food wrappers, cigarette butts,
2.5 to 6.7 million tonnes of plastic waste entered from plastic beverage bottles, plastic bottle caps, plastic g rocery
coastal areas into the ocean in 2010, compared to a bags, other plastic bags, straws and stirrers, p
lastic flakes,
global leakage of 4.8 to 12.7 million tonnes in the same plastic lids, and foam take away containers.48 Besides
year.44 Once in the ocean, only parts of plastic waste its environmental effects, such beach litter can also be
float at the surface or are washed onto beaches. Signif- detrimental for tourism industries. Approaches counting
icant amounts of plastics sink towards the seafloor and the number of litter items found within a given area of
disintegrate over time into ever-smaller plastic particles.45 beaches, coastlines, rivers or the ocean surface or within
Such micro-plastics (< 5 millimetres) spread throughout a specific set of animals are however limited in scope.
the food chain and are also found in several seafood and A complementary approach for assessing marine plastic
fish species used for consumption.46 Understanding its litter generation within a city or a Province consists in es-
eco-toxicological and human health effects still requires timating plastic waste flows based on key data such as the
further research. Sea animals such as turtles, seagulls and population number, plastic waste generation per capita,
whales ingest also larger plastics, affecting their d igestion. collection coverage and efficiency rates and several other
Around 817 species are affected by marine litter world- factors (see case study of Sidoarjo Regency, Indonesia).
wide, including effects by entanglement in abandoned,
lost or otherwise discarded fishing gear.47 Marine
resources provide significant livelihood support for 70%
of the ASEAN population who dwell in coastal zones.
CASE STUDY: ESTIMATED PLASTIC WASTE FLOWS IN SIDOARJO REGENCY, INDONESIA
Located in Eastern Java at the sea south of Surabaya,
Sidoarjo Regency counts about 2.4 million inhabitants. It
participates in the “Emission Reduction in Cities – S olid
Waste Management” project between the Indonesian
Government and KfW Development Bank. In 2017, GIZ has
tested a methodological approach to estimate plastic waste
flows and marine litter generation in Sidoarjo Regency for
a global “Marine Litter Prevention” study.50 Based on the
population number, MSW generation of 0.65 kg per capita, a
plastics share of 9% as well as a special factor for taking
into account plastics in hygienic waste, the study estimated
total plastic waste production at 56,073 tonnes in 2017.
Based on several other factors, the study calculated that
around 31,390 tonnes of plastic waste remained uncollected.
Parts of the uncollected waste as well as additional leakage Waste accumulation in canal, Sidoarjo, Indonesia
from formal and informal waste management led to about
9,066 tonnes of plastic waste entering waterways. Using additional factors to estimate retention of plastics in water-
ways, the study calculates a total marine plastic litter generation of 7,616 tonnes in 2017. It corresponds to 3.17 kg of
marine plastic litter per capita, equivalent to 106 plastic bottles (with a weight of 30g per bottle). Through two different
5 years’ scenarios, the amount could drop to 7,342 tonnes (2.82 kg per capita) or 5,816 tonnes (2.23 kg per capita) by
2022, including forecasted population growth.
3) Policy landscape for managing MSW ASEAN Member States implement or plan to implement
regulatory and economic measures such as plastic bag
and packaging waste bans and plastic taxes to curb plastic use. Private compa-
In ASEAN Member States, there are few specific nies also implement voluntary campaigns to encourage
policies or legal frameworks addressing packaging consumers to reduce their plastic consumption and opt
waste management. Legal and policy frameworks on for alternatives to plastic bags. However, in such cases the
municipal solid waste mention certain types of pack- ecological footprints of alternative packaging need to also
aging waste, especially plastic waste (Table 2). Some be considered.
6Recent international declarations envisage a world- land-based pollution. Regional dialogue on marine litter
wide reduction of plastic waste leakage into oceans. prevention has been taking place in the framework of
The United Nations’ Sustainable Development Goal 12 ASEAN, the East Asia Summit, Partnerships in Environ-
on sustainable consumption and production and Goal 14 mental Management for the Seas of East Asia (PEMSEA)
on marine conservation call for enhancing waste man- and the Asia-Pacific Economic Cooperation (APEC).
agement and reducing marine litter. Several governments
and other stakeholders made voluntary commitments Some ASEAN Member States have come forward
during the UN Ocean Conference in June 2017 in to tackle marine plastic leakage with strategies and
New York, USA. In July 2017, the Group of 20 (G20) action plans. Indonesia launched the ‘National Action
adopted in Germany a G20 Action Plan on Marine Litter. Plan on Marine Debris (2017-2025)’, which calls for
The UN Environment Assembly adopted in December efforts to reduce 70% of its plastic debris from a 2017
2017 a third resolution on ‘Marine litter and microplas- baseline by the end of 2025. In Viet Nam, the Prime
tics’.51 All ASEAN countries, except for Cambodia, have Minister’s Decision No. 06/2018/QD-TTg of 2018 seeks
also legally signed the UN Convention on the Law of the to reduce marine pollution. Thailand has drafted a Plastic
Sea, according to which states have the obligation to take Debris Management Plan (2017-2021), which targets to
measures for marine conservation, including reducing increase plastic waste recycling to at least 60%.
TABLE 2: Frameworks for MSW and plastic waste management
Policy framework for municipal solid waste Policy framework for packaging/
Country
(MSW) management plastic/marine litter52
Brunei • No specific policy or legal framework • Restricts the use of plastic bags from Friday to Sunday
• Supports the 3R concept and intends to ban plastic bags in supermarkets by
Darussalam 2019.
Cambodia • Law on Environmental protection and Natural Resources • Sub-Decree No. 168 GNKR.BK on the Management of
Management 1196 Plastic Bags of October 2017.53 According to Art. 14,
• Sub-Decree on Urban Solid Waste Management No. 113 plastic carrier bags shall be prohibited for importation,
(2015) local production, distribution and use unless its thick-
ness is from 0.03 millimetres with a base width from 25
• Sub-Decree on SWM (1999) centimetres.
• Inter-Ministerial Declaration of Ministry of Interior and • Supermarkets charge KHR 400 (0.10 US$) per plastic
Ministry of Environment on Waste and Solid Waste bag.
Management in Provinces/ Municipalities of Cambodia,
No. 80 (2003)
Indonesia • Environmental Protection and Management Act No. 32 • The National Action Plan on Marine Debris (2017-2025)
(EPMA 32/2009) calls for efforts to reduce 70% of marine plastic debris
• Law No. 18/2008 on MSW management, (from 2017 baseline) by the end of 2025.
• Regulation No. 81/2012 on 3Rs and EPR • Plastic bag tax (200 rupiah/bag, 0.01 US$) for a trial
period of 3 months in 2016 at retailers in 23 cities.
• President Regulation No. 97/2017 on Policy and National
Strategy on MSW • Ban on plastic bags in Banjarmasin city since 2016,
resulting in a reduction of 80%. The city of Bandung
• Presidential Regulation No. 97/2017 Solid Waste introduced a similar ban on the use of Styrofoam. Bogor
Management National Policy and Strategy (2017-2025) city issued in July 2018 a plastic bag ban.
• New initiative “Ngaji Sampah” (“Sermons on Waste”)
with Indonesia’s two largest Islamic organizations,
Nahdlatul Ulama (NU) and Muhammadiyah to reduce
plastic usage and switch to reusable bags
• The Ministry of Industry considers increasing bio-based
plastic consumption to 5% of total national plastic con-
sumption. The current use of bioplastic in the country is
less than 0.001% (around 3,000 t/year)
Lao PDR • Environment Protection Law 1999 • Encourages the use of recyclable bags in cafes and
• No comprehensive policies for MSW management markets.
• Waste management is included in the National
Environmental Strategy 2020
7TABLE 2: Frameworks for MSW and plastic waste management
Policy framework for municipal solid waste Policy framework for packaging/
Country
(MSW) management plastic/marine litter52
Malaysia • Environmental Quality Act 1974 • Imposes plastic tax
• Solid Waste and Public Cleansing Management Act 2007 • Ban on plastic bags and polystyrene containers in
Selangor and Federal Territories54
• “Unforgettable bag” scheme of Tesco: Consumers bring
bar coded bags and receive a cash rebate of 0.20
ringgit (0.05 US$) per bag55
Myanmar • National Environmental Policy of 1994 • Mandalay city banned the use of plastic bags in 2009,
• National Waste Management Strategy for Myanmar (in Yangon in April 2011
technical support with UNEP) • ‘No plastic bag day’ of City Mart since 2013 (every last
Monday and Tuesday of the month). Customers bring
their own bag, purchase a reusable bag, or pay 100
Kyat (0.07 US$) per single-use plastic bag.56
Philippines • Ecological Solid Waste Management Act of 2000 (RA • Department of Environment and Natural Resources (DENR)
9003) urged the public to avoid disposable plastic products.
• Presidential Decree No. 856 (Code of Sanitation of the • Local Government Units practice and propose plastic
Philippines) use reduction measures by passing Ordinances, e.g.
• Resolution adopting the National Framework Plan of the Ordinance No. SP-2140 on Plastic Bag Reduction in
Informal Sector in Solid Waste Management, 2010 Quezon City (since 2012)
• Resolution adopting Prototype City/ Municipal Ordinance • Proposed bills on single-use plastics: Senate Bill No.
Regulating the Establishment and Operation of Junk 1866 – Plastic Straw and Stirrer Ban of 2018; Plastic
Shops & Provide Corresponding Penalties, 2010 Bags Regulation Act and Senate Bill No. 2759 – Total
Plastic Ban Act of 2011; Philippine National Stand-
ards (PNS) 2097:2014 on Plastics Shopping Bags, PNS
2092:2011 on biodegradable plastics
• Government offices in Dipolog City and Cebu City avoid
single-use plastic items in their premises
• Some public markets and supermarkets participate in
the “Bring Your Own Bag” (BYOB) campaign to encourage
consumers to bring reusable bags
Singapore • Environmental Public Health Act • Disallowed the use of disposables for dining-in at new
• Environmental Public Health (General Waste Collection) hawker centres.
Regulations • Singapore Packaging Agreement (SPA) of 2007 for
• Sustainable Singapore Blueprint reducing packaging waste57
• Environmental Public Health (General Waste Disposal
Facility) Regulations
• Environmental Public Health (General Waste Disposal
Facility - Exemption) regulations
• Environmental Public Health (Public Cleansing) Regulations
• Code of Practice on Environmental Health (COPEH)
Thailand • The Environment and Conservation of National • “Say No to Plastic Bag” campaign in 11,000 mini-marts
Environmental Quality Act B.E. 2535 (1992 AD) and convenience stores
• The Act on the Maintenance of the Cleanliness and • MONRE made a MoU with 16 business organisations to
Orderliness of the Country Public Sanitary and Order not distribute plastic bags to their customers on the
Act B.E. 2535 (1992) and B.E. 2560 (updated in 2017) 15th and 30th of each month
Chapter III/1 • Campaigns to axe plastic cap seals of drinking water
• Public Health Act, B.E. 2535, Chapter III bottles (effective from 1 April 2018)
• The National Master Plan on Waste Management 2016- • Prohibition of plastic bags and Styrofoam containers
2021 promotes 3R, in national parks (announced by the Department of
• Thailand Zero Waste 2016-2017 Action Plan National Parks, Wildlife and Plant Conservation, T hailand
on 8 June 2018)
• The Department of Medical Services, Ministry of Public
Health announced to phase out the usage of plastic
bags in its 30 hospitals from 1 October 2018 (to reduce
usage of 9 million bags per year)
• The Sustainable University Network (SUN) campaign
with 27 universities to reduce single-use plastic on all
campuses by 80-90 % over the year 2018
• “Public-Private Partnership for Sustainable Plastic and
Waste Management” initiative, launched in June 2018
and led by the Plastic Industry Club, aims to halve the
amount of ocean waste of Thailand by 2027
8TABLE 2: Frameworks for MSW and plastic waste management
Policy framework for municipal solid waste Policy framework for packaging/
Country
(MSW) management plastic/marine litter52
Viet Nam • Law on Environmental Protection (Amended in 2014) • Government imposes an environment tax on plastic
• The National Strategy on Integrated Solid Waste bags, which is VND 40,000 (US$ 1.76) per kilogram.
Management until 2025, vision to 2050 (Decision No. • Par. 4, Art 3 of the Environmental Protection Tax Law
2149/QD- TTg) (Decree No. 67/2011/ND-CP), imposes a tax on plastic
• Decree No. 38/2015/ND-CP on solid waste management bags (30,000-50,000 VND/kg; 1.3-2.1 US$).
and scraps- effective from 15 June 2016 • Circular No. 07/2012/BTNMT details regulation on
eco-friendly plastic bags.
• Decision No. 582/QD-TTg in 2013 on enhancing the
control of environmental pollution due to the use of
non-biodegradable plastic bags by 2020
• Temporary restrictions on the import of plastic scraps
and stop of issuing new licenses for scarp import
activities (since July 2018)Large businesses and
enterprises in Viet Nam have introduced alternative
bags for shoppers
Extended Producer Responsibility (EPR) in ASEAN In the ASEAN region, private companies are
currently taking voluntary approaches to managing
Extended Producer Responsibility (EPR) is an their packing waste as part of their Corporate Social
environmental policy approach to involve the private Responsibility activities. PRAISE in Indonesia is
sector along the whole value chain in the management engaged in recycling as well as public education and
of packaging waste.58 Consumer goods companies put- awareness raising activities. Similarly, the Philippine
ting packaged products on the market remain responsible Alliance for Recycling and Materials Sustainability
for the packaging throughout the whole lifecycle, also (PARMS), a multi-sectoral coalition composed of top
for the associated waste management. It involves finan- consumer goods companies, plans to build a 25 million
cial contributions for the collection and treatment of the PhP (460,000 US$) recycling facility for plastic sachets
post-consumer packaging waste in the EPR system. EPR in Metro Manila.60
has been successfully applied for packaging waste man-
agement in the European Union. The concept is however Singapore is a step ahead in encouraging producers
relatively new in the ASEAN region and often limited to adopt cost-effective solutions to reduce packaging
to some waste categories such as end-of-life vehicles and waste through the Singapore Packaging Agreement
waste from electrical and electronic equipment. (SPA). Launched in 2007, SPA is a joint voluntary
initiative by the government, industry and NGOs to
Some ASEAN countries attempt to include EPR reduce packaging waste. The National Environment
principles in the packaging waste sector. For instance, Agency (NEA) requires SPA signatories to record their
Indonesia has included the EPR concept in its Waste packaging waste data and adopt cost-effective solutions
Law 18/2008. Article 15 of the Law states: ‘The producer to reduce their packaging waste. 229 signatories (as of
is obliged to manage the packaging of their products, July 2018) are reported to have cumulatively reduced
which are unable or difficult to be decomposed.’ In close to 46,000 tonnes of packaging waste and saved
practice however, EPR has not been applied. The ‘Pack- over Singaporean $100 m illion (73 million US$) since
aging and Recycling Alliance for Indonesia Sustainable 2007. Though producers are brought into the process
61
Environment (PRAISE)’, a group of private companies, is of m
anaging packaging waste, SPA is still a voluntary
advocating for an ‘Extended Stakeholder Responsibility’ agreement.
concept,59 which it perceives as a more balanced approach
of shared responsibilities among producers, local govern-
ments and consumers.
9In ASEAN countries, packaging waste is often a frac- Existing voluntary measures by the private sector
tion of municipal solid waste and local governments could be enhanced by adopting EPR policies and
have the sole responsibility for its management. How- providing space for the private sector to elaborate
ever, EPR can become a model for shared responsibilities implementation strategies, supervised by public
for packaging waste management as some experience agencies. Similarly, consumers are also important stake-
exists with the concept, e.g. in electronics, household holders in packaging value chains. Promoting sustainable
hazardous waste and end-of-life vehicles. An all-stake- consumption practices to reduce single-use packaging
holder negotiation is required for ensuring everybody’s and to increase waste segregation for recycling is therefore
interests are included for breaking through the EPR essential. Behaviour influencing measures such as public
impasse in the packaging sector. education and awareness raising as well as regulatory and
economic measures are potential approaches for this.
Outlook
Adopting an integrated approach to reducing
In the ASEAN context of rapidly increasing packaging packaging waste and improving waste management
consumption, moving from the linear model of ‘take, would provide environmental as well as socio-
make and dispose’ to a circular economy of ‘reduce, economic benefits. Waste minimization and resource
reuse and recycle’ (3R) becomes an urgent e ndeavour recovery c ontribute to preserving limited virgin r esources,
by all stakeholders in packaging value chains. Human avoiding greenhouse gas emissions, protecting water
resources, institutional arrangements as well as financial quality and conserving ecosystems. Circular economy in
and motivational incentives are required to enhance packaging value chains can also create jobs and im-
packaging waste management. Political will and leader prove w orking conditions. Coordinated action by policy
ship are crucial to promote and support legislations and makers, consumer goods companies, retailers, citizens
policies for effective and efficient practices across the and other stakeholders are required for transforming
entire packaging value chains. It includes promoting linear packaging value chains into circular ones.
stakeholder participation, integrating the informal sector
and providing the right atmosphere for investing in
recycling through public private partnerships. It is also
critical to develop substantial databases on packaging
waste to enable evidence-based policy formulation and
decision making in the region.
References
1 ASEAN Stats 2018 https://data.aseanstats.org/sits-by-reporters-and-services
2 Statista (2018) ‘Gross domestic product (GDP) of the ASEAN countries from 2008 to 2018 (in billion U.S. dollars). Website.
https://www.statista.com/statistics/796245/gdp-of-the-asean-countries/ ASEAN (2017) ASEAN Economic Progress 1967-2017.
https://www.aseanstats.org/wp-content/uploads/2017/08/ASEAN_economic_progress.pdf
3 Statista Portal (2018) ‘Forecasted growth of the packaging market in the Asia Pacific region between 2014 and 2018 by country’. Website.
https://www.statista.com/statistics/650205/asia-pacific-forecast-growth-of-packaging-market-by-country/
4 Singapore Business Review (2018) ‘ASEAN e-commerce forecasted to grow 32% to almost US$90b by 2025’. Website.
https://sbr.com.sg/economy/asia/asean-e-commerce-forecasted-grow-32-almost-us90b-2025
5 ASEAN Stats 2018. https://data.aseanstats.org/dashboard/imts.hs2
6 ASEAN Stats 2018: https://data.aseanstats.org/dashboard/imts.hs2
7 Geyer, Roland; Jambeck, Jenna R.; Law, Kara Lavender (2017) ‘Production, use, and fate of all plastics ever made’. Science Advances.
http://advances.sciencemag.org/content/3/7/e1700782.full OECD (2018) Improving Markets for Recycled Plastics. P. 12.
http://www.oecd.org/environment/improving-markets-for-recycled-plastics-9789264301016-en.htm PlasticsEurope mentions a production of 335
million t of plastics in 2017 in PlasticsEurope (2018) Plastics - the Facts 2017.
8 ASEAN Stats 2018: https://data.aseanstats.org/dashboard/imts.hs2
9 Plastics Viet Nam (undated) ‘Industry News’. Website.
http://plasticsvietnam.com/useful-information/undustry-news/asean-region-sees-favorable-climate-for-plastics.html
10 Tran Thi Thu Trang (2016) Viet Nam Plastic Industry Report. Vietcombank Securities. P. 2.
https://www.vcbs.com.vn/en/Communication/GetReport?reportId=4778
11 Rahajeng Kusumo (2017) ‘Plastic Imports to Surge by 15% in 2017: Inaplas’. Jakarta Globe, 16 May 2017.
https://jakartaglobe.id/business/plastic-imports-to-surge-by-15-in-2017-inaplas/
12 Corben, Ron (2017) ‘Asia’s Booming Plastics Industry Prompts Ocean Pollution Fears’. VOA News, Website.
https://www.voanews.com/a/asia-plastics-industry/3911586.html
13 Plastics Viet Nam (undated) ‘Industry News’. Website.
http://plasticsvietnam.com/useful-information/undustry-news/asean-region-sees-favorable-climate-for-plastics.html
1014 Corben, Ron (2017) ‘Asia’s Booming Plastics Industry Prompts Ocean Pollution Fears’. VOA News, Website.
https://www.voanews.com/a/asia-plastics-industry/3911586.html
15 Wongpromrat, Kriengsak (2013) ‘ASEAN ‘Plastic End-user Market Trend’. Presentation, Plastics Institute of Thailand.
http://www.ftiplastic.com/images/download/177/5.1ASEAN%20Plastics%20End-use%20Market%20Trend%20AFPI.pdf
16 CAGR is a measure of growth over multiple time periods
17 Mordor Intelligence (2018) ‘Philippines Plastics Market – Segmented by Type, Technology, and Application – Growth, Trends, and Forecast
(2018-2023)’. Website. https://www.mordorintelligence.com/industry-reports/philippines-plastics-market
18 Wongpromrat, Kriengsak (undated) ‘ASEAN plastic end-user market trend’. Presentation. Plastics Institute Thailand.
19 The Philippine Star (2012) ‘Phl packaging industry gears up for growth’. Website.
https://www.philstar.com/business/2012/06/18/818050/phl-packaging-industry-gears-growth
21 Transparency Market Research (2017) ‘ASEAN Flexible Packaging Market Snapshot’. Website.
https://www.transparencymarketresearch.com/asean-flexible-packaging-market.html
22 Smitherspira (2018) ‘Demand for PET Packaging Material to reach $60 billion by 2019’. Website.
https://www.smitherspira.com/news/2014/april/demand-for-pet-packaging-material-in-2019
23 Smitherspira (2018) ‘Demand for PET Packaging Material to reach $60 billion by 2019’. Website.
24 Nikkei Asian Review (2017) ‘Papermakers vie for Southeast Asia corrugated cardboard market’. Website.
https://asia.nikkei.com/Business/Business-Trends/Papermakers-vie-for-Southeast-Asia-corrugated-cardboard-market
25 All4Pack Paris (undated) ‘Packaging: Market and Challenges in 2016’.
https://www.all4pack.com/Packaging/Packaging-news/Packaging-market-challenges-2016
26 Oranrigsupak, Thongchai (2014) ‘Together We “can” – Thailand Metal Packaging Manufacturers Collaboration. Presentation, Asia-Cantech
2014. http://www.asia-can.com/wp-content/uploads/Thongchai-Benjamit-Packaging.pdf
27 All4Pack Paris (undated) ‘Packaging: Market and Challenges in 2016’.
28 All4Pack Paris (undated) ‘Packaging: Market and Challenges in 2016’.
29 Waste from packaging production processes counts as industrial waste instead of MSW.
30 Eurostat (undated) ‘Packaging and packaging waste’. Website.
https://ec.europa.eu/eurostat/web/waste/key-waste-streams/packaging Directive (EU) 2018/852 of the European Parliament and of the Council of 30
May 2018 amending Directive 94/62/EC on packaging and packaging waste. L 150/147
https://eur-lex.europa.eu/legal-content/EN/TXT/?uri=uriserv:OJ.L_.2018.150.01.0141.01.ENG&toc=OJ:L:2018:150:TOC
31 Construction debris is mentioned as Singapore’s definition of municipal solid waste includes construction debris. UNEP (2017) Waste
Management in ASEAN Countries. https://www.unenvironment.org/ietc/report/waste-management-asean-countries-summary-report
32 ASEAN Up (2018) ‘4 ASEAN infographics: population, market, economy’. Website. With GDP data of World Bank for 2016.
https://aseanup.com/asean-infographics-population-market-economy/
33 ASEAN Up (2018) ‘4 ASEAN infographics: population, market, economy’. Website. With population data of World Bank for 2016.
34 (a) Shams, S.; Guo, Z. (2014) ‘Integrated and Sustainable solid waste management for Brunei Darussalam’. Presentation, 5th Brunei International
Conference on Engineering and Technology, Nov 2014. (b) UNEP (2017) Asia Waste Management Outlook.
http://www.rrcap.ait.asia/Publications/Asia%20Waste%20Management%20Outlook.pdf
35 (a) Cambodian Ministry of Environment (2010) ‘Solid Waste Management of Cambodia’. Presentation.
https://www.iges.or.jp/en/archive/wmr/pdf/activity100728/4_Cambodia_Day1_Session2.pdf (b) UNEP (2017) Asia Waste Management Outlook.
36 Kaza, Silpa; Yao, Lisa C.; Bhada-Tata, Perinaz; Van Woerden, Frank (2018) What a Waste 2.0: A Global Snapshot of Solid Waste Management to
2050. Urban Development. P. 40. https://openknowledge.worldbank.org/handle/10986/30317
37 (a) Indonesian Ministry of Environment and Forestry (2016) Sistem Informasi Pengelolaan Sampah Nasional.
http://ditjenppi.menlhk.go.id/reddplus/images/resources/ws_transperancy_framework/r4_02_sampah_klhk.pdf
(b) Damanhuri, I.E (2017). Country Chapter State of the 3Rs in Asia and the Pacific- The Republic of Indonesia. UNCRD 8th regional 3R forum,
9-11 April 2018, India
38 UNEP (2017) Asia Waste Management Outlook.
39 Malaysian National Solid Waste Management Department (2018) ‘Eight Regional 3Rs Forum in Asia and the Pacific: Malaysian Achievements’.
Presentation, 9-12 April 2018, India. http://www.uncrd.or.jp/content/documents/6217Country-G-2-Malaysia.pdf
40 Institute for Global Environmental Strategies (IGES) (2016) Quick Study on Waste Management in Myanmar: Current Situation and Key
Challenges. https://pub.iges.or.jp/pub/quick-study-waste-management-myanmar-current
41 Philippine Senate Economic Planning Office (SEPO) (2017) Philippine Solid Wastes at a Glance.
https://www.senate.gov.ph/publications/SEPO/AAG_Philippine%20Solid%20Wastes_Nov2017.pdf
42 Pollution Control Department (PCD), 2017. Thailand State of Pollution Report 2017. http://www.pcd.go.th/file/AW-Pollution-Report2017.pdf
43 In Viet Nam, Municipal Solid Waste is calculated based on the Urban Domestic Waste (UDW). UDW is 60-70% of the total Municipal Solid
Waste. In 2016, the UDW was 38,000 tonnes/day, which equals to 13.87 million tonnes/year. Now adding the remaining 37.5%, the total MSW
generated in the country in 2015 becomes 19 million tonnes. (a) Ministry of Natural Resources and Environment of Viet Nam (MONRE) (2016)
National State of Environment 2016. Urban Environment. http://opendata.vn/sites/default/files/b010000_2016_bchtmtqg_moi_truong_do_thi.pdf
44 Jambeck, J.R., Geyer, R., Wilcox, C., Siegler, T.R., Perryman, M., Andrady, A., Narayan, R., Law, K.L. et al. (2015) ‘Plastic waste inputs from
land into the ocean’. Science, vol. 347, issue 6223, p. 768-771
45 UNEP, GRID-Arendal (2016) Marine Litter Vital Graphics. https://www.grida.no/publications/60
46 Rochman, Chelsea M.; Tahir, Akbar; Williams, Susan L.; Baxa, Dolores V.; Lam, Rosalyn; Miller, Jeffrey T.; The, Foo-Ching; Werorilangi,
Shinta; The, Swee J. (2015) ‘Anthropogenic debris in seafood: Plastic debris and fibers from textiles in fish and bivalves sold for human consumption’.
Nature, Scientific Reports 5, Article no. 14340 (2015). https://www.nature.com/articles/srep14340
47 Secretariat of the CBD (2016) Marine Debris: Understanding, Preventing and Mitigating the Significant Adverse
Impacts on Marine and Coastal Biodiversity. CBD Technical Series, no. 83. P. 16-18. P. 28. www.cbd.int/doc/publications/cbd-ts-83-en.pdf
48 Ocean Conservancy (2018) International Coastal Clean-up. Building a Clean Swell 2018 Report.
https://oceanconservancy.org/wp-content/uploads/2018/06/FINAL-2018-ICC-REPORT.pdf
50 GIZ (2018) Marine Litter Prevention. https://www.giz.de/de/downloads/giz2018_marine-litter-prevention_web.pdf
51 United Nations General Assembly (2015) 70/1. Transforming our world: the 2030 Agenda for Sustainable Development.
http://www.un.org/ga/search/view_doc.asp?symbol=A/RES/70/1&Lang=E Group of 20 (G20) /2017) G20 Action Plan on Marine Litter. Annex
to G20 Leaders Declaration. https://www.g20germany.de/Content/DE/_Anlagen/G7_G20/2017-g20-marine-litter-en_nn=2186554.html United
Nations Environment Assembly of the United Nations Environment Programme (UNEA) (2017) 3/7. Marine litter and microplastics.
https://papersmart.unon.org/resolution/uploads/k1800210.english.pdf
52 ASEAN Secretariat News, 2018
1153 ZICO (2018) ‘Legal alert: Cambodia, New Sub-Decree on Management of Plastic Bags’. Website.
http://zico.group/blog/legal-alert-cambodia-new-sub-decree-on-management-of-plastic-bags/
54 Kwan, Ling. World of Buzz (2017) ‘Plastic Bags and Polystyrene Containers Banned, Malaysians Urged To Use Eco-Friendly Bags. Website, 3
January 2017. https://www.worldofbuzz.com/plastic-bags-polystyrene-containers-banned-malaysians-urged-use-eco-friendly-bags/
55 Taylor, Michael. Reuters (April 4, 2018)
https://www.reuters.com/article/us-asia-environment-plastic/with-unforgettable-bag-malaysian-shoppers-paid-to-cut-plastic-waste-idUSKCN1HA28K
56 Netherlands Enterprise Agency (2017) Myanmar Waste Scoping Mission Report.
https://www.rvo.nl/sites/default/files/2017/06/myanmar-waste-scoping-mission-report.pdf
57 National Environment Agency of Singapore (2018) ‘Singapore Packaging Agreement’. Website.
https://www.nea.gov.sg/programmes-grants/schemes/singapore-packaging-agreement.
58 See also the OECD definition of EPR „as an environmental policy approach in which a producer’s responsibility for a product is extended to
the post-consumer stage of a product’s life-cycle”. Organisation for Economic Cooperation and Development (OECD) (2016) Extended Producer
Responsibility – Updated guidance for efficient waste management. P. 21.
http://www.oecd.org/environment/waste/extended-producer-responsibility-9789264256385-en.htm
59 Packaging and Recycling Alliance for Indonesia Sustainable Development (PRAISE) (undated) Presentation.
http://apki.net/wp-content/uploads/2017/07/Praise.pdf
60 Manila Bulletin (2017) ‘Environmental coalition PARMS to build a P25- M plastics recycling facility’. Website, 12 December 2017.
https://business.mb.com.ph/2017/12/12/environmental-coalition-parms-to-build-p25-m-plastics-recycling-facility/
61 National Environment Agency of Singapore (2018) ‘Singapore Packaging Agreement’. Website,
https://www.nea.gov.sg/programmes-grants/schemes/singapore-packaging-agreement
This Circular Economy Briefing was prepared as a background document for the Regional Workshop “Managing
P ackaging Waste – Preventing Marine Litter”, taking place from 30th October to 1st November 2018 in Bali, Indonesia.
The workshop is organized by the Association of Southeast Asian Nations (ASEAN), the Indonesian Ministry for Marine
Affairs and Fisheries (MMAF), the German Federal Ministry for Economic Cooperation and Development (BMZ) and the
Royal Norwegian Embassy in Jakarta. The Country Profile was prepared by the Asian Institute of Technology (AIT)
and GIZ’s Advisory project “Concepts for sustainable solid waste management and circular economy”. It is part of a
Circular Economy Briefing Series.
The GIZ Advisory project “Concepts for sustainable waste management and circular economy” develops guidance
p apers, conferences, trainings and policy advice on resource efficient and climate friendly waste management in
cities of low- and middle-income countries. On behalf of the German Federal Ministry for Economic Cooperation and
Development (BMZ), it advises on marine litter prevention, the sustainable management of waste of electrical and
electronic equipment and climate change mitigation in the waste sector through circular economy approaches.
Published by:
Deutsche Gesellschaft für Design/layout etc.:
Internationale Zusammenarbeit (GIZ) GmbH Jeanette Geppert, pixelundpunkt kommunikation, Frankfurt am Main
Registered offices Photo credits/sources:
Bonn and Eschborn Page 1 GIZ/Sandra Fuhr, Viet Nam; Page 6 GIZ/Joachim Stretz
Friedrich-Ebert-Allee 36 + 40 URL links:
53113 Bonn, Germany Responsibility for the content of external websites linked in this p ublication
T 49 228 4460-0 always lies with their respective publishers. GIZ expressly dissociates
F +49 228 4460 – 1766 itself from such content.
E solid-waste-management@giz.de On behalf of
I www.giz.de German Federal Ministry for Economic Cooperation and Development (BMZ)
Division 412 Water, Urban Development, Mobility
Programme: Bonn
Concepts for Sustainable Solid Waste Management and Circular
Economy GIZ is responsible for the content of this publication.
Responsible/contact: Bonn, November 2018
Ellen Gunsilius
E Ellen.Gunsilius@giz.de
Authors:
Regional Resource Center for Asia and the Pacific at the Asian
Institute of Technology (AIT RRC.AP): Guilberto Borongan,
Prakriti Kashyap; GIZ: Pascal Renaud
Editorial team:
GIZ: Ellen Gunsilius, Johannes Paul, Daniel HinchliffeYou can also read