Blue Growth Scenarios and Drivers for Sustainable Growth from the Oceans, Seas and Coasts Maritime Sub-Function Profile Report Cruise tourism (4.3)
←
→
Page content transcription
If your browser does not render page correctly, please read the page content below
Blue Growth
Scenarios and Drivers for Sustainable
Growth from the Oceans, Seas and Coasts

Maritime Sub-Function Profile Report
Cruise tourism (4.3)

Call for tenders No. MARE/2010/01

Client: European Commission, DG MARE

Rotterdam/Brussels, 13th August 2012
The research for this profile report was carried out in the period April – August 2011. This
report has served as an input to the main study findings and these have been validated
by an Expert meeting held on 9/10th November 2011 in Brussels. The current report
serves as a background to the Final Report on Blue Growth.

                  Blue Growth - Scenarios and Drivers for Sustainable Growth from the Oceans and seas   3
Contents
Summary description 7
1 State of Play 9
1.1 Description and value chain 9
1.2 Description of the current structures 9
1.3 Main companies in the cruise industry: 13
1.3.1 Cruise lines 13
1.3.2 Cruise shipyards 15
1.3.3 Cruise ports 17
1.4 Regulatory environment 18
1.5 Strengths and weaknesses of the sub-function 18
2 Research and Technology 21
2.1 Innovation Patterns in the shipbuilding sector 21
2.2 Research & Technology mining patterns 21
2.3 Further market developments 21
3 Future developments 23
3.1 External drivers affecting the performance of the cluster 23
3.1.1 External drivers 23
3.1.2 Key factors 24
3.2 Assessment of response capacity and commercialisation potential 24
3.3 Most likely future developments 25
3.4 Impacts, synergies and tensions 27
4 Role of policy 29
4.1 Policy and political relevance 29
4.2 Domains for EU policy 29
Annex 1: Bibliography 31
Annex 2: Stakeholder catalogue 33
Annex 3 Case studies 35
Cruise industry in Malta 35
Amsterdam Cruise Port 36
Freeport of RIGA 37
Annex 4 Table of cross-links and synergies 39
Blue Growth - Scenarios and Drivers for Sustainable Growth from the Oceans and seas 5Summary description
The worldwide cruise industry shows a strong growth trend in demand. North America is
traditionally the main market for cruises. In the 1970s this market was developed by companies like
Carnival. A major impetus for the growth of the cruise market was the introduction of mega-cruise
ships in the eighties. The new trend of building of mega cruise ships with more than 2000
passengers allowed cruise lines to expand on-board revenues.
Although North American cruise passenger numbers have increased over the years, the region’s
relative share of the world total has declined in favour of expansion of international cruise demand
in Europe. The gap with North America is slowly being narrowed. Although conventional
shipbuilding has been in decline in Europe since the late 70’s Europe has been the world leader in
cruise shipbuilding for 40 years. Cruise operations however are dominated by North American
Companies with Carnival and Royal Caribbean covering 80% of the global cruise market.
Several factors are influencing the development of the cruise industry such as environmental
legislation, changing patterns in tourism demand and (in the longer run) the limited capacity of port
cities. A further growth in demand is widely expected of which Europe will likely take its share.
Indicators for further growth potential are cruise new buildings and investments. Over the period
from 2011 tot 2014 a total of 23 new cruise ships have been scheduled for delivery. According tot
figures of ECC (2011) 9 of these ships are primarily meant for the European source market.
Because of the significant amount of capital needed for building a new cruise ship and the
complexities surrounding their operation, an important company like Carnival expects long-term
cruise industry supply growth to slow, while demand accelerates as global economies recover and
emerging markets develop (Carnival Corporation & PLC, 2011).
Blue Growth - Scenarios and Drivers for Sustainable Growth from the Oceans and seas 71 State of Play
1.1 Description and value chain
The sub-function of Cruise including port cities is defined as all activities associated to cruise
holidays, including the ships used and the facilitations at destination ports. Cruise tourism is a form
of tourism where people travel (cruise) on a ship. This can be to a sunny destination such as the
Mediterranean or the Caribbean, but also to Norway, Alaska or Antarctica. It is a relatively luxurious
form of travel. Worldwide, as well as in Europe, in the last decade the cruise market has seen a
rapid growth. The European shipbuilding industry is dominant in the construction of these types of
ships.
For the value chain of cruise tourism it is necessary to make a distinction between the demand side
and the suppliers of products and services necessary for cruise tourism. This supply side of the
cruise tourism consists of:
• Shipbuilding and marine equipment
• Operation of ships
• Port services and logistics – operating cruise terminals, port management
• Other maritime services (bunkering, ship repair, pilotage, etc.)
• Maritime works – constructing ports, maintaining access channels
1.2 Description of the current structures
Economic performance
The cruise sector is a relatively small but fast growing sector of the tourism industry. Tourism as an
industry has been growing since the middle of the twentieth century. The market for cruise ships is
strongly driven by tourism market trends. Raising welfare levels have contributed to substantial
growth in number of cruise tourists over the past decade. A major impetus for the growth of the
cruise market was the introduction of mega-cruise ships in the nineteen eighties. The new trend of
building mega cruise ships with more than 2,000 passengers allowed cruise lines to expand on-
board revenues, introducing a whole new series of on-board activities. Examples include
Casino & games, entertainment, wide range of restaurants (from moderate to exclusive), gift shops,
spa services, etc.
The cruise industry in Europe generates currently direct turnover of € 15 billion and 150,000 direct
jobs. 1 These were derived from four major sources:
• The construction of new cruise ships and maintenance (€ 3.8 billion),
• Cruise lines purchases in support of their cruise operations (€ 6.4 billion)
• Spending of cruise passengers and crew in destination ports/regions (€ 3.4 billion)
• Expenditures on wages and salaries (€ 1.3 billion)
Total industry output (including indirect and induced impacts) rises to € 36.7 billion and 315,500
jobs.
Over the past 10 years, the demand for cruising worldwide roughly doubled. The number of
passengers embarking in Europe has increased to 5.2 million passengers in 2010. Of these over 4
million were European nationals and about 1.2 million came from outside Europe. Given the growth
1
(European Cruise Council (2012), Page 6
Blue Growth - Scenarios and Drivers for Sustainable Growth from the Oceans and seas 9in number of passengers, direct expenditures have steadily increased on a year-over-year basis.
These expenditures are visible through the turnover of the various cruise operators.
Since 2006 the direct expenditures of the cruise industry grew from € 10.6 billion in 2006 to € 15
billion in 2011 (European Cruise Council (2011), which equals a compound annual growth rate of
8.3%. Over this period only the recession year of 2009 saw a slight decline in expenditures.
Figure 1.1 Direct Cruise Industry Expenditures in Europe (2005-2010) in € bn
Direct Cruise Expenditure per year in €bn
16.00 15.00
14.20 14.50
14.10
14.00 12.90
12.00 10.60
10.00
€ bn
8.00
6.00
4.00
2.00
0.00
2006 2007 2008 2009 2010 2011
Year
Source: European Cruise Council (2012) Page 9
Direct Cruise Expenditure in 2011 in €bn, % of total
Value of
Shipbuilding,
3.84 , 26% Cruise Line
Purchases, 6.36
, 42%
Passenger &
Cruise
Crew
Employees
Purchases, 3.44
Compensation,
, 23%
1.32 , 9%
Source: European Cruise Council (2012) Page 10
The industry has proved resilient in the face of economic uncertainty, with European cruising
playing an important role in delivering growth in Europe. In 2011 some 6 million Europeans booked
a cruise, an increase of 9% on 2010 and a more than doubling over the past decade. Some 5.6
10 Scenarios and Drivers for Sustainable Growth from the Oceans and seasmillion passengers embarked on their cruise from a European port last year. 2 Each of these
passengers spent an average of almost €100 when visiting a port, with a total of some 25mn
passenger port visits in Europe per year, representing 2.5 billion euros in spending.
The Costa Concordia accident early 2012 has affected the growth of the sector: numbers of
bookings went down and large cruise liners had to revise financial projections for 2012. 3 4 This may
however remain to be a short term decline.
European cruise industry in a global perspective
North America is traditionally the main source market for cruises. In the 1970s this market was
developed by companies like Carnival. Even today, North America is the world's main source
market for cruise tourists. Of all cruise passengers in 2011 (20.6 million world wide) about 55%
originates form this continent. The European market share amounts to 30% in 2010. The remainder
(15%) is generated by other markets in the rest of the world. Although North American cruise
passenger numbers have increased over the years, the region’s relative share of the world total has
declined in favour of expansion of international cruise demand in Europe.
Table 1.1 International demand for cruises in 2000 -2011 (market share by region and annual number of
passengers)
2000 2005 2006 2007 2008 2009 2010 2011
North America 71% 70% 69% 66% 64% 59% 59% 55%
Europe 21% 22% 23% 26% 28% 28% 29% 30%
Rest of the world 8% 8% 9% 9% 9% 12% 12% 14%
Total (%) 100% 100% 100% 100% 100% 100% 100% 100%
Number of passengers (million) 9,7 14,3 15,1 15,9 16,2 17,6 18,8 20,6
Source: European Cruise Council (2012) Page 12, slightly modified by Ecorys
In the United States, penetration rate (share of population that makes a cruise) is approximately
3.5%. This high percentage has, among other things to do with the early development of the cruise
industry in this part of the world. Infrastructure around the sector is therefore much better developed
Cruising in Europe is much newer and a percentage of 3.5% is not in all submarkets achieved. In
significant markets like France or Germany this percentage is less than 1%.
Europe has been world leader in the cruise building industry for 40 years. All the ocean going cruise
ships currently under construction are built at European yards.
In 2011, over 6m European tourists booked a cruise, of which 5.6 mln also embarked in a European
port. 5 Total European embarkations were 5.2 mln, thus receiving 1.0 mln passengers from non-
European origin. Easy and affordable air access to embarkation ports is of key importance to the
choice of these ports and the possibilities to grow.
In terms of cruise operations, European companies operated 120 cruise ships in 2011 with a
capacity of around 143,000 lower berths owned by 41 companies. In addition there were 25 lines
from outside Europe (predominately North American) participating in the European cruise market.
2
European Cruise Council (2012), The Cruise Industry – Contribution of Cruise Tourism to the Economies of Europe 2012
Edition. Page 10
3
Lloyd's List 9/3/12 The Costa Concordia disaster has hit Carnival’s first-quarter results. AP
4
Lloyd's List 2/2/12 New 2012 bookings are significantly down in Europe, RCCL says.
5
European Cruise Council (2012), The Cruise Industry – Contribution of Cruise Tourism to the Economies of Europe 2012
Edition. Page 9
Blue Growth - Scenarios and Drivers for Sustainable Growth from the Oceans and seas 11These lines domiciled outside Europe deployed 66 cruise ships with a total capacity of 97,000 lower
berths in the region (Source ECC 2011).
European cruise industry by county
Within Europe, the cruise market is largely concentrated in a few countries in terms of tourist
activity. The most important country in the cruise market is Italy which generated nearly 1.9 million
passenger embarkations in 2011. Most important cruise ports in Italy are Venice, Savona, Genoa
and Civitavecchia (Rome). Spain was in second position with over 1.3 million passenger
embarkations followed by the UK (878,000) and Germany (375,000). The four countries together
accounted for nearly 80% of all European embarkations. In terms of tourist origin however UK and
Germany are leading, with 1.7 mln and 1.38 mln passengers originating from these countries. 6
When looking at ports of call, Italy, Spain and Greece are the three most important destination
countries.
In terms of economic importance, not only origin and destination of tourists is relevant, but also
locations of service providers, yards and operating companies as well as origin of crew. In this
respect, Italy is most important in terms of direct expenditure, followed by the UK and Germany.
Figure 1.2a Cruise Passengers by Country of Embarkation
Cruise Passengers by country of embarkation, 2011
Other EU + 3 32
Finland 20
Sweden 40
Portugal 43
Country of embarkation
Cyprus 44
Malta 56
Netherlands 99
France 122
Denmark 220
Greece 313
Germany 375
UK 878
Spain 1,384
Italy 1,861
0 500 1,000 1,500 2,000
Passengers in thousand
Source: European Cruise Council (2012)
6
European Cruise Council (2012), The Cruise Industry – Contribution of Cruise Tourism to the Economies of Europe 2012
Edition. Page 16
12 Scenarios and Drivers for Sustainable Growth from the Oceans and seasDirect Cruise Industry Expenditures by Country (2011)
Rest of the EU + 3 160
Cyprus 56
Gibraltar 56
Malta 79
Portugal 195
Denmark 198
Sweden 203
in €m
Finland 232
Netherlands 347
Greece 605
France 1,224
Spain 1,298
Germany 2,524
UK 2,830
Italy 4,450
0 500 1,000 1,500 2,000 2,500 3,000 3,500 4,000 4,500 5,000
per country
Source: European Cruise Council (2012)
In total 28.1 mln passenger visits from cruise vessel port calls were realised in Europe in 2011.
Cruise lines visited about 250 port cities in Europe. The two main cruise areas Mediterranean and
Baltic have market shares of roughly one third and two thirds of this.
1.3 Main companies in the cruise industry:
1.3.1 Cruise lines
Characteristic of both North America and Europe and the rest of the world is the market dominance
of a limited number of cruise lines. Market leader in North America and in Europe and the rest of
the world dominate a limited number of cruise lines. The cruise market is dominated by a handful of
operators such as Carnival, Royal Caribbean and MSC. Overall market leader is Carnival who has
a fleet of 100 cruise ships with a total passenger capacity of 192,000 passenger berths by the end
of 2010 (see figure and box below ). Number two in the market is Royal Caribbean International.
The cruise ship”Oasis of the Seas” belongs to the fleet of Royal Caribbean and set in 2009 a new
record of carrying over 6,000 passengers.
Blue Growth - Scenarios and Drivers for Sustainable Growth from the Oceans and seas 13Figure 1.3 Global cruise liners and market share (based on turnover)
100%
80%
Other
Louis
60%
Disney
NCL
MSC
40%
Royal Carribean
Carnival
20%
0%
North American cruise market Europe and rest of the world cruise
share market share
Source: http://www.cruisemarketwatch.com
Despite the strong concentration in a few (very large) cruise companies, the market is more
differentiated because the large cruise companies operate on the market through various cruise
brands. The table below shows the different brands of Carnival (worldwide the largest cruise
company) and the market in which these brands are mainly active. Carnival’s Costa Cruises is the
leading cruise brand in Europe with a fleet of 14 cruise ships (all flying the Italian flag) and a
passenger capacity of approximately 29,200 passengers.
Table 1.2 Brands owned by Carnival Corporation & PLC
Cruise brands Passenger Number of Primary market s
capacity cruise
ships
North America 117,104 59
Carnival Cruise Lines 54,480 22 North America
Princess Cruises 37,608 17 North America
Holland America Line 23,492 15 North America
Seabourn 1,524 5 North America
Europe, Australia 74,360 39
& Asia
Costa Cruises 29,202 14 Italy, France and Germany
P&O Cruises (UK) 15,098 7 United Kingdom
Aida Cruises 12,054 7 Germany
Cunard 6,676 3 UK and North America
P&O Cruises (Australia) 6,322 4 Australia
Ibero Cruises 5,008 4 Spain and South America
Total 191,464 98
Source: Carnival Corporation & PLC, 2010 Annual Report
14 Scenarios and Drivers for Sustainable Growth from the Oceans and seasCarnival Corporation: largest cruise company in the World
The company began operation in 1972 with a converted ocean liner. Since then Carnival Corporation has
grown exponentially and has become the largest cruise company in the World of today. The portfolio of
cruise brands of the company are comprised of Carnival Cruise Lines, Holland America Line, Princess
Cruises, Aida Cruises, Costa Cruises, Cunard, Ibero Cruises, P&O Cruises (UK, Australia). The company
has a total fleet of 100 cruise ships with a total passenger capacity of 192.000 passengers by the end of
2010. The cruise ships of Carnival Corporation transported in 2010 approximately 9.2 million passengers,
while revenues reach 14,5 billion dollar in 2010. In 2010, the company employs about 90.000 employees.
To the fleet of Carnival Corporation belongs the Queen Mary 2 which at the time of construction (2003) was
the largest passenger ship ever built with a gross tonnage (GT) of 150.000 tons and a guest capacity of
2,620 passengers. At this time the Queen Mary 2 no longer holds this distinction after the construction of
Oasis of the Seas in October 2009. This cruise ship belongs to the fleet of Royal Caribbean International
(number two in the market) and set now a new record of carrying over 6,000 passengers.
Source: Carnival Corporation & PLC, 2010 Annual Report and http://www.royalcaribbean.com
In the short run, the cruise industry is expected to grow steadily because of the ageing of people
and cruises becoming more affordable. In the long run however, the market is expected to stabilize
or even to decline. According to our interviewees, Asia, being an engine for economic growth in
other (maritime) economic sectors is currently considered to offer a limited potential growth market,
due to the limited.
In general, the operators often purchase the ships new and commission refurbishments in a cycle
of 6-8 years. When ships are getting technologically outdated and newer models are launched, the
older ones are usually transferred to lower cost segments of the market.
1.3.2 Cruise shipyards 7
At the production side there is also a handful of yards able to build these high value ships (€ 300-
700 mln is common), including Fincantieri (Italy), Meyer Werft (Germany) and STX Europe (Korean
ownership, passenger shipyards in Finland and France). In the field of passenger ferries these
companies are also important players, while for smaller sized ferries also companies like Damen
(the Netherlands) are important contributors.
Generally speaking, the main European cruise yards have a capacity of typically 3 ships per year.
However, some of the cruise liners have indicated that they will halve their usual yearly orders, as
fleets have been strongly modernised over the past decade and no major growth is foreseen in the
cruise demand. The effects are shown in figure 1.4 where the cruise ships deliveries and
orderbooks for the main players are depicted.
7
Information partly based on ongoing research by Ecorys on “Green growth opportunities for the European shipbuilding
industry”, requested by EC DG Enterprise (2011).
Blue Growth - Scenarios and Drivers for Sustainable Growth from the Oceans and seas 15Figure 1.4 Cruise Ship Deliveries and Orderbook by Shipyard
Source: Meyer Werft. In: CESA shipbuilding market monitoring no 20
Europe has been world leader in the cruise building industry for nearly 40 years with close to 100%
market share. The abundance of specialist skills and sophisticated technology in areas such as
navigation and outfitting are part of their strength 8 . Although other yards may have the capacity and
technology to build cruise ships, many believe they do not have the project management ability,
aptitude or the desired balance of labour and skills required to deliver a cost effective result within a
required budget in the contracted delivery time. 9
Recently however, the Japanese yard Mitsubishi has signed a contract with cruise operator
Carnival Corporation (US) for manufacturing two new cruise vessels for AIDA (daughter company
of Carnival). The vessels ordered will be the largest cruise ships ever built, due to their lower berth
capacity for 3,250 passengers, to serve the expanding German cruise market. 10 Their delivery is
expected in 2015 and 2016. 11 The practice of ADIA to not consider EU manufacturers has raised
criticism from the European industry, notably Fincantieri and STX Finland, both only now managing
to receive substantial new orders. It is stated, that the cost per berth of the Japanese offer are too
low to remain competitive. The recent announcement by Samsung Heavy Industries in Korea to
12
construct a cruise ship in Korea is another step to introduce competition from outside Europe.
8
Source: Contributions of cruise tourism to the Economics of Europe 2010
9
European Cruise Council (2010). The cruise industry: a €34 Billion Partner in Europe’s Economic Growth
10
http://www.latecruisenews.com/2011/10/03/new-aida-cruise-ship-order-goes-to-japan-%E2%80%93-other-cruise-news-paul-
gaugin-cruises-expands-%E2%80%93-st-kitts-sees-cruise-boom-%E2%80%93-cruise-surveys/
11
http://www.cruiseindustrynews.com/cruise-news/5946-mitsubishi-to-build-two-125000-ton-aida-ships.html.
12
Source: Ecorys (2012), Green growth opportunities in the EU shipbuilding sector
16 Scenarios and Drivers for Sustainable Growth from the Oceans and seasMeyer Werft
The Meyer Werft company in Papenburg (Germany) is a family owned business aged more than 200 years.
While the other major players STX (Finland/France) and Fincantieri (Italy) are also active in other fields
(offshore, naval), Meyer Werft is relatively strongly focused, and therefore depending, on the building of
cruise ships. Although cruise ships are complex products, the competitive position is mainly defined by the
production process, in which efficient organisation, timely delivery of goods and services and low failure
rates are key to deliver successfully and cost-efficient. This is seen as a main reason why other yards have
not been able to enter this market yet. Furthermore dependency on suppliers is ensured by working
frequently with local/regional companies and by spreading the supplier risk.
R&D largely takes place in house, partly because of the risk of knowledge leakage. The company however
does actively involve in EU funded R&D projects (FP6/7) for areas where investment costs are high or when
it concerns general technologies also relevant for other ship types.
Source: qualitative interview conducted in 2011
1.3.3 Cruise ports
Important links in the value chain of the cruise industry are the cruise ports. Many of these ports are
regarded as “must see” destinations. Examples are Barcelona or Venice in the Mediterranean or
Stockholm in Northern Europe. Other ports are important because of their strategic location and
perform a particular function as departure and arrival port. An overview of the leading ports in the
Mediterranean and Northern Europe is included in the table below in respect of the embarkations,
disembarkations and port-of call visits.
Table 1.3 Leading cruise ports in 2011 (x 1.000 passengers)
Port Port Embarking Disembarking Port Call Total
Mediterranean Barcelona 750 780 1,158 2,657
Citavecchia 460 460 1,480 2,400
Venice 722 726 338 1,786
Palma Majorca 294 294 841 1,429
Piraeus 280 280 1,000 1,560
Northern Europe Southampton 717 717 11 1,445
Copenhagen 220 219 380 819
Lisbon 25 25 453 503
St. Petersburg 0 0 455 455
Stockholm 40 40 372 452
Source: European Cruise Council (2012)
Ports and port facilities tend to adopt different strategies tot finance and manage port facilities. For
example in the Mediterranean and in Northern Europe of the 60 main ports or terminals, 40 are
state managed, 4 are directly operated by cruise lines (Savona, Barcelona, Civitavecchia and
Naples)and 3 are partially operated by cruise lines (Genova, Kusadasi and Tunis). The other 13
are operated through private company concessionaires (Gui, L. & A.P. Rosso, 2011).
Generally, volumes of cruise calls/passenger visits are concentrated in attractive cities with cultural
heritage, as the above table indicates. Climate conditions also play a role, with higher numbers in
the Mediterranean than in the northern European waters. Besides these, a specific segment
concerns the cruise trips focused on natural scenery. Examples are cruises along the Norwegian
fjords, the Arctic, Scotland and Iceland. These seawaters are usually characterised by a sparsely
populated and rough countryside. Alongside with its often abundant opportunities to spot wildlife
Blue Growth - Scenarios and Drivers for Sustainable Growth from the Oceans and seas 17(e.g. whales, polar bears), the latter provide a good niche market comprised cruise operators at the
higher end of price. This underlines that, among other aspects, it’s also the eco-systems in place
which are creating market value for the cruise industry.
1.4 Regulatory environment
For maritime shipping, including cruise shipping, international regulations are to be followed, as
defined by IMO. The main task of IMO has been to develop and maintain a comprehensive
regulatory framework for shipping including safety, environmental concerns like Nox emissions,
legal matters, technical co-operation, maritime security and the efficiency of shipping. The two key
regulatory frameworks are MARPOL and SOLAS. Of specific relevance is MARPOL Annex VI
setting limits to emissions. This annex allows for Emission Control Areas to set stricter rules. In
Europe the Baltic Sea Area and the North Sea were adopted as SOx Emission Control Area
(SECA) in July 2005. Cruise ships operating in these basins thus have to meet stricter
requirements. In the near future other ECA areas are also foreseen. In March 2010, specific
portions of the U.S., Canadian and French waters (outer boundary of 200 nautical miles from the
territorial sea baseline) were designated as an ECA with respect to both SOx and NOx emissions.
Furthermore Port State Control regulations apply, requiring ships to meet international safety,
security and environmental standards and involving inspections in ports of call. The rules are
approved through the Paris MoU on Port State Control.
In addition to these, the most relevant European regulations regarding cruise shipping are listed
below:
• EC Directive 2000/59 on port reception facilities, with the aim of substantially reducing
discharges of ship-generated waste and cargo residues into the sea.
• The Council Directive 90/314/EEC on package travel, package holidays and package tours,
designed to protect consumers who contract package travel in the EU.
• New EU legislation that came into effect on 1 January 2010 pertains to the EU Sulphur
Directive 2005/33/EC, which defines limits on the sulphur content of marine fuels.
• Regulation (EC) No 725/2004 on enhancing ship and port facility security and Directive
2005/65/EC which complements the security measures introduced by Regulation (EC) No
725/2004.
Events such as the Costa Concordia accident may trigger reconsideration of safety regulations and
contribute to technology development and setting new standards with regard to e.g. vessel stability.
1.5 Strengths and weaknesses of the sub-function
Strengths in a global perspective
• Strong domestic market. Broad mix of visitor profiles and relatively high spending power potential
in Europe.
• Europe is widely acknowledged as a safe and stable tourist destination
• Presence of excellent cruise port facilities in combination with high developed infrastructure
• Diversity of destinations with a dense supply of cultural and historical heritage
• Leading shipyards located in Europe.
18 Scenarios and Drivers for Sustainable Growth from the Oceans and seasWeaknesses in a global perspective
• Leading cruise operators are non-European, although some daughter companies are EU based.
• Building a new cruise ship requires a considerable amount of capital especially when cruise ships
become bigger and more and more luxurious. Therefore the risk increases and it becomes harder
to attract foreign capital.
• Because of their scale and scope, cruise ships are a burden on the environment. From this
perspective, it is important to invest in image and public opinion. Cruise lines are also very well
aware of this.
• The costs of port infrastructure are high and port authorities cannot always recover these costs
from the cruise lines because of market power of the cruise companies. The realization of the
necessary port facilities, like port entry features, customs and immigration handling, anchorage
facilities, etc., therefore often requires a contribution from the (local or regional) government
needed to port facilities to achieve.
• Access to labour: in the mechanical industry, including shipbuilding, a lack of skilled workers is
faced, and this problem is expected to increase.
• The high visibility causes negative events to have a wide impact, as can be seen from the
massive news attention for the Costa Concordia accident and the sharp decline of new cruise
bookings.
Constraints
• Depth of the waters in ports of call set limits to the size of ships. Currently, for the world's largest
cruise ships it is no longer possible to moor in all ports.
• Inland congestion in destination port sites. Usually a cruise ship visits a particular port only for a
limited period of time and the massive inflow of visitors is providing congestion in destinations
and town centres. Small old towns and heritage sites cannot simply be expanded to overcome
this.
Blue Growth - Scenarios and Drivers for Sustainable Growth from the Oceans and seas 192 Research and Technology
2.1 Innovation Patterns in the shipbuilding sector
For the shipbuilding sector (cruise ships, mega-yachts), knowledge, R&D and innovation are of
strategic importance for its competitive position. The only way to remain competitive is to
continuously innovate and rapidly, so as to stay ahead of the game. Overall, R&D expenditures
rose over recent years, reflecting the importance of innovation for the sector.
New green, environment-friendly shipboard technologies are being utilized, such as solar power,
advanced water treatment systems, Alternative Maritime Power (AMP), fuel conservation and
innovative hull treatment. On a worldwide level, regulations (e.g. on the use low-sulphur diesel
fuels) are developed by the International Maritime Organisation (IMO).
In the shipbuilding domain, innovations target:
y Increased cost effectiveness, aiming either at lower construction costs or lower life cycle costs.
Especially the latter is an upcoming trend, with a search for energy savings in the operational
lifetime of a ship, at the expense of slightly higher investment costs. Some cruise operators
look into this option, but not all, as their risk mainly lies with fluctuating energy prices not
knowing the earn back time. An example is the improvement of air conditioning systems,
requiring up to 30% of the fuel consumption when sailing in tropical areas.
y Environmental improvements, first of all to meet stricter regulations in ECA regions as well as
for the sake of image. It concerns for instance waste water and exhaust gas treatment
equipment. European manufacturers are considered well positioned in these segments,
although Asian competitors also enter these areas.
2.2 Research & Technology mining patterns
No Research & Technology mining patterns have been identified for this subfunction.
However, a number of observations regarding R&D could be made:
y A number of R&D projects, of which some funded under EU R&D programs (FP6, FP7) cover
technologies also relevant for cruise ships. Examples are BESST, GasPax, BunGas and
FLAGSHIP. Although they do not specifically target the cruise market, European cruise yards
do actively participate in several of these projects. Other projects relate to safety and stability,
such as for instance the GOALDS project (GOAL Based Damage Stability).
y In the field of shipbuilding, patenting is generally not seen as very effective, as enforcement is
weak. Strategies mainly aim at staying ahead of others by continuing innovation and by
minimising the knowledge leakage risk.
2.3 Further market developments
In the area of cruise port development, several initiatives are taken, of which the Interreg IVB
project Cruise gateway is an example. A number of North Sea cruise ports have joined forces
aiming at increasing their maritime accessibility and developing the North Sea as a cruise
destination.
Blue Growth - Scenarios and Drivers for Sustainable Growth from the Oceans and seas 21Over the years cruise ships have become larger and larger and add more and more amenities.
Vacation on a cruise ship was therefore accessible to more and more holidaymakers. This enabled
the cruise market to grow explosively. Within the cruise industry a relatively new development
however is the divergence between further scaling versus those catering to customers who want a
more intimate experience. Seabourn Cruise Line for example operate small luxury cruise ships that
sail tot exotic locations in Asia and South America while other cruise lines are specialized in
Antarctica cruises as well as cruises to the Arctic.
22 Scenarios and Drivers for Sustainable Growth from the Oceans and seas3 Future developments
3.1 External drivers affecting the performance of the cluster
3.1.1 External drivers
Welfare development
Like other segments of the tourism industry, the cruise industry is to an important extent, influenced
by the welfare development. The level of global economic growth highly correlates with the level of
tourist activity and the level of turnover and employment in the tourism industry.
The industry is also sensitive to the global economic crisis, as shown by the reduced expenditures
in 2009. In 2010 however it continued to show steady growth. Rise of average incomes will further
enlarge the market.
Demographic change: ageing population reshaping the internal demand
In 2020 around 20% of the EU’s population will be older than 65 (EC, 2008). The older population
will often have considerable purchasing power and have more free time in which they can travel, as
well as a demand for convenience, safety and luxury. This general trend has a positive impact on
the cruise industry.
Changing consumer preferences in tourism
Generally speaking, consumers have developed their preferences, and this also affects the cruise
tourism segment. One must realise that cruise tourism competes with other forms of tourism, e.g.
all inclusive resorts, fly-drives, city trips. The coming up of low cost airlines have added to this. Also
the Internet has lowered the threshold for self organisation of holiday trips reducing the demand for
package deals such as offered by cruise lines.
On the other hand with the rise of this so-called experience economy, the demand for a ‘total
experience’ will increase, and cruise can offer this as a special holiday type compared to ‘just’
visiting a site. Think in this case, for example, to the emergence of a variety of specific cruises.
Cruise passengers are increasingly experienced. They seek new experiences leading to the
emergence of new destinations, among which is the EU. Meanwhile, for almost every target group
currently a separate cruise is offered. Examples of special theme cruises include ecotourism, golf,
deep sea fishing or wellness.
Environmental awareness
Environmental policies and consumer concerns about sustainable development increases causing
pressure for greening ships (e.g. use of solar panels, wind turbines) and for more sustainable
tourist services (e.g. eco-excursions). To respond to this development, cruise lines are taking
various environmental measures to reduce emissions and lowering fuel costs. Most cruise lines
have on-board recycling programs and are increasingly using LED lighting, solar panels and high
efficiency appliances. Many cruise companies also have an environmental officer on board of the
cruise ships to monitor compliance. Still however the sector has a way to go with today’s average
cruise holiday emitting around 4.5 times as much CO2 per day as an average hotel holiday 13 .
13
Traveling large in 2010 – The carbon footprint of Dutch holiday makers in 2010 and the development since 2002, Centre for
Sustainable Tourism and Transport, NHTV Breda University of Applied Sciences, 2012
Blue Growth - Scenarios and Drivers for Sustainable Growth from the Oceans and seas 23Fuel prices
In addition to capital expenses and maintenance of the cruise ships spending to fuel is also a major
cost item. The increasing oil prices and the energy consumption of the ships is a driver for some of
the cruise liners to implement more fuel efficient technologies, as the fuel bill is the biggest part of
their operations. This is however not easy from a design perspective. Another strategy to save fuel
is limiting the distances between ports during a voyage. This allows the cruising speed be reduced
which can affect the fuel consumption. Cruise travel destinations with a peripheral location, such as
Helsinki, are influenced by this strategy. Also it may affect the development of services in central
regions, e.g. close to population concentration, thereby saving on the need of air travel to
embarkation ports.
Safety and security
The Costa Concordia accident triggers the search for improved safety and stability design which will
probably lead to revision of regulations in this regard. The process of such will over time change
designs and may affect costs of ships. Global attention for security and the potential vulnerability of
cruise ships as high value high exposure targets has already led to studies into their risk potential
and possible measures to alleviate this.
3.1.2 Key factors
Increased competition: cruise market more and more mature
Although the cruise industry shows steady growth figures over the past decade, the cruise market is
increasingly becoming a mature market. As markets mature, customers can be more demanding
and competition become more intense. Price competition drives ship size growth: The principle is
that if the vessel size is increased, operational costs increase at a significantly lower rate than the
carrying capacity, resulting in higher net revenue per unit. However, in addition to scaling there is
also a reverse reaction towards niche markets and exceptional destinations such as the Arctic or a
cruise to the Galapagos Islands.
Cruise companies are increasingly segmenting the market. There is a vast trend towards more
family booking. With the number of on-board leisure facilities increasing there is potential for further
growth of the family market for cruising (ECC, 2011). Associated to this is the operators’ aim for
increased on-board spending instead of disembarking in destination ports.
Impact of financial crisis
For the cruise industry and shipyards the financing of ships is a big challenge at the moment. For
example shipyard Meyer Werft advance payments received usually are 20-30% and banks are
willing to fund max approx. 60%. The remainder has to come from own cash flow of the yard. In
Germany, for instance, only one bank (KfW) is providing financing for this, albeit to a limited extend
due to strict funding requirements (exporting conditionality). With the financial crisis and stricter
rules (Basel III) this has become more difficult (higher own capital is demanded). This is the same
in other EU countries, although in France and Italy the state already invested and in Italy the state
owns Fincantieri shares. At the time that the financial markets have recovered, funding will likely
again is a little easier. The time of recovery, however, is difficult to predict.
3.2 Assessment of response capacity and commercialisation potential
The cruise industry has responded to the above drivers in various ways:
y Cruise companies are increasingly segmenting the market. There is a vast trend towards more
family booking. With the number of on-board leisure facilities increasing there is potential for
growing the family market for cruising further (ECC, 2011). Vessels have also been adapted to
meet requirements these requirements.
24 Scenarios and Drivers for Sustainable Growth from the Oceans and seasy Reduction in fleet expansion: the number of new orders has declined slowing down the growth
of the fleet, with current fleets sufficiently modern not to require replacement newbuilding on
the short term.
y Shipyards have invested heavily in R&D for modernisation, and intend to continue doing so.
One aim is to bring overall cost price down by increased construction efficiency, while another
is to improve life cycle costs of these ships. The high fuel bill and the large cost level of
facilities (heating/cooling, fresh water supply) are main contributors to this.
y Port authorities as well as (regional/local) governments across Europe are increasingly
investigating their options for entering the cruise market, e.g. by constructing facilities or
redesigning parts of their port.
y In the service part of the cruise segment, jobs are partly low skill/low wage and staff is being
recruited from low wage countries (including non-EU). This personnel is paid very low wages
and there is a risk of exploitation of the generally weak position of these workers 14 . In high skill
segments (shipbuilding / engineering), the industry tries to solve the gap through cooperation
with universities
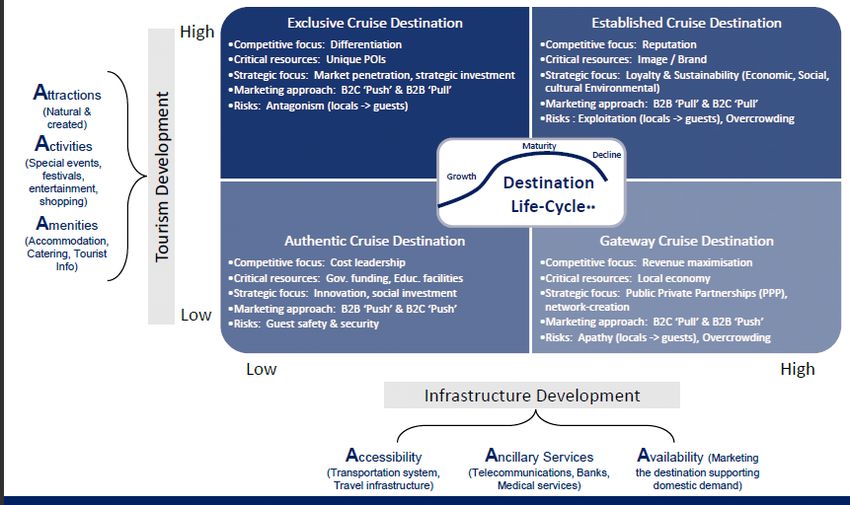
Papathanassis (2011) has defined four market segments of cruise based of the axes of tourism
development and infrastructure development (see figure below).
Figure 3.1 Cruise destination positioning and development strategies
Source: Papathanassis (2011).
3.3 Most likely future developments
The number of global cruise passengers continues to rise steadily, despite the Costa Concordia
accident. This accident has influenced 2012 bookings, however Carnival Corp. (the owner of Costa
Cruises) does not expect any significant long term impact to their business 15 .Based on figures from
CLIA (2010) the average growth rate in the number of passengers worldwide between 1990 and
2009 was annually 7.2%. At present the total employment In Europe has increased from nearly
200,000 jobs in 2005 to more than 300,000 jobs in 2010 (European Cruise Council 2011). Although
the cruise industry like other sectors suffers from the economic crisis, growth expectations for the
14
P&O cruise ship staff paid basic salary of 75p an hour – The Guardian, 29 April 2012
15
New 2012 bookings are significantly down in Europe, RCCL says- - Lloyd’s List 2 February 2012
Blue Growth - Scenarios and Drivers for Sustainable Growth from the Oceans and seas 25next few to ten years are favourable, mainly due to welfare growth of European citizens, and
because of an increased penetration rate. The growth in other world regions (Caribbean) will also
benefit the European shipbuilding and supply industry.
Europe as cruise destination will continuously increase its attractiveness (e.g.. through improved
berthing situations in attractive destination ports).The growing market in Europe provides
opportunities for extending the cruise season (e.g. Mediterranean).
High fuel prices may also contribute to a growth of the industry, especially in regions where
destination ports are located close to each other (North Sea, Baltic). 16
Indicators for further growth potential are cruise new buildings and investments. Over the period
from 2012 to 2016 a total of 24 new cruise ships (with a total capacity of roughly 67,000
passengers) have been scheduled for delivery. According to figures of ECC (2012) 13 of these
ships are primarily meant for the European source market. For the longer term, such information is
(until yet) not available. Because of the significant amount of capital for building a new cruise ship
and the complexities surrounding their operation an important company like Carnival expects long-
term cruise industry supply growth to slow, while demand accelerates as global economies recover
and emerging markets develop (Carnival Corporation & PLC, 2011).
The Costa Concordia accident is likely to result in a greater attention to safety, both from cruise line
operators as from authorities. Such attention existed before the accident; see the box on the FP7
GOALDS project; however the Costa Concordia accident will certainly renew the attention to safety.
This may affect a number of fields, such as design of cruise ships in order to improve stability
and/or to prevent power blackouts during incidents (as happened on the Costa Concordia),
regulations for lifeboat provision and, safety training. This increased attention to safety may
increase the costs of cruise line operators as the necessary measures may require investments.
GOALDS
GOAL Based Damage Stability
2009-2012
Funding programme: FP7 - Transport
Project Duration: 36 months
Total Project Value: EUR 4 644 685
EU Grant-Aid: EUR 2 951 883
Website:
http://cordis.europa.eu/projects/index.cfm?fuseaction=app.details&TXT=cruise&FRM=1&STP=10&SIC=&PG
A=FP7-TRANSPORT&CCY=&PCY=&SRC=&LNG=en&REF=93147
Coordinator: NATIONAL TECHNICAL UNIVERSITY OF ATHENS (Greece)
Partners: STX FRANCE CRUISE SA (FRANCE); CARNIVAL PLC (UNITED KINGDOM);
SØFARTSSTYRELSEN (DANMARK); GERMANISCHER LLOYD AG (DEUTSCHLAND); SAFETY AT SEA
LIMITED (UNITED KINGDOM); SCHIFFBAUTECHNISCHE VERSUCHSANSTALT IN WIEN GMBH
(ÖSTERREICH); MEYER WERFT GMBH (DEUTSCHLAND); UNIVERSITA DEGLI STUDI DI TRIESTE
16
www.cruisegateway.eu
26 Scenarios and Drivers for Sustainable Growth from the Oceans and seas(ITALIA); LLOYD'S REGISTER EMEA (UNITED KINGDOM); STX FINLAND CRUISE OY (SUOMI/FINLAND);
FINCANTIERI - CANTIERI NAVALI ITALIANI SPA (ITALIA); COLOR LINE MARINE AS (NORGE);
HAMBURGISCHE SCHIFFBAU-VERSUCHSANSTALT GMBH (DEUTSCHLAND); MARITIME AND
COASTGUARD AGENCY (UNITED KINGDOM); DET NORSKE VERITAS AS (NORGE); ROYAL CARIBBEAN
CRUISE LINE (UNITED KINGDOM); UNIVERSITY OF STRATHCLYDE (UNITED KINGDOM)
Project Description: The new probabilistic damage stability regulations for dry cargo and passenger ships
(SOLAS 2009), which entered into force on January 1, 2009, represent a major step forward in achieving an
improved safety standard through the rationalization and harmonization of damage stability requirements.
There are, however, serious concerns regarding the adopted formulation for the calculation of the survival
probability of ROPAX and mega cruise vessels; thus ultimately of the Attained and Required Subdivision
Indices for passenger ships. Furthermore, present damage stability regulations account only for collision
damages, despite the fact that accidents statistics, particularly of passenger ships, indicate the profound
importance of grounding accidents.
The proposed research project addresses the above issues by:
- Improving and extending the formulation introduced by MSC 216 (82) for the assessment of the probability
of survival of ROPAX and mega cruise ships in damaged condition, based on extensive use of numerical
simulations.
- Performing comprehensive model testing to investigate the process of ship stability deterioration in
damaged condition and to provide the required basis for the validation of the numerical simulation results.
- Elaborating damage statistics and probability functions for the damage location, length, breadth and
penetration in case of a collision / grounding accident, based on a thorough review of available information
regarding these accidents over the past 30-60 years worldwide.
- Formulating a new probabilistic damage stability concept for ROPAX and cruise ships, incorporating
collision and grounding damages, along with an improved method for calculation of the survival probability.
- Establishing new risk-based damage stability requirements of ROPAX and cruise vessels based on a
cost/benefit analysis to establish the highest level for the required subdivision index.
- Investigating the impact of the new formulation for the probabilistic damage stability evaluation of passenger
ships on the design and operational characteristics of a typical set of ROPAX and cruise vessel designs
(case studies).
- Preparing and submitting a summary of results and recommendations to IMO for consideration (end of
project, year 2012).
3.4 Impacts, synergies and tensions
Table 3.1 Impact matrix of the medium-term and longer-term developments
Function Indicators Bal- North Medi- Black Atlan- Arc- Outer
tic Sea terr. Sea tic tic most
1. Economic market size cruise + + ++ 0 0 0/+ 0
impacts industry
market size 0/- 0/- 0/- 0 0/- 0 0
shipyards and supply
Blue Growth - Scenarios and Drivers for Sustainable Growth from the Oceans and seas 27Function Indicators Bal- North Medi- Black Atlan- Arc- Outer
tic Sea terr. Sea tic tic most
industry
2. Employment Fte employment + ++ ++ 0 0 0/+ 0
impacts
3.
Natural habitats 0 0 0 0 0 0 0
Environmental
Energy consumption + 0 + 0 0 0 0
impacts
Aquatic life 0 0 0 0 0 0 0
Use the following symbols:
++ = Strong positive impact expected
+ = Considerable positive impact expected
0 = Negligible impact expected
- = Considerable negative impact expected
-- = Strong negative impact expected
The most important synergies and tensions are:
y Maritime transport and shipbuilding: Cruise ships sometimes use the same port facilities as
regular shipping. This can provide synergies (e.g. access channel already deepened), but also
cause conflicts. Synergies with the maritime transport cluster are also related to shipbuilding,
where the supplier industry located in Europe can serve a wider market of ship types.
y Food, nutrition, health and ecosystem services: relevant is marine litter affecting ecosystem
services;
y Energy and raw materials:
- synergy relationship as sustainability and transition to self sufficient units is affecting
demand for renewable energy sources, the implementation of cold ironing, and re-use of
water;
y Leisure, working and living:
- Cruise tourism is an important source of income for local communities. Cruise tourists are
spending in ports of destination. This also created many jobs
- Pollution and negative impact from infrastructure development on natural and living
environment (also tension with Natura2000);
Horizontally, the growth of cruise trips to pristine areas poses a tension to the natural environment
in these locations. In particular in Arctic regions, cruise tourism represents a source of disturbance
and pollution. The biggest single threat caused by ship-based activities – which thus also holds for
cruise ships – comes from the risk of a major oil spill. Other environmental impacts include
degradation of regularly-visited sites, air pollution, discharges of sewage and waste water and
introduction of non-indigenous species.
28 Scenarios and Drivers for Sustainable Growth from the Oceans and seas4 Role of policy
4.1 Policy and political relevance
y Shipbuilding companies complain that while the preparation of regulatory changes usually is a
lengthy process, the final result often comes into force very quickly, leaving little time for them
to adapt.
y The application of regional regulations instead of global rules, such as the regional ECA
initiatives, makes it more complex for operators to meet requirements, or it reduces their
flexibility with regard to the deployment of ships elsewhere. The solution of meeting the highest
standards causes cost increases.
y Environmental policy initiatives in the maritime shipping area, such as ECA’s, EEDI or ETS,
may be a useful incentive for improving the environmental footprint of shipping. However while
maritime transport competes with road or rail transport (with a leakage risk), cruise shipping
competes with totally different segments like hotels, fun parks or beach resorts as alternative
holiday destinations, for which different environmental rules apply. As an example cruise ships
have to comply with high standards concerning waste water processing, while land based
hotels can dispose waste water in municipal water treatment facilities which are large scale
and therefore operate at much lower cost. Therefore the impacts of such measures may affect
the industry in a different way and other regulation design or supporting measures may be
needed. In areas hosting vulnerable eco-systems, specific regional measures may be adding
to this.
y At the land side, cruise ports have an important function as a tourist destination but also in
respect of the embarkations and disembarkations of passengers. Due to the rapid growth of
the cruise industry and the number of passengers and calls, port facilities are not everywhere
sufficient. Port infrastructure therefore becomes more and more a constraint. The European
Cruise Council for example called the lack of operational consistency between cruise ports as
one of the main problems (ECC 2011): “unlike airports – where many of the check-in, security
and boarding procedures are standardised internationally – at ports nothing is standardised”.
4.2 Domains for EU policy
y Within the cruise industry there is a strong degree of concentration. Only a limited number of
cruise lines dominate the market and therefore have much market power. Opposite of the
cruise lines are the ports. In order to provide more counterweight for cruise lines EU policy can
play a role, for example as focal point or bringing together and facilitating the various parties
y At the moment there is no level playing field for port destinations in Europe (among other
customs clearance). Like airports, EU policy may contribute to the harmonization of rules and
the pursuit of operational consistency.
y Aspects in the field of environment and safety fall under the responsibility of IMO. The role of
EU policy is limited in this area, but as a major player and partner in the discussion groups (EU
and/or member states), the EU can put more pressure to accelerate the introduction and
improvement of measures on safety and environment. Increased attention to safety may be
expected following the Costa Concordia accident.
Blue Growth - Scenarios and Drivers for Sustainable Growth from the Oceans and seas 29Annex 1: Bibliography
• Carnival Corporation& PLC (2011), 2010 Annual Report, Miami/ London.
• Cruise Lines International Association (2008), Cruise Market Profile Study, Fort Lauderdale.
• Cruise Lines International Association (2010), 2010 CLIA Cruise Market Overview: Statistical
Cruise Industry Data Through 2009, Fort Lauderdale.
• Dowling, Ross K. (ed.) (2006), Cruise Ship Tourism, CAB International.
• Ecorys (2012), Green growth opportunities for the EU shipbuilding industry.
• The Guardian, P&O cruise ship staff paid basic salary of 75p an hour, 29 April 2012
• Gui, L. & A.P. Rosso (2011), Cruise ports: a strategic nexus between regions and global lines:
evidence from the Mediterranean, In: Maritime Police & Management, Vol. 38, no 2. , pp 129-
150.
• Leakakou, N. (ed.) (2010), The Economic Impact of Cruise to Local Economies: The case of an
Island, Presented at The 2011 Athens Tourism Symposium. Athens.
• Leakakou, N. (ed.) (2010), Which Homeport in Europe: The cruise industry’s selection criteria.
Tourismos.
• Lloyd’s List, New 2012 bookings are significantly down in Europe, RCCL says, 2 February
2012
• Lloyd’s List, The best regulations are worthless unless there is strict compliance, 31 January
2012
• Ecorys (2009), Study on Competitiveness of the European Shipbuilding Industry. Rotterdam/
Brussel.
• Ecorys (2011), Green growth opportunities for the shipbuilding industry (forthcoming November
2011)
• Ecorys (2011), CBA for cruise infrastructure in the Grand Harbour, Malta (forthcoming August
2011)
• European Cruise Council (2010), The growing European Cruise Sector, Environmental
Responsibility and Cultural Tourism (presentation), Brussels.
• European Cruise Council (2011), The Cruise Industry (2011 edition), Brussels.
• European Cruise Council (2012), Contribution of Cruise Tourism to the Economies of Europe
(2012 edition), Brussels.
• The Naval Architect (February 2011), New look to future cruising, London.
• Papathanassis, Prof. dr. A (2011), Farming ice bergs: Cruise destinations in the Northern
Atlantic. Presentation at the Cruise Gateway opening conference, 17 February 2011, Hamburg.
• Policy Research Corporation (2009), Tourist facilities in ports, The economic factor, Antwerp/
Rotterdam.
• Policy Research Corporation (2009), Tourist facilities in ports, The environment factor,
Antwerp/ Rotterdam.
• Port statistics provided by Transport Malta
• Peisley, T. (2008), 2020 Vision: New Focus for the Global Cruise Industry. Seatrade.
Colchester, UK.
• Wild, G.P. (2008), The prospects for developing Malta as a fly-cruise and stay destination,
June 2008
Blue Growth - Scenarios and Drivers for Sustainable Growth from the Oceans and seas 31You can also read