Network-risk: an open GIS toolbox for estimating the implications of transportation network damage due to natural hazards, tested for Bucharest ...
←
→
Page content transcription
If your browser does not render page correctly, please read the page content below
Nat. Hazards Earth Syst. Sci., 20, 1421–1439, 2020
https://doi.org/10.5194/nhess-20-1421-2020
© Author(s) 2020. This work is distributed under
the Creative Commons Attribution 4.0 License.

Network-risk: an open GIS toolbox for estimating
the implications of transportation network damage
due to natural hazards, tested for Bucharest, Romania
Dragos Toma-Danila1 , Iuliana Armas2 , and Alexandru Tiganescu1
1 National   Institute for Earth Physics, Măgurele, Ilfov, 077125, Romania
2 Faculty   of Geography, University of Bucharest, Bucharest, 010041, Romania

Correspondence: Dragos Toma-Danila (toma@infp.ro)

Received: 12 December 2019 – Discussion started: 8 January 2020
Revised: 1 April 2020 – Accepted: 24 April 2020 – Published: 23 May 2020

Abstract. Due to their widespread and continuous expan-           stock but also significant traffic congestion problems not yet
sion, transportation networks are considerably exposed to         accounted for in risk analyses and risk reduction strategies.
natural hazards such as earthquakes, floods, landslides or
hurricanes. The vulnerability of specific segments and struc-
tures among bridges, tunnels, pumps or storage tanks can
translate not only into direct losses but also into significant   1   Introduction
indirect losses at the systemic level. Cascading effects such
as post-event traffic congestion, building debris or tsunamis     The complexity and exposure of our society to natural haz-
can contribute to an even greater level of risk. To support       ards have significantly increased in the last decades (Gu,
the effort of modeling the natural hazards’ implications at       2019; Pesaresi et al., 2017; Fleischhauer, 2008) and will con-
the full transportation network scale, we developed a new         tinue to do so. Transportation networks are one of the fun-
applicable framework, relying on (i) GIS to define, analyze       damental pillars of development and support for countries,
and represent transportation networks; (ii) methods for de-       whether they consist of roads, railways, pipelines, communi-
termining the probability of network segments to fail due to      cation lines, maritime, or aerial or other types of networks.
natural-hazard effects; (iii) Monte Carlo simulation for mul-     Transportation networks are a requirement for almost ev-
tiple scenario generation; (iv) methods to analyze the impli-     ery inhabited place – residential, commercial or industrial –
cations of connectivity loss on emergency intervention times      and they continue to be upgraded per location and also ex-
and transit disruption; and (v) correlations with other vulner-   pand. As such, they become more and more exposed, if not
ability and risk indicators. Currently, the framework is inte-    also more vulnerable. In Recent large-scale natural-hazard
grated into ArcGIS Desktop as a toolbox entitled “Network-        events, such as earthquakes (Italy in 2016 and 2009, Nepal
risk”, which makes use of the ModelBuilder functions and          in 2015, Haiti in 2010, China in 2008, etc.), some accompa-
is free to download and modify. Network-risk is an attempt        nied by very destructive tsunamis (Japan in 2011 or Indone-
to bring together interdisciplinary research with the goal of     sia in 2018 and 2004), hurricanes and typhoons (Mozam-
creating an automated solution to deliver insights on how a       bique in 2019, Puerto Rico in 2017, Philippines in 2013
transportation network can be affected by natural hazards, di-    and 2012, Myanmar in 2008, or the USA in 2005), or heat-
rectly and indirectly, assisting in risk evaluation and mitiga-   waves (constant in the last years in countries such as the
tion planning. In this article we present and test Network-risk   USA, Australia, Greece or Spain), proved that transportation
at the full urban scale for the road network of Bucharest. This   networks are extremely vulnerable but also vital immediately
city is one of Europe’s most exposed capitals to earthquakes,     after the event occurrence. Directly contributing to the eco-
with high seismic-hazard values and a vulnerable building         nomic loss balance of such events, transportation networks
                                                                  are more and more significant, especially in developed coun-

Published by Copernicus Publications on behalf of the European Geosciences Union.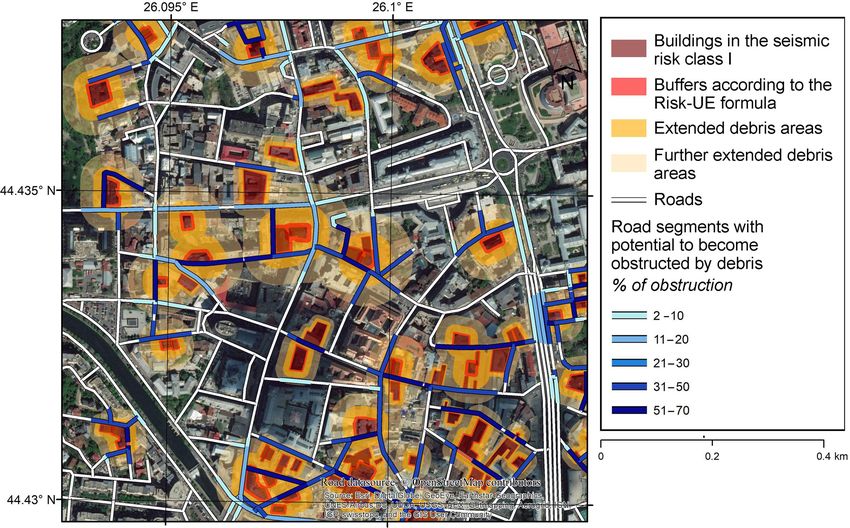
1422                                D. Toma-Danila et al.: Network-risk toolbox for estimating natural hazard implications

tries (Wilkerson, 2016). Taking into account also the indirect         – The proper definition of the network, with detailed data
losses (hard to quantify), it is even more obvious that their            regarding component characteristics and connectivity.
vulnerability needs to be reduced.                                       One of the problems is still, in most cases, the lack of of-
   The functionality of transportation networks is very im-              ficial data: in developed countries there can be available
portant both immediately after a hazardous event – constitut-            good and updated GIS databases; however in most other
ing support for emergency intervention – and for long time               countries transportation network data (at least for roads
afterwards – in the recovery and prevention phases. Dam-                 or railways) is not well officially defined and/or shared
age to networks can carry direct risks, such as the collapse             with the general public, and therefore alternative data-
of vehicles or trains, fire outbreaks, etc. Still, functionality         sources need to be used, such as OpenStreetMap (open-
and redundancy are essential in order to ensure that socioeco-           source), Google Maps, HERE Maps, etc. There are cur-
nomic losses do not increase significantly. In any transporta-           rently many software solutions capable of network de-
tion network analysis, the interconnectivity between systems             velopment (including AutoCAD Civil 3D, OpenRoads
and with other networks should also be considered. In the                or ESurvey Road Network), but not so many have risk
post-disaster reaction phase, especially road networks prove             analysis capabilities; among them, we mention popu-
to be very important (Jenelius and Mattsson, 2015), since                lar solutions such as ArcGIS Desktop with the Network
they link almost all destinations; in some cases other trans-            Analyst extension, PTV Visum and Vissim, MAEviz
portation networks can be also relevant, namely railways,                and EQvis, or STREET.
maritime or aerial networks. Communication networks are
critical in all disaster cycle phases. Utilities are important for     – The determination of direct damage probability of in-
a faster recovery and overall, for ensuring resilience. Previ-           dividual components. For this, earthquake engineering
ous experiences show that transportation networks are mostly             analysis methods are mostly used, such as dynamic
affected by natural disasters in two ways:                               elastic and inelastic analysis using grids and numerical
                                                                         methods: the finite-element method, pushover or time–
  – directly – by the collapse of critical components such               history analysis, response spectra, etc. A good synthesis
    as bridges, tunnels, storage tanks, pumps, etc.; cracks              of these methods can be found in Crowley et al. (2011)
    in roadways due to ground motion effects (settlement,                and Costa (2003).
    liquefaction); railway displacement; and pipe cracks;
                                                                       – The need to define relevant performance indicators, re-
  – indirectly – by road blockage due to collapsed build-                flecting time or cost differences between pre- and post-
    ings (especially in urban areas); blockage due to trig-              disaster network behavior. Many performance indica-
    gered landslides, flooding or tsunamis; blockage due to              tors for networks can be found in literature, some of the
    traffic congestion generated by post-disaster behavior;              most common at the system level being driver delay,
    emergency-imposed restrictions, etc.                                 simple or weighted connectivity loss (Pinto et al., 2012;
                                                                         Poljanšek et al., 2011), the system serviceability index
For studying the impact of natural disasters on transporta-              (Wang et al., 2010), or the serviceability ratio (Adachi
tion networks, multi- and inter-disciplinary approaches are              and Ellingwood, 2008).
needed, combining methods belonging to geosciences, engi-
neering, sociology, economy or informatics. Also, multiple           In recent years, new technologies such as Internet-of-things
perspectives need to be considered (Franchin et al., 2011):          devices, big data, remote sensing, drones, low-cost sensors
                                                                     and machine learning started to be quickly adopted, as they
  – temporal perspectives (the disaster management cycle);           can provide practical solutions for transportation network
  – spatial perspectives – local (structural element studies),       data collection and analysis. It is expected that the impact
    regional, national, or multinational;                            of future natural hazards on transportation networks will be
                                                                     much better recorded (as shown by Voumard et al., 2018),
  – actors involved (level of management).                           allowing for a better validation of risk models and oppor-
                                                                     tunities to create more representative methodologies for the
In the last 2 decades, significant progress has been achieved        analysis of network risk, also in near-real time.
in transportation network vulnerability and risk analysis –             In order to analyze systemic risk (and not only compo-
not just at the structural level but also at the functional level.   nent risk), networks need to be evaluated from the perspec-
For a comprehensive review, we recommend the studies of              tive of the direct damage implication on connectivity, traffic
Jenelius and Mattsson (2015), Miller (2014), Tesfamariam             changes or new traffic flows created, leading to indirect dam-
and Goda (2013), Franchin et al. (2011) in the framework of          age. Recent studies have addressed these aspects (Koks et
the Syner-G Project, or Kiremidjian et al. (2007). These stud-       al., 2019; Vodak et al., 2015; Caiado et al., 2012; Bono and
ies reveal that the fundamental steps in evaluating the seismic      Gutierrez, 2011; Douglas et al., 2007; Franchin et al., 2006),
risk of transportation networks are as follows.                      going beyond the simple summarization of direct effects and
                                                                     eventually of reconstruction costs generated. These studies

Nat. Hazards Earth Syst. Sci., 20, 1421–1439, 2020                                  https://doi.org/10.5194/nhess-20-1421-2020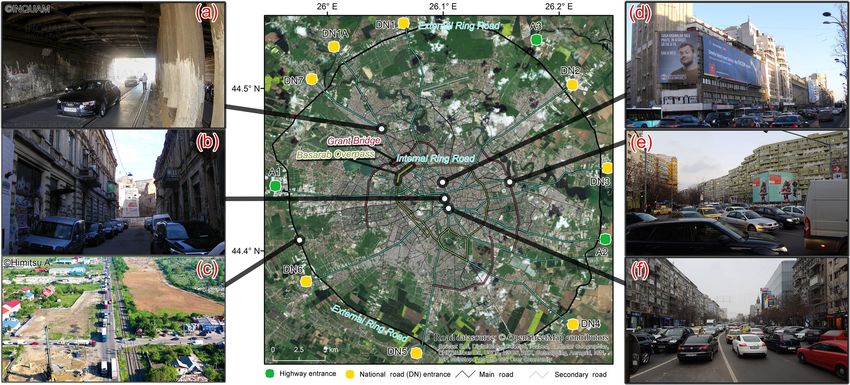
D. Toma-Danila et al.: Network-risk toolbox for estimating natural hazard implications                                           1423

also highlight an important aspect to consider (Pitilakis and       railway, utilities, etc., represented at the local, regional or na-
Kakderi, 2011) interactions between the components of the           tional level) and of different natural hazards. The method-
system (inter-interactions) and with components of other sys-       ology can accommodate, for example, the analysis of earth-
tems (intra-interactions).                                          quake implications, where damage is widespread, and build-
   After analyzing available methodologies and solutions in         ing debris, traffic patterns and a good level of detail for net-
the field of study, we reached the conclusion that, nowadays,       work definition are necessary to be considered. For land-
capabilities can be better exploited, enabling not only a more      slides, the factors to be considered will change, since damage
flexible but also a standardized analysis of transportation net-    will be much more punctual and random simulations might
work implications due to natural hazards compared to previ-         not be so representative. For flooding, vulnerability analysis
ous works. We consider that much has been done theoreti-            of networks such as road or railways will require knowledge
cally, and too little has been done practically (at least at full   on topography – not so representative of earthquake analy-
city-scale analysis), also leaving room for new technologies,       sis. Still, the methodology will accommodate all these haz-
and this is what motivated us to create a new GIS solution          ard types and influences, as long as, for example, loss analy-
sharable with the community and applicable worldwide. In            sis will lead to the identification of possibly affected network
this paper, which provides a settled methodology after pre-         segments. There is also flexibility in the way the risk anal-
liminary studies such as Toma-Danila (2018) or Toma-Danila          ysis is oriented – toward emergency intervention, economic
et al. (2016), we will focus on the following:                      losses evaluation or urban planning.
                                                                       Most of the input data (yellow boxes in Fig. 1) are re-
    – presenting a methodology for evaluating direct and indi-      quired, also with GIS reference, with the exception that, de-
      rect transportation network risk due to natural hazards,      pending on the analysis type, emergency intervention facil-
      embedded in the ArcGIS Desktop as an open-source              ities or origin–destination (OD) pairs will not necessary be
      toolbox called “Network-risk”,                                needed. In addition, an analysis without typical traffic data
                                                                    can be performed, although it might be representative just
    – demonstrating its capabilities for a representative case      for night traffic conditions.
      study – Bucharest – one of the most vulnerable capi-             The process of building a consistent transportation net-
      tals in Europe due to the implications of earthquakes,        work, from more or less complex datasets, is an essential
      where results represent an important contribution to          part of every network analysis. To assist in this effort we
      emergency management risk reduction planning.                 created a guide, models and layer symbology for properly
                                                                    converting and editing data partially manually, following
                                                                    also the ArcGIS Desktop Network Analyst extension rec-
2    Methodology and implementation                                 ommendations. An alternative solution can be to use the
                                                                    ArcGIS OpenStreetMap (OSM) editor (https://github.com/
The generalized steps of the methodology are comprised of           Esri/arcgis-osm-editor, last access: 27 April 2020) for Open-
the following:                                                      StreetMap data (it is possible, however, to experience limita-
    – defining a transportation network in a GIS,                   tions in expressing Z elevation), GRASS GIS v.net or proce-
                                                                    dures such as those in Karduni et al. (2016). Eventually, the
    – evaluating which segments could be affected by a natu-        converted data are expected by Network-risk to be similar to
      ral hazard (directly or indirectly) – accounting also for     the sample files provided on the Network-risk web page. At
      the probability of damage,                                    the moment, the compulsory columns required in the analy-
                                                                    sis are “name”, “oneway”, “F_ZLEV”, “T_ZLEV”, “hierar-
    – generating random damaged network scenarios based             chy”, “maximum_speed”, “FT_minutes” and “TF_minutes”.
      on this probability,                                          To these, further columns accounting for traffic, scenario
                                                                    travel times or lack of functionality due to natural-hazard ef-
    – evaluating the implications in terms of connectivity          fects will be added, depending on data availability and anal-
      and serviceability losses and then socioeconomic con-         ysis type. In the process of defining the rules for the net-
      sequences.                                                    work dataset (ND), the Network-risk toolbox requires adding
                                                                    more evaluators besides the ArcGIS Network Analyst exten-
This concept was previously defined in studies such as Hackl        sion defaults, with the most important being for obstructions
et al. (2018), Zanini et al. (2017), Vodak et al. (2015), Chang     (used in service area analysis in the impedance field to reveal
et al. (2012) or Argyroudis et al. (2005). However, the way         inaccessible road areas) and others for different typical traffic
each of the tasks are treated, linked and implemented in GIS        scenarios or for economic costs.
is what we consider to be progress toward standardization              Both pre- and post-earthquake traffic data are highly im-
and usability in real situations (also in near-real time). The      portant, since they show the typical functionality status of
methodology presented in Fig. 1 allows, among others, the           the network and the premises for new traffic congestion im-
consideration of multiple transportation network types (road,       mediately after an earthquake (with correlations also to road

https://doi.org/10.5194/nhess-20-1421-2020                                 Nat. Hazards Earth Syst. Sci., 20, 1421–1439, 2020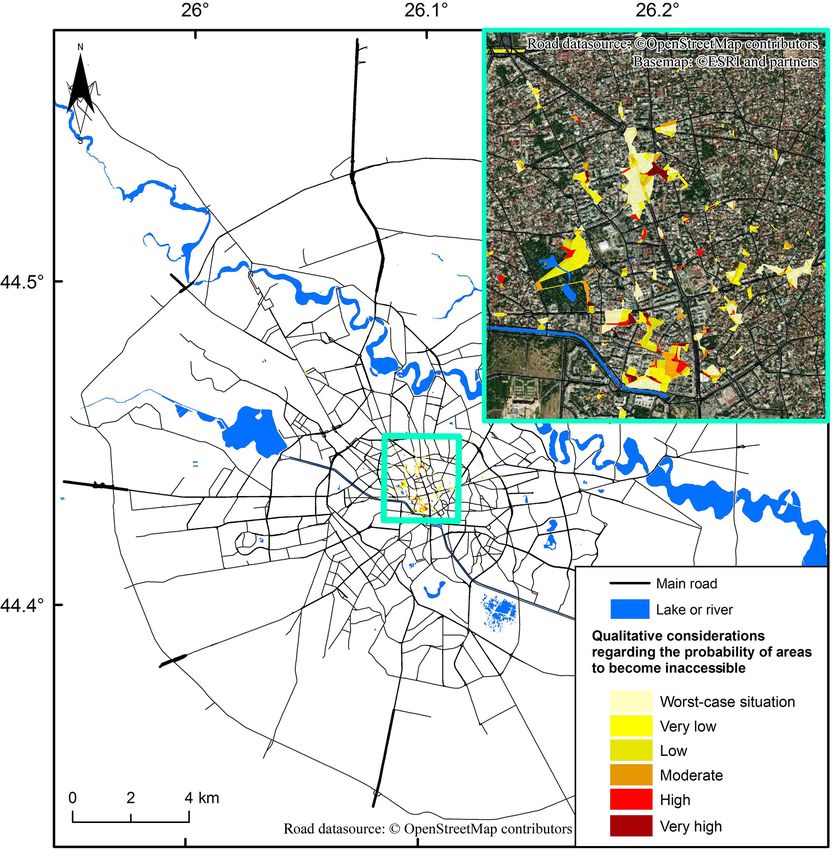
1424                               D. Toma-Danila et al.: Network-risk toolbox for estimating natural hazard implications

Figure 1. Graphical representation of the proposed methodology for evaluating the implications of transportation network damage due to
natural hazards, integrated into the Network-risk toolbox.

segments blocked by, for example, building debris or bridge          probability of a building to collapse can be further linked to
collapse). Typical traffic data can be retrieved from local          the probability of road blockage, due to debris, for exam-
datasources (such as traffic management authorities) or from         ple (in the case of earthquakes, there are equations for this
companies taking advantage of new device capabilities, such          purpose, such as those of Santarelli et al., 2018; Zanini et
as Google Traffic, HERE Traffic or Waze. These sources pro-          al., 2017; Argyroudis et al., 2005; and Moroux et al., 2004).
vide live (or statistical) data regarding traffic values and re-     Knowing where affected areas are also contributes to the
ported incidents, although to integrate these data into our          evaluation of indirect risk, aiding, for example, the calcula-
framework, it is needed to convert these data into travel speed      tion of the chance of people caught under debris to survive,
per road segment or to turn to barrier or restriction GIS lay-       using results of field studies such as those of Hekimoglu et
ers. Other solutions with near-real-time analysis capabilities       al. (2013), Coburn and Spence (2002), or Goncharov (1997).
can be to use GPS data – from emergency vehicles or the                 After including references to the natural hazard, in the
expertise of their drivers – especially for emergency man-           form of maps with transferable values to vulnerability func-
agement analysis.                                                    tions, the result would be an evaluation of the direct possi-
   The network layer represents the exposure; to evaluate the        ble damage and, as such, a probability of network segment
vulnerability of network segments to a specific natural haz-         blockage. This can be used for generating random scenario
ard (or multiple hazards – the analysis can also take this di-       simulations using the Monte Carlo approach (potential ac-
mension), it is required to associate failure probabilities. For     knowledged by Burt and Graham, 1971) in order to test the
individual structures (such as bridges, tunnels, pump facil-         behavior of the network in multiple probable situations. As-
ities, electricity poles) or for buildings (including network        signing a probability of 100 % for the failure of a network
buildings), vulnerability functions are commonly used to de-         segment (indicating certain blockage) is useful for worst-
termine damage probability or even more: functionality loss          case scenarios or clear cases of vulnerability (for example, a
or resilience functions such as closure time or recovery cost.       highly vulnerable bridge which will certainly not withstand
Although it is recommended to use structure-specific (local)         high acceleration values due to an earthquake or a road seg-
functions, considering particular properties of the structure        ment where rockfalls happen even without a significant trig-
and of the construction practices in the specific country or re-     ger). However, in most of the cases this probability will need
gion, there are currently available fragility function libraries,    to be smaller, allowing for random simulations to show mul-
collected and harmonized in projects such as Hazus, Syner-G          tiple implication patterns. Also, post-disaster traffic can be
or SERA, which can be associated, preliminarily, with some           considered independently for each simulation. Monte Carlo
of the assets in other region. In some cases, analyzing the          scenarios are usually supposed to come in large numbers

Nat. Hazards Earth Syst. Sci., 20, 1421–1439, 2020                                   https://doi.org/10.5194/nhess-20-1421-2020
D. Toma-Danila et al.: Network-risk toolbox for estimating natural hazard implications 1425
(hundreds or thousands of runs), and, depending on the size and others. We chose to split Network-risk into multiple sep-
of the network, the amount of computational time is expected arate modules (such as for network creation, Monte Carlo
to be considerable. However, the need for a vast number of scenario creation, disrupted network building, service area
Monte Carlo scenarios might not really be necessary. The analysis or aggregation of results into a final index), mak-
existence of many viable detour routes in urban areas or the ing it easy to identify errors at different steps. The toolbox
small number of identified network segments expected to be is available for download at http://www.infp.ro/index.php?i=
highly damaged can determine the need of a smaller sample nri (last access: 27 April 2020) and is free to use and cus-
of Monte Carlo scenarios – this is why the stabilization of tomize.
results must be traced. Considering the steps described in Fig. 2, ArcGIS Network
For estimating post-event traffic patterns, assumptions Analyst capabilities and the results which are later shown
providing travel speed modifications for road segments lo- by our case study, the Network-risk toolbox is capable of
cated close to affected areas, especially in urban agglomer- answering important questions for emergency management,
ations, must be included. Some hints for determining these city planning, commercial, insurance, industrial or real-estate
patterns can be found in the work of Zanini et al. (2017) or agents and many others, such as the following:
Chang et al. (2012). More complex approaches relying on
– Which areas could become inaccessible after a natural
individual driver behavior simulations or decision patterns,
disaster? What are the vital access routes in case of a
as described in Asaithambi and Basheer (2017) or Munigety
disaster? Are there viable detour routes?
and Mathew (2016), can be implemented.
At the core of the network implication analysis, different – What is the socioeconomic impact (in terms of human
shortest-path routing algorithms (by short, not referring al- or financial losses) in case of a natural disaster, corre-
ways to distance but also to less risk) can be used, such as the lated also with emergency management capabilities?
Dijkstra algorithm, the A∗ algorithm, Johnson’s algorithm
or the Floyd–Warshall algorithm. In our implementation and – How would new network segments, hospitals, fire sta-
case study we preferred the Dijkstra algorithm, which was tions or other facilities contribute to reducing the risk?
used for computing the shortest distance (in real meters or Where should they be placed?
costs) for various network configurations – pre- and post-
event (for service area, route, closest facility or OD matrix 3 Bucharest road network case study, considering
analysis). This algorithm is widely used in systemic network seismic hazard
analysis (Sniedovich, 2016), providing a good balance be-
tween precision and performance (Bast et al., 2016) and be- 3.1 Case study area description
ing also chosen as a preloaded algorithm in ArcGIS. Depend-
ing on user preferences, other algorithms can be applied – us- For testing the methodology, we selected Bucharest – one of
ing, for example, an alternate approach relying on QGIS with Europe’s endangered capitals due to high seismic risk (Toma-
pgRouting (https://pgrouting.org/, last access: 27 April 2020) Danila and Armas, 2017; Pavel, 2016). The city was pre-
or A∗ in ArcGis. For service area analysis, used in the emer- viously affected by strong earthquakes in the Vrancea seis-
gency intervention travel time evaluation, we recommended, mic area (such as the ones on 10 November 1940, Mw =
as an analysis method, using detailed polygon generation, 7.7, at 150 km depth, and on 4 March 1977, Mw = 7.4, at
with results of prior analysis for identifying inaccessible net- 94 km depth) and is currently still poorly prepared (Pavel,
work areas as barriers, since the results will better reflect 2016) for the next major event, which will most certainly
small inaccessible areas. happen anytime in the next 100 years. Compared to 1977
The entire methodology is embedded in a toolbox called (when 1578 people died in Romania, of which 90% were in
Network-risk, which currently runs under ArcGIS Desktop Bucharest), the city now faces an additional challenge be-
Advanced (10.1+ version) with the Network Analyst exten- sides the high vulnerability of the building stock: the vulner-
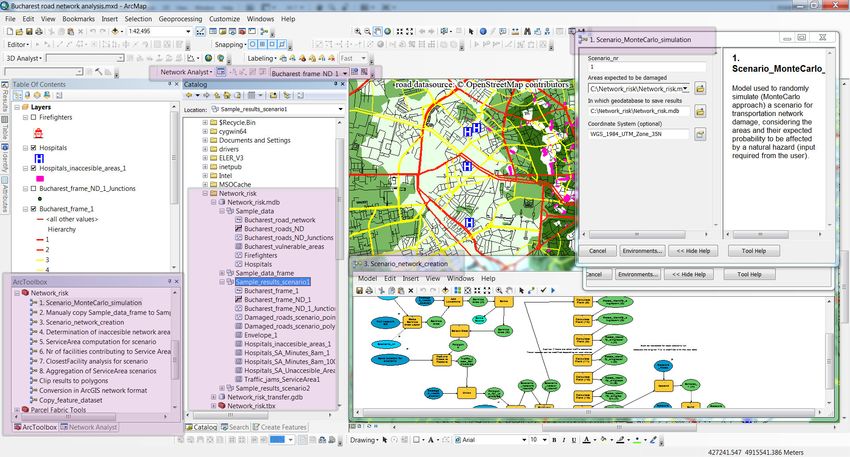
sion enabled, using ModelBuilder capabilities (Fig. 2). This ability due to the road network and urban traffic. In a city
toolbox takes advantage of the geo-processing already avail- with over 2 million inhabitants, there are 1.2 million regis-
able and location–allocation algorithms and enables a stan- tered vehicles (NIS, 2018). To this number, the contribution
dardized, non-hazard dependent and automated large-scale of transit vehicles not adequately serviced by an external ring
network risk analysis. In this direction, we acknowledge the road (Fig. 3c) or vehicles of numerous commuting persons
previous works of Vodak et al. (2015), Pinto et al. (2012), from nearby counties or students can also be added. In the ab-
or Sevtsuk and Mekonnen (2012), which we consider, how- sence of efficient urban development and mobility measures,
ever, not fully usable, especially in the more recent context. in combination with mentality issues (the self-requirement
Having the methodology implemented in ArcGIS offers ex- to own and use a car), the city faces regular traffic jams,
tended analysis support through cartographic, spatial analyst being ranked as Europe’s number one capital (5th in the
modules, available basemaps, plug-ins such as ArcCASPER world in 2017 and 11th in 2018) when it comes to the typical
(Shahabi and Wilson, 2014) for computing evacuation routes congestion level (TomTom, 2018; typical traffic examples in
https://doi.org/10.5194/nhess-20-1421-2020 Nat. Hazards Earth Syst. Sci., 20, 1421–1439, 2020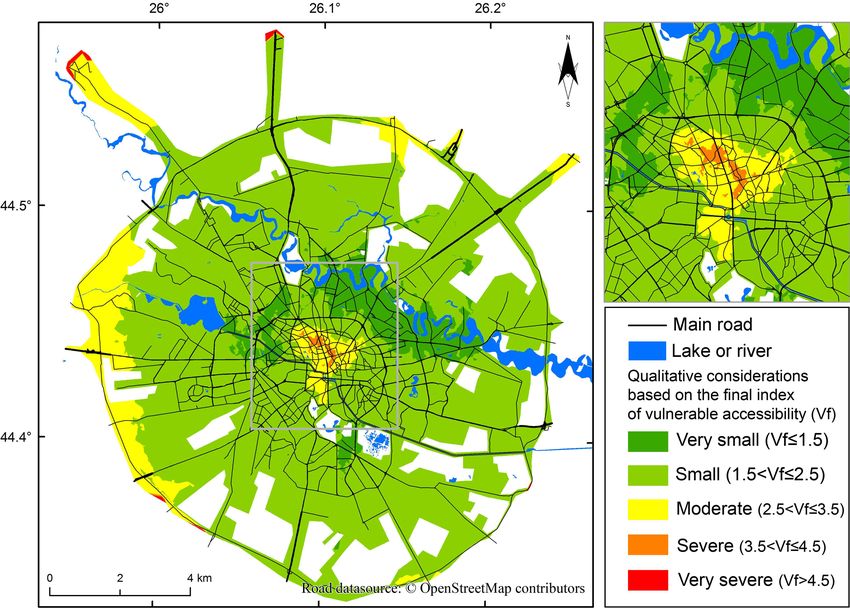
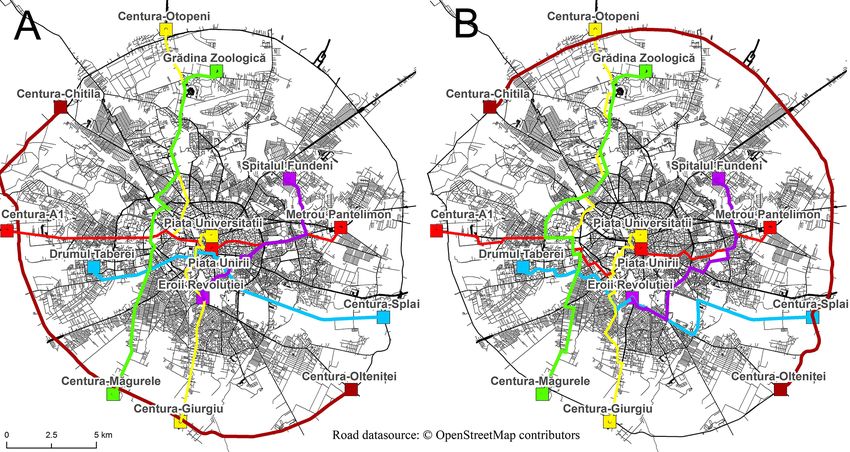
1426                               D. Toma-Danila et al.: Network-risk toolbox for estimating natural hazard implications

Figure 2. Screen capture of ArcGIS Desktop ArcMap with Network-risk toolbox added, contributing to the analysis of Bucharest’s road
network risk analysis; the framework of one of the models (3. Scenario_network_creation) can be seen as well as the model run interface
(1. Scenario_MonteCarlo_simulation), the Network-risk toolbox modules and the sample data results created using these modules (high-
lighted in purple).

Fig. 3d–f). Beside traffic, Bucharest’s road network mainte-          quake; still the typical traffic was not severely affected due
nance and serviceability status is precarious, with much dys-         to low traffic values and the wide use of public transport in
function related to the quality of embankments, bridges, or           those days. We believe that nowadays, such a measure would
over- or underpasses (Fig. 3a); poor construction and mainte-         have much more adverse implications. Considering also the
nance; and limitations in the full utilization of roads’ size due     much larger expected damage scale nowadays (Armas et al.,
to illegal (and unsanctioned) parking in many cases (Fig. 3b)         2016; Pavel and Vacareanu, 2016), emergency intervention
or constantly exceeded deadlines for repair or new roadwork.          will have to be provided from multiple locations (inside and
Another important aspect is that many buildings, not solely in        outside of the city), and usual traffic patterns (not to mention
the city center, are highly vulnerable to earthquakes (Toma-          the ones right after a major earthquake, depending also on the
Danila et al., 2017). More than 31 430 residential buildings          time of occurrence) will clearly act against a proper reaction.
were constructed prior to 1946 (294 having more than four             All these problems make Bucharest a highly representative
stories – a vulnerable category due to long fundamental pe-           test bed for the methodology proposed in this article.
riods of intermediate-depth Vrancea earthquakes), accord-                Preliminary analysis of the associated seismic risk of the
ing to the 2011 National Population and Housing Census.               Bucharest road network was performed in recent years, us-
In addition, 26 349 residential buildings (237 having more            ing slightly different approaches (Toma-Danila, 2018; Ianoş
than four stories) were constructed between 1946 and 1960,            et al., 2017); however these were not so flexible or were not
a period with no compulsory seismic design code, having en-           at the full city scale, concentrating only on the city center.
dured at least one major earthquake with limited evaluation           Our goal for the analysis is to play an important role in the
and seismic retrofitting afterwards (Georgescu and Pomonis,           mitigation of seismic risk in Bucharest, being the first analy-
2018). One should realize that if only 1 % of the buildings           sis for the entire city of Bucharest.
completely or partially collapse, it could clearly lead to many
deaths and injuries, which are difficult to manage not only           3.2   Data and methods considered for Bucharest
due to hospital capacity and equipment, as the recent Colec-
tiv Club fire disaster proved (Marica, 2017), but also due to         The starting point for the analysis was the development of a
severe road blockages. In 1977, central boulevards such as            road network GIS database, respecting connectivity and ele-
Magheru were closed for at least 3 d after the 4 March earth-         vation rules. Currently, an official database of this kind is not

Nat. Hazards Earth Syst. Sci., 20, 1421–1439, 2020                                    https://doi.org/10.5194/nhess-20-1421-2020
D. Toma-Danila et al.: Network-risk toolbox for estimating natural hazard implications                                             1427

Figure 3. Bucharest road network map, highlighting main roads and connections with highways and national roads. (Datasource: © Open-
StreetMap contributors 2019. Distributed under a Creative Commons BY-SA License; data from September 2016. Basemap: © ESRI and
contributors.) Examples of vulnerable area: Constant, a Bridge underpass (© INQUAM) (a), illegal parking (b), southern external ring road
dysfunctionalities (c), typical rush-hour traffic (© Himitsu A.) (d–f) and vulnerability due to old buildings with seismic risk (b, d).

available for Bucharest. This is why we used data from OSM,               For determining which road segments can be affected by
which is one of the most successful crowdsourcing projects             earthquakes, we used the procedures described in Table 1.
aiming to create a geospatial database of the whole world,             In total the following values were determined, totaling to
with relatively up-to-date data for Romania, thanks also to            1.41 % of the total number of road segments in Bucharest:
the involvement of many local volunteers (https://forum.
                                                                         – 1324 segments with variable length which can be-
openstreetmap.org/index.php, last access: 27 April 2020),
                                                                           come affected by debris (partially shown in Fig. 4; just
and with good applicability in vehicle routing (Graser et al.,
                                                                           32.6 %, however with a damage probability > 50 %)
2014). OSM road vector data were downloaded using the Ge-
ofabrik GIS Data Portal (http://download.geofabrik.de, last              – 985 segments with variable length can become directly
access: 27 April 2020), requiring additional processing in                 affected by bridge collapse.
ArcGIS Desktop’s ArcMap (Network-risk toolbox template
and guidelines are provided) in order to convert it into the           After performing 20 Monte Carlo simulations (each with an
ArcGIS network format, accounting for connectivity, hier-              average runtime of 12 min on a normal desktop computer –
archy, travel direction (from–to – FT – and to–from – TF),             from simulation to service area results), we considered the
Z elevation (creating distinctions between roads at ground             results to be stable enough to reflect the damage patterns for
level, bridges or underpasses) and travel time. For Bucharest          the rather extended road network of Bucharest and stopped
– up to the external ring road and its connections to the city         our simulations, which are not time-consuming but still dif-
center – the final number of individual road segments (every-          ficult to summarize automatically.
thing represented in Fig. 3) was 50 412. We used data from                In order to account for traffic – a major issue for Bucharest
September 2016; since then, until December 2019, no ma-                – we followed the patterns shown typically by Google Traffic
jor road network modifications have been made in Bucharest             for various representative scenarios:
(the main exception being the extension of A3 up to north-               – Monday at 02:00 LT – no traffic,
eastern Bucharest, but with no major influence on our anal-
ysis). When analyzing statistics (especially road length) it is          – Monday at 08:00 LT – morning traffic,
important to account for road segments’ difference of draw-
                                                                         – Monday at 18:00 LT – end-of-work traffic.
ing roads per lane or as a whole in OSM – otherwise the real
number of kilometers will in some cases be doubled. This is            Traffic values were obtained by the following procedure:
why we prefer not to present statistical road length graphs.
                                                                         – digitizing areas described qualitatively in Google Traf-
                                                                           fic (very slow, slow, moderate or fast traffic),

https://doi.org/10.5194/nhess-20-1421-2020                                    Nat. Hazards Earth Syst. Sci., 20, 1421–1439, 2020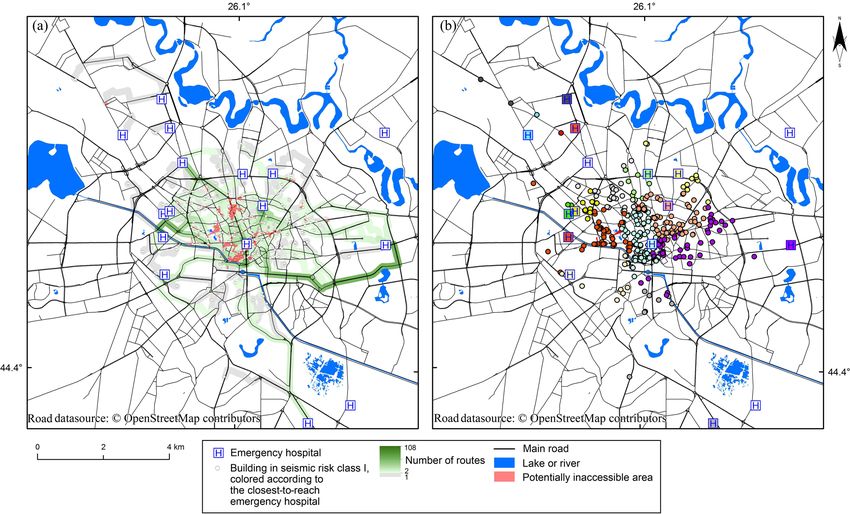
1428                                D. Toma-Danila et al.: Network-risk toolbox for estimating natural hazard implications

Figure 4. Example of road blockage analysis due to building debris, applied for the historical center of Bucharest. (Datasource: © Open-
StreetMap contributors 2019. Distributed under a Creative Commons BY-SA License; data from September 2016. Basemap: © ESRI and
contributors.)

Table 1. Factors considered for determining the probability of road segments to be affected by earthquakes.

        Factor            Method of analysis
        Bridges           Mean fragility functions from Crowley et al. (2011) for the corresponding structural typology (mostly
                          reinforced concrete) were used. Considering the microzonation map of Marmureanu et al. (2010) for
                          maximum peak ground acceleration (PGA) values in Bucharest due to the largest probable earthquake
                          in Vrancea, the complete damage probabilities obtained were small: 1.5 %–2 %. For the Basarab
                          Overpass, fragility functions were adapted due to different characteristics (suspension and steel-arch
                          bridge sections, seismic passive dampers), considering descriptions in Sartori (2012).
        Roads blocked     We used Eq. (1) (from Moroux et al., 2004) to determine the probability of roads to be blocked by the
        by building       debris generated by the collapse of buildings in the seismic risk class I, which are most likely to collapse
        debris            during the design earthquake corresponding to the ultimate limit state (349 in total, mostly with more
                          than four stories, according to Bucharest City Hall data from January 2016 –
                          https://amccrs-pmb.ro/liste-imobile, last access: 27 April 2020); the footprint of buildings was
                          determined, and buffers were added according to debris area; the output (Fig. 4) was supplemented by
                          expert judgment based on satellite images, building structural considerations and building vicinity, road
                          width etc., to attribute road blockage probabilities – ranging from 1 % to 70 %, since no building is
                          certain to collapse.
                          Debris area (m) = 23 · Number of floors                                                                 (1)
        Liquefaction      We attempted to use some data (Neagu et al., 2018), but eventually the liquefaction map was considered
                          too generic; after more detailed analysis we can integrate it into the analysis.

  – identification of roads in these areas (also considering                – corrections applied in areas with a considerable devia-
    FT and TF ways),                                                          tion from the expected values.
  – modification of travel times (for fast traffic – using the           Although time-consuming, this procedure yielded good re-
    maximum allowed speed – and for very slow traffic –                  sults. Given that our analysis focuses on the intervention of
    2 km h−1 ),                                                          emergency vehicles, the influence of traffic lights was ne-
  – validation with the Google Traffic Directions service                glected (although it can be considered for other analysis pur-
    (for representative routes crossing the city),                       poses), and the travel speed was considered to be 50 km h−1
                                                                         for fast-traffic road segments. For regional and national stud-

Nat. Hazards Earth Syst. Sci., 20, 1421–1439, 2020                                        https://doi.org/10.5194/nhess-20-1421-2020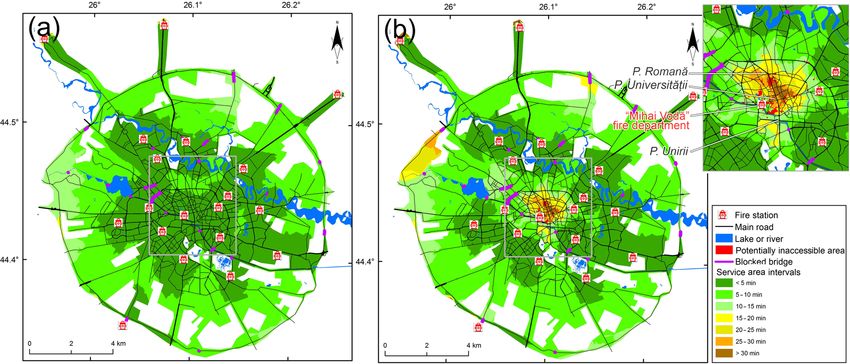
D. Toma-Danila et al.: Network-risk toolbox for estimating natural hazard implications                                          1429

ies, detailed traffic values might not be needed, since many       evaluation is more important for checking quality and in or-
highways or intercity roads (generally not crossing urban ar-      der to see the stabilization of result patterns). This is why it is
eas) do not have typical traffic jams, further impacting the       needed a further procedure for aggregating data – as is done
emergency management intervention times. For estimating            with big data. Providing data synthesis that is easier to grasp
post-event traffic patterns, we used a simplified approach,        is very important for stakeholders. For this purpose we de-
based on the following traffic modification parameters:            veloped a procedure based on the following reclassification
                                                                   and aggregation procedure.
  – for areas closer to 100 m (calculated on roads as service
    area not as buffer) – 2 km h−1 ,                                 a. Service area polygons for post-earthquake scenarios
                                                                        were reclassified according to Table 3.
  – for areas closer to 500 m – 5 km h−1 .
                                                                     b. For each service area polygon with identified number
This approach has obvious limitations and uncertainties;                of facilities providing the best and second-best inter-
however, it provides a flexible and easy-to-compute method              vention time, determination was based on Eq. (1) of a
of accounting for traffic shifts right after an earthquake, fol-        counter (C1 ), reflecting the dependency on a specific fa-
lowing the findings of Zanini et al. (2017). Modeling drivers’          cility:
individual behavior in traffic, also over time, is the next step
which we will integrate in future studies, also trying to create        C1 = Ni + 0.5 · Ns ,                                      (1)
the means for validation (recording the traffic patterns after
major earthquakes affecting Bucharest or after local incidents          where Ni is the number of facilities providing the best
in the area of vulnerable buildings).                                   intervention time, Ns is the number of facilities provid-
   In order to enable service area analysis for emergency in-           ing the second-best intervention time, and if the service
tervention, hospitals and fire stations were used as facilities.        area polygon ≥ 30 min, Ni = 0.
We identified all representative locations in Bucharest and
                                                                     c. An index was determined (Vi ) for each scenario, reflect-
nearby (not including children emergency hospitals; there-
                                                                        ing the reclassified vulnerability, applied to all poly-
fore the analysis can be considered relevant for the adult pop-
                                                                        gons, following the considerations in Table 4.
ulation). Although of high importance, we could not include
the current data regarding the capacities of each facility (for      d. A weight overlay was determined of Vi values calcu-
example, number of ambulances, hospitals’ treatment capac-              lated for emergency hospitals and fire stations, for a spe-
ity or fire engine equipment); these can be considered, re-             cific scenario, applying 25 % (0.25) for emergency hos-
flecting limitations or restrictions in the emergency interven-         pitals and emergency hospitals in category I of impor-
tion process (for example, the number of addresses that can             tance (in order to reflect the contribution of truly impor-
be reached within an amount of time due to vehicle avail-               tant hospitals in emergency situations) and 50 % (0.5)
ability, the number of people that can be transported to and            for fire stations (in Bucharest it is relevant to have an
hosted by a hospital, or whether there are vehicles with lad-           important weight for fire stations, since they do not pro-
ders, necessary for intervention in areas with high-rise build-         vide only equipment for fire extinguishing but also mo-
ings). We will address these issues in further studies when             bile services for emergency, reanimation and extrica-
more complex data become available; the ArcGIS Network                  tion, abbreviated as SMURD units), leading to a new
Analyst extension can easily accommodate such information,              final vulnerability index per scenario: Vf .
and also special evaluators can be added.
   The main analysis toward risk for Bucharest was repre-            e. Monte Carlo scenario simulations were averaged with
sented by service area analysis for emergency management                Vf values.
facilities (ambulances for emergency hospitals and fire en-          f. Resulting maps were further averaged with Vf values
gines), reflecting the times of intervention right after a ma-          (six in total for Bucharest: three for the worst-case
jor earthquake affecting Bucharest (the ultimate limit of state         model and the three traffic scenarios and three for Monte
design earthquake) at three different times for which traffic           Carl-averaged scenario results) for a final result map, re-
values are considered. Results check the capabilities to offer          vealing the combined index of vulnerable accessibility
intervention within the golden hour of medicine (Lerner and             (Fig. 7).
Moscati, 2001) – when emergency treatment is most likely to
be successful. We also analyzed the pre- and post-earthquake       By merging polygons representing areas which can become
time differences for representative economic transit routes        inaccessible after an earthquake (for each simulation) and
through closest-facility analysis. The parameters used in the      also accounting for the number of times these polygons are
analyses are described in Table 2.                                 generated, a very useful representation of areas difficult to
   The total number of service area maps resulting for all         reach can be generated. After reclassification (in our case
Monte Carlo scenarios, for service area analysis, is consider-     based on five equal intervals), a qualitative probability for
ably large and not relevant independently (the map-by-map          areas to become inaccessible can be expressed. Areas with

https://doi.org/10.5194/nhess-20-1421-2020                                Nat. Hazards Earth Syst. Sci., 20, 1421–1439, 2020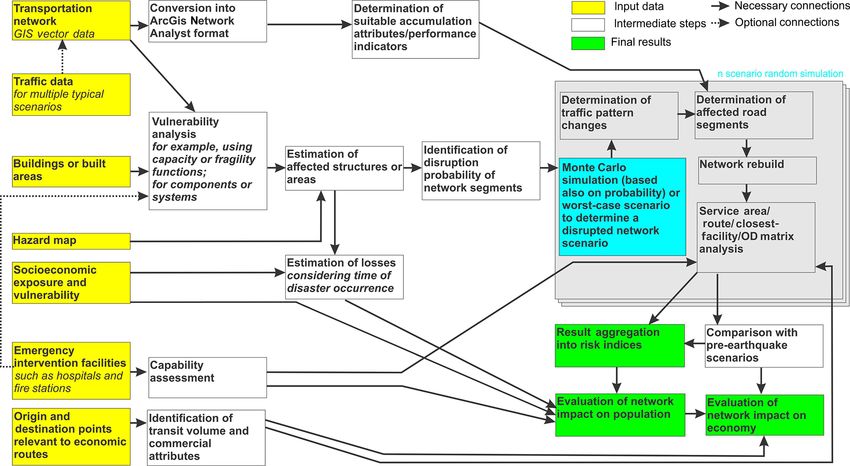
1430                                D. Toma-Danila et al.: Network-risk toolbox for estimating natural hazard implications

Table 2. Parameters used for of Bucharest post-earthquake road network risk analysis.

 Facilities             Analysis parameters                       Considered scenarios                    Number of maps resulting
 Emergency hospitals    Analysis type: service area               For three traffic scenarios             3 (pre-earthquake) + 9 (post-
                        – impedance attributes:                   (02:00, 08:00 and 18:00 LT)             earthquake – worst-case model,
                        minutes (depending on traffic scenario)   – pre- and post-earthquake,             including analysis of facilities
                        – default breaks: 5, 10 . . . 60 min      considering 20 Monte Carlo              which provide the best
                        scenarios and the worst-case              and second-best times for               intervention) + 20 (post-
                        – no one-way restrictions                 model (failure of all listed            earthquake, Monte Carlo
                        – travel from facility                    segments) for blocked roads and         scenarios) + 3 (post-
                        – restrictions: polygon barriers          bridges                                 earthquake, Monte Carlo
                        (inaccessible areas provided              For our worst-case simulations we
                        by identifying holes from                 made a custom selection of vulnerable
                        initial service area analysis             bridges based on their health
                        using the “obstruction”                   condition, year of construction
 Emergency hospitals    column as impedance attribute             and length.                             3 + 9 + 20 + 3
 in category I of       – module currently provided in the
 importance (since      Network-risk toolbox)
 they have the main
 capacity and
 responsibilities in
 the case of an
 earthquake)
 Fire stations                                                                                            3 + 9 + 20 + 3
 Origin–destination     Analysis type: closest facility           For three traffic scenarios             3 (pre-earthquake) + 3 (post-
 pairs for              – impedance: minutes                      (02:00, 08:00 and 18:00 LT)             earthquake – worst-case
 representative         (depending on traffic                     – pre- and post-earthquake              scenario)
 economic transit       scenario);                                                                        + 3 time difference tables
 routes                 – Facilities to find: the total
                        number of origins/destinations
                        (to be able to extract not just
                        the statistics as with cost
                        Matrix analysis, but also the
                        path of the route).
                        – accumulators: minutes
                        (depending on traffic
                        scenario) and meters;
                        – analysis was performed also
                        by changing initial origins
                        within destinations (to show
                        differences due to traffic ways
                        and one-way restrictions).

the lowest probability are generated just for the worst-case               The seismic risk due to road network dysfunctionalities
model, not appearing during the Monte Carlo-limited num-                can be expressed not just by considering the impact of road
ber of simulations (Fig. 8).                                            blockage and traffic on emergency intervention, leading to
   A different product which can be obtained using the net-             time limitations in reaching patients. When roads are closed,
work database and closest-facility analysis is maps show-               connectivity throughout the city can be lost for days, weeks
ing relations between emergency hospitals or fire stations              or years, with a high impact on the economy – due to delays
(as destinations) and high-risk buildings (as origins) to de-           in stock supplies and production, greater costs for fuel, or
termine the routes or best facilities in terms of safety that are       loss of clients. Our network dataset can also be used to mon-
in proximity. Useful maps or routing services which could               itor the differences between pre- and post-earthquake travel
become available in near-real time can be obtained by com-              times for representative OD pairs. For this case study we se-
bining the fastest routes for OD pairs, for a given scenario,           lected eight pairs in relevant cardinal points, some with links
showing also which roads are vital in an emergency situa-               to the city center and some aiming to show if in the case of
tion (that need to remain functional, since they are critical,          an earthquake the initially preferred route throughout the city
providing the quickest access time in the origin).                      changes in favor of the external ring road.

Nat. Hazards Earth Syst. Sci., 20, 1421–1439, 2020                                       https://doi.org/10.5194/nhess-20-1421-2020
D. Toma-Danila et al.: Network-risk toolbox for estimating natural hazard implications 1431
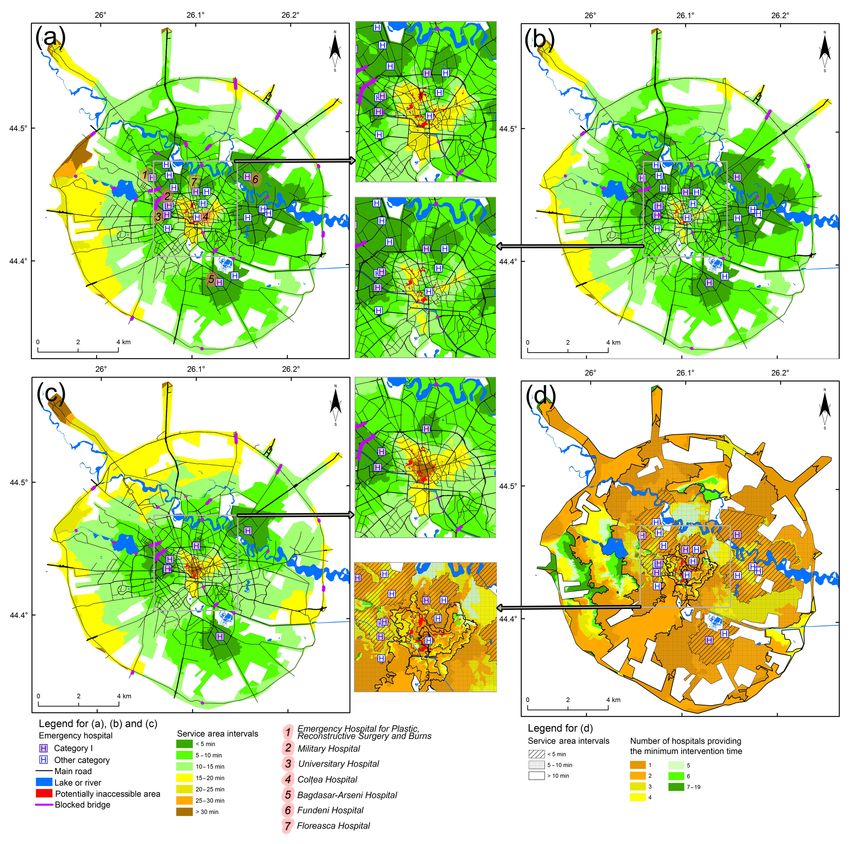
Table 3. Reclassification intervals for service area polygons. – the identification of easy-to-access locations for emer-
gency containers.
Default breaks for service areas Reclassification
values (Vr ) Figure 5a and b reflect differences between the worst-case
≤ 10 min 1 scenario (all roads and bridges with a probability of damage
affected) and results from Monte Carlo simulations. As such,
10–15 min 2 Fig. 5a presents, for some areas, slightly more increased in-
15–20 min 3 tervention time values. Figure 5c shows service area intervals
when considering only emergency hospitals in category I of
20–30 min 4
importance. It can be seen that their distribution is gener-
> 30 min, chosen to correspond ally satisfactory; however there is an area with significantly
to the golden-hour-of-medicine greater intervention times, reflected also by Fig. 5a and b, in
principle – Lerner and Moscatti 5 the southwest of Bucharest (Rahova and Ferentari neighbor-
(2001), given also the necessary hoods) – an area known also for its socioeconomic vulner-
round trip ability (Armas et al., 2016), also with no major hospital in
proximity. Due to the significant damage expected in the cen-
tral area, intervention times are expected to be considerable
Uncertainties and limitations are an important aspect to (given also the traffic values for the considered scenario).
account for. As a preliminary evaluation we provide the fol- The impact of a central hospital such as Colt, ea is reflected
lowing qualitative uncertainty evaluation: in the partial decrease in ambulance intervention times for
the city center. However, in the post-earthquake chaos, es-
– The road network dataset accuracy is a small source of
pecially if the earthquake strikes at rush hour, traffic jams
uncertainty.
are going to pose a considerable threat to road accessibility;
– The limited dataset regarding buildings which could our study reveals some of these effects (Figs. 5–9) and that
collapse during an earthquake is a moderate source of some areas could be accessed much easier by ambulances
uncertainty. from non-central locations. Bridge dysfunctionalities do not
seem to pose great influences (when comparing also with no
– Limitation in evaluating and validating the travel times damaged bridge scenarios), since in general there are many
for emergency intervention vehicles (as recently the al- nearby alternatives. The Basarab Overpass (northwest of the
lowance of using tramway-separated tracks led to im- center – labeled in Fig. 3) is the only bridge that, if inac-
proved intervention times) is a moderate source of un- cessible, could lead to a considerable increase in interven-
certainty. tion times. Figure 5d is, although difficult to comprehend at
first sight, important, since it provides a visual check upon
– The typical traffic scenarios considered are a small
the correlations between minimum intervention times and the
source of uncertainty.
number of hospitals that provide this time; if an area is green
– Post-earthquake traffic patterns are a big source of un- and is also hatched, this means that the area is close to mul-
certainty. tiple emergency hospitals, having lower vulnerability in case
of medical emergencies. Data behind this type of map add
3.3 Results additional understanding to the overall accessibility analysis,
being, however, more demanding in their creation (requiring
The figures presented in this section summarize our main service area analysis per facility and counting of the number
findings and are obtained for the multiple Monte Carlo and of overlapping polygons with a certain value).
worst-case scenario run with the Network-risk toolbox. Re- Figure 6 shows service area results for fire stations; the
sults are believed to contribute to the following: distribution of fire stations is more symmetrical in Bucharest
than the distribution of hospitals, also with a unit in the city
– operational procedures of the Inspectorates for Emer-
center (“Mihai Vodă” fire department), behind the Bucharest
gency Situations (such as the National Concept for Post-
City Hall building. For the chosen scenario (typical traffic for
Earthquake Intervention – implementation discussion
Monday at 08:00 LT), the influence of this distribution can be
ongoing),
seen south of Piat, a Unirii (Fig. 6b, zoomed-in map), where
– risk-reduction strategies elaborated at the national and also boulevards are not expected to be blocked by debris, but
local level, to the north – toward Piat, a Universităt, ii and Piat, a Romană –
post-earthquake congestion and road segment blockages are
– the planning of new emergency hospitals in Bucharest, expected to significantly increase the travel times. To help
in the effort of reducing the intervention times in the central
area, the “Victoria Palace” fire department (devoted to the
https://doi.org/10.5194/nhess-20-1421-2020 Nat. Hazards Earth Syst. Sci., 20, 1421–1439, 20201432 D. Toma-Danila et al.: Network-risk toolbox for estimating natural hazard implications Figure 5. Service areas for emergency hospitals for the typical traffic scenario on Monday at 08:00 LT and for (a) the worst-case model, (b) a Monte Carlo scenario, (c) emergency hospitals in category I of importance and the worst-case model, and (d) the number of emergency hospitals providing the minimum intervention time in the worst-case model. (Datasource: © OpenStreetMap contributors 2019. Distributed under a Creative Commons BY-SA License; data from September 2016.) Panel (a) also shows the labels of emergency hospitals in category I of importance and the Colt, ea Hospital in the city center. government’s building) could contribute; however we did not dex of vulnerable-road accessibility for Bucharest. Figure 7 find considering it in the analysis to be appropriate at the shows the first map of this kind for the entire territory of time, until learning more about its characteristics. Bucharest, reflecting some of the expected features: high vul- In order to facilitate the understanding of results also from nerability of accessibility in the central area of the city due to the point of view of non-experts, we further show the results vulnerable buildings and difficult-to-reach (in the case of an of the aggregation methodology used for creating a final in- earthquake) hospitals (especially in category I of importance) Nat. Hazards Earth Syst. Sci., 20, 1421–1439, 2020 https://doi.org/10.5194/nhess-20-1421-2020
D. Toma-Danila et al.: Network-risk toolbox for estimating natural hazard implications                                                       1433

Table 4. Formulas for calculating the index for reclassified vulnerability (Vi ); C1 intervals are relative to the facility database and study area
characteristics.

                          Formula for Vi         Conditions – depending on C1 values
                                                 if C1 >=5 for emergency hospitals and fire stations
                          Vi = Vr − 0.5
                                                 if C1 >=3 for emergency hospitals in category I of importance
                          Vi = Vr (applied       if 2
1434 D. Toma-Danila et al.: Network-risk toolbox for estimating natural hazard implications
Figure 7. Final map showing qualitative values for the combined final index of vulnerable road network accessibility (Vf ) for Bucharest.
(Datasource: © OpenStreetMap contributors 2019. Distributed under a Creative Commons BY-SA License; data from September 2016.)
Table 5. Time differences (expressed in minutes) between various OD pairs shown in Fig. 10 and for pre- and post-earthquake conditions.
Route From–to (FT) (min) To–from (TF) (min)
02:00 LT 08:00 LT 18:00 LT 02:00 LT 08:00 LT 18:00 LT
Centura-A1 → Piat, a Unirii 0 25 19 1 24 21
Piat, a Unirii → Metrou Pantelimon 0 11 14 0 8 10
Centura-Otopeni → Piat, a Universităt, ii 5 72 77 8 62 63
Piat, a Universităt, ii → Centura-Giurgiului 1 30 33 3 45 44
Centura-Chitila → Centura-Oltenit, ei 1 0 0 1 10 0
Drumul Taberei → Centura-Splai 0 4 5 0 5 4
Centura-Măgurele → Grădină Zoologică 0 18 7 0 1 9
Eroii Revolut, iei → Spitalul Fundeni 1 6 11 1 6 10
Table 5 and Fig. 10 show results for representative transportation network. This methodology was designed to
OD pairs to the economic transit routes – any other OD pairs be generally applicable and adaptive to various types of haz-
can be introduced. For the 02:00 LT traffic scenario, dif- ards, networks, or available vulnerability and exposure data.
ferences are not significant, as post-earthquake traffic is Starting from structural evaluation, the analysis focuses on
not expected to be a significant problem; however for the systemic or functional assessment, expressing furthermore
08:00 and 18:00 LT scenarios – especially for routes which the risk inflicted mainly by connectivity loss. After deter-
need to reach the city center (Piat, a Universităt, ii for exam- mining hazard, exposure and vulnerability factors – leading
ple), there are clear values showing a mean travel time in- to the definition of the network and the identification of seg-
crease from 110 %–120 % to 300 %–432 % for the Centura- ments which can become unusable (and the probability of
Otopeni → Piat, a Universităt, ii route. this to happen), Monte Carlo simulations can be performed.
This enables the creation of multiple scenarios evaluated in-
dividually in terms of generated risk (for emergency inter-
4 Conclusions vention or socioeconomic aspects) and aggregated into final
risk indices. There are also capabilities of accounting for pre-
In this paper we presented a new methodology for evaluat- and post-disaster traffic and for emergency facilities’ capac-
ing direct and indirect implications of natural hazards on the ity or equipment. In order to facilitate the use of the method-
Nat. Hazards Earth Syst. Sci., 20, 1421–1439, 2020 https://doi.org/10.5194/nhess-20-1421-2020D. Toma-Danila et al.: Network-risk toolbox for estimating natural hazard implications 1435 Figure 8. Areas that can become inaccessible immediately after an earthquake. (Datasource: © OpenStreetMap contributors 2019. Distributed under a Creative Commons BY-SA License; data from September 2016. Basemap: © ESRI and contributors.) ology we integrated it into an open toolbox (collection of evaluation of emergency intervention times (for emergency models) entitled Network-risk, which is free to download and hospitals and fire stations) and on the evaluation of economic customize. implications for representative commercial routes (time de- To prove its capabilities, Network-risk was tested on the lays in post-earthquake conditions). entire road network of Bucharest, Romania, one of Europe’s Results show that the city center would be significantly most endangered capitals due to earthquakes, considering vulnerable not just because of collapsing buildings but also the high seismic-hazard values generated by intermediate- due to the difficulty of reaching these sites by ambulances depth Vrancea earthquakes, the vulnerable building stock and firefighters; although there are facilities nearby, such as (349 high- or moderate-rise buildings are categorized as be- the Colt, ea Hospital (however not of category of importance I) longing to seismic risk class I in January 2016, represent- and the Mihai Vodă fire department, these do not provide ing just the tip of the vulnerability “iceberg”) and also major safe routes to all potentially affected buildings, due to road traffic congestion patterns. One of the most difficult parts in blockages and traffic jams, considering especially the typical the analysis was properly inputting the data collection. As traffic scenarios on Monday at 08:00 and 18:00 LT. Aggre- shown, this can be achieved (at least in a preliminary form) gated results in Figs. 7 and 8 show that also for the western, in a satisfactory form by using OpenStreetMap data along southwestern and southeastern parts of Bucharest, overall in- with a Network-risk module designed to arrange (partially tervention times can be significant – a valid supposition con- automatically) the network data into the ArcGIS network for- firmed verbally by members in the emergency intervention mat. Digitized traffic areas based on Google Traffic layers or forces. empirical formulas, literature fragility functions and expert judgment for determining road segment failure probabilities also contribute to the input. Our analysis focused both on the https://doi.org/10.5194/nhess-20-1421-2020 Nat. Hazards Earth Syst. Sci., 20, 1421–1439, 2020
You can also read