Real-time Spatio-temporal Event Detection on Geotagged Social Media
←
→
Page content transcription
If your browser does not render page correctly, please read the page content below
George et al.

                                             RESEARCH

                                         Real-time Spatio-temporal Event Detection on
                                         Geotagged Social Media
                                         Yasmeen George1,3 , Shanika Karunasekera1* , Aaron Harwood1 and Kwan Hui Lim2

                                         *
                                          Correspondence:
arXiv:2106.13121v1 [cs.SI] 23 Jun 2021

                                         karus@unimelb.edu.au
                                                                                Abstract
                                         1
                                          School of Computing and
                                         Information Systems, The               A key challenge in mining social media data streams is to identify events which
                                         University of Melbourne,
                                         Australia                              are actively discussed by a group of people in a specific local or global area. Such
                                                                                events are useful for early warning for accident, protest, election or breaking
                                         Full list of author information is
                                         available at the end of the            news. However, neither the list of events nor the resolution of both event time
                                         article                                and space is fixed or known beforehand. In this work, we propose an online
                                                                                spatio-temporal event detection system using social media that is able to detect
                                                                                events at different time and space resolutions. First, to address the challenge
                                                                                related to the unknown spatial resolution of events, a quad-tree method is
                                                                                exploited in order to split the geographical space into multiscale regions based on
                                                                                the density of social media data. Then, a statistical unsupervised approach is
                                                                                performed that involves Poisson distribution and a smoothing method for
                                                                                highlighting regions with unexpected density of social posts. Further, event
                                                                                duration is precisely estimated by merging events happening in the same region
                                                                                at consecutive time intervals. A post processing stage is introduced to filter out
                                                                                events that are spam, fake or wrong. Finally, we incorporate simple semantics by
                                                                                using social media entities to assess the integrity, and accuracy of detected
                                                                                events. The proposed method is evaluated using different social media datasets:
                                                                                Twitter and Flickr for different cities: Melbourne, London, Paris and New York.
                                                                                To verify the effectiveness of the proposed method, we compare our results with
                                                                                two baseline algorithms based on fixed split of geographical space and clustering
                                                                                method. For performance evaluation, we manually compute recall and precision.
                                                                                We also propose a new quality measure named strength index, which
                                                                                automatically measures how accurate the reported event is.

                                                                                Keywords: Online Event Detection; Quad-tree; Poisson Distribution; Social
                                                                                Networks; Geo-tagging

                                                                              1 Introduction
                                                                              With the ubiquitous nature of smart phones, Twitter and other social media ser-
                                                                              vices, are frequently used as a source of news and other information [1, 2, 3]. In
                                                                              addition, people use such social media to share news and photos about various events
                                                                              they may encounter in their daily lives, oftentimes in real-time as these events un-
                                                                              fold. Due to real-time sharing by people, social media serves as an efficient source of
                                                                              breaking news compared to traditional media, which are either slow to pick up such
                                                                              information or do not give a complete and accurate picture of the news and events.
                                                                              Due to these reasons, many researchers and organizations are relying on social me-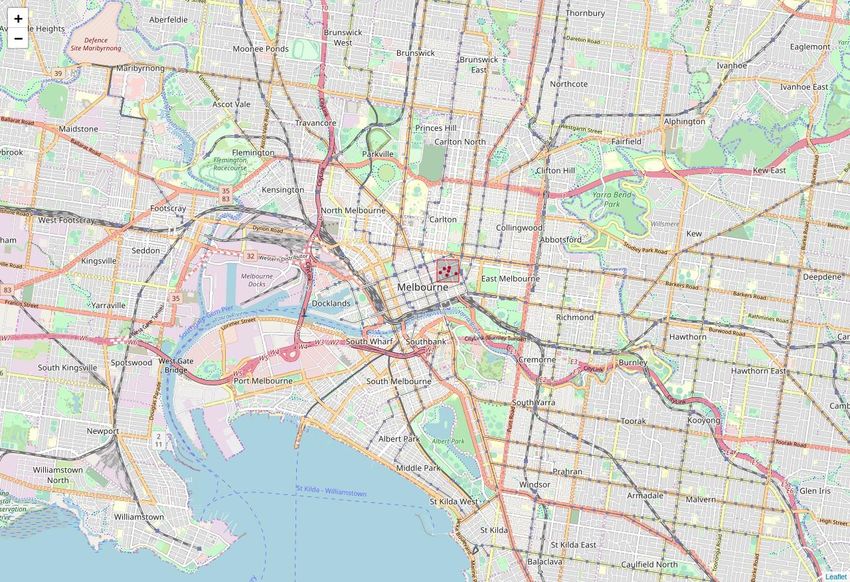
George et al.                                                                                               Page 2 of 29

                dia for obtaining timely news. One emerging use case of significant importance is
                where social media information is used for real-time event detection. For example,
                governments and organizations may be interested in events that are occurring in
                a particular geographical area, such as detecting a bush fire near residential areas,
                traffic congestion and accidents on highways, protests and other security incidents
                in the city. Being able to promptly detect such events is important as this early
                detection allows the relevant authorities and organizations to make the necessary
                responses to address these potentially adversarial events.
                The traditional approach to detect events in social streams is to track the aggre-
                gate trend changes based on the count of geotagged social media data at given
                location and time. This approach is very closely related to topic detection and
                tracking, where an event is conventionally represented by a number of keywords,
                topics or tweets showing bursts in appearance count, i.e. keywords that are men-
                tioned significantly more often during a (not too short) time period than in the
                period preceding it [4, 5]. Most of these existing approaches detect events at fixed
                spatial and temporal resolutions, e.g., grids, which do not adequately capture the
                dynamic changes in tweeting volume across different areas and time [6]. However,
                real-life events can occur at any spatial or temporal resolution, which is not known a
                priori and, therefore, algorithms that have fixed resolution result in suboptimal per-
                formance. While there are some approaches that are designed for detecting events
                at multiscale spatio-temporal resolutions [7, 8, 9], they are essentially batch-based
                algorithms which are not directly applicable in the online real-time event detection
                scenarios. While there are a few online spatial event detection algorithms proposed
                in the literature [10, 11, 12], they are fixed in terms of spatial and temporal reso-
                lution. Many of these works also utilized a supervised approach to event detection
                which may not work well for new types of events. In this paper, we aim to address
                the following problem: Given a stream of geotagged social media posts, how can we
                identify a set of posts that corresponds to a spatio-temporal event based on spatial
                and temporal proximity.
                Research Objectives and Contributions. Our main objective is to detect
                spatio-temporal events from social media, which could be any event that is be-
                ing discussed loudly (frequently) in a specific local or global area. There are various
                challenges with this type of event detection. The first challenge associated with
                event detection is that there is no consensus among researchers on the definition of
                an event. The second challenge is that the location, time and the scale of the events
                (both in time and space) are not known before hand. Furthermore, the characteris-
                tics of past events may not be indicative of future events. Finally, the event detection
                algorithms developed need to be single pass and computationally efficient as we are
                interested in detecting events in real-time from high velocity data streams.
                To address these challenges, we propose a novel approach to online spatio-temporal
                event detection that utilizes: (i) a quad-tree and Poisson model variant to dynami-
                cally identify events across different spatial scales; and (ii) a smoothing and filtering
                approach to effectively detect events with different temporal resolutions. The con-
                tribution of this paper can be summarized as follows [1] :
                  This paper is an extended version of an earlier conference version [13], with addi-
                [1]

                tional content that includes: (i) more detailed description of our proposed algorithm
George et al.                                                                                           Page 3 of 29

                   • We leverage the quad-tree data structure for multi-scale event detection, to
                     overcome the problem of detecting events with varying spatial coverage.

                   • We combine a Poisson model with a smoothing function for unsupervised
                     event detection, to enable us to detect previously unseen events with different
                     temporal resolutions.

                   • We proposed a new event validation measure, strength index (SI), which au-
                     tomatically assesses the accuracy of the detected events by using social media
                     entities.

                   • We performed quantitative and comparative evaluations, which confirm the
                     effectiveness of the proposed method in detecting new events correctly and
                     completely.

                   • We demonstrated the generalizability of the proposed method by evaluating
                     on different social media datasets, namely: Twitter and Flickr.

                Structure and Organization. This paper is structured as follows. Section 2 re-
                views related work in the area of event detection, while Section 3 introduces the
                formulation of the event detection problem. Section 4 describes our proposed al-
                gorithm for location-based event detection, and Section 6 shows the experimental
                results of our proposed algorithm against various baselines. Finally, Section 6.4.2
                summarizes and concludes this paper.

                2 Related Work
                In this section, we discuss various works that related to event detection on social
                media, ranging from general event detection works to those that focus on location-
                specific event detection.

                2.1 General Event Detection
                There are various related work that study the general problem of event detec-
                tion using social media, without an explicit focus on the spatial aspect of events.
                These works aim to detect events on social media in the form of trending events
                based on posting patterns or specific pre-determined events. For example, numer-
                ous researchers have examined the problem of identifying trending and bursty
                events [14, 15, 16], and detecting controversial events [17, 18].

                Among these works, there are many research that utilize supervised approaches for
                detecting events, such as [15] that used a Support Vector Machine for classifying
                tweets into one of the four topics of news, ongoing events, memes, and commemo-
                ratives. Others like Sakaki et al. [19, 20] also use a trained Support Vector Machine
                to first determine if tweets are earthquake-related or not, then applying Kalman
                filtering and particle filtering on tweets to estimate the centres of these detected
                earthquakes. Popescu and Pennacchiotti [17] proposed a Gradient Boosted Deci-
                sion Tree trained on textual, social and news related features to determine if a set
                with pseudo codes; (ii) additional experiments for the cities of London, Paris and
                New York; (iii) analysis of the effects of different parameter values; (iv) more in-
                depth discussion of our experiment results and findings.
George et al.                                                                                              Page 4 of 29

                of tweets are controversy related or not. These works typically require a labelled
                dataset on which social media posts is associated with a specific event type, which
                works well for those events but may be challenging to generalize to unseen or new
                types of events.

                Another group of these works utilize largely unsupervised approaches for detecting
                events, without the need for explicit labels. For example, Weng and Lee [21] utilize
                (tweet) word signals derived from wavelet analysis, which are clustered together
                using a modularity-based graph partitioning to represent detected events. In a sim-
                ilar spirit, Aggarwal and Subbian [4] proposed an online clustering approach for
                detecting events based on the textual content of social media posts, their temporal
                distribution and the interaction network among users. Many of these works utilize
                clustering techniques or similar approaches for detecting events. However, many of
                these works aim to detect events without considering the spatial aspects of these
                events. Considering the spatial aspect of event is important for applications such as
                disaster detection and crisis management.

                Similarly, there are also various web and mobile applications for tracking general
                events or retrieving tweets related to specific events [22, 23, 24, 25]. For a more
                detailed survey on general event detection, we refer readers to [26, 27, 28].

                2.2 Location-specific Event Detection
                Various approaches have also been developed for event detection in the spatial,
                textual (i.e. semantic) and temporal context, with many of these considering these
                different aspects separately [6, 29]. However, there are only limited works which
                combine spatio-temporal information for event detection. In [30], spatio-temporal
                events are detected by clustering the geotagged tweets, followed by topic modelling
                using the summarized words in each estimated cluster. Similarly, [24, 31] adopted
                an approach of identifying topics associated with specific locations by applying
                Latent Dirichlet allocation on tweets posted in the same locality. Others like [32]
                combine clustering techniques with embeddings of tweet location, time, and text for
                event detection. Although Twitter enables users to post tweets with their current
                locations (longitude and latitude), only an average rate of 0.85–3% tweets being
                geotagged per day, around 7,000,000 geotagged tweets are posted per day [33]. This
                characteristic where only a small proportion of the tweets are geotagged severely
                restricts the accuracy of spatial-based event detection approaches.

                Another key challenge in this research area is regarding the method by which the
                geographical area is partitioned for subsequent event detection. A typical approach
                is to utilize a uniform-grid approach, which applies an equal-width grid of a specific
                size over the data domain. However, this approach does not solve the problem for
                various reasons. First, a good method for choosing the grid size is required, which
                has not been adequately covered in the literature [34]. Second, fixed grid cells might
                not help in finding both local and global events. For example, using a low resolution
                grid for spatial data might capture only the global events occurring on the state or
                the country level, while a high resolution grid will detect the events on smaller scales
                (local events), i.e. within the community or the city where the grid cell ranges from
                1km-50km. Another solution is to manually select a set of points of interests (POIs),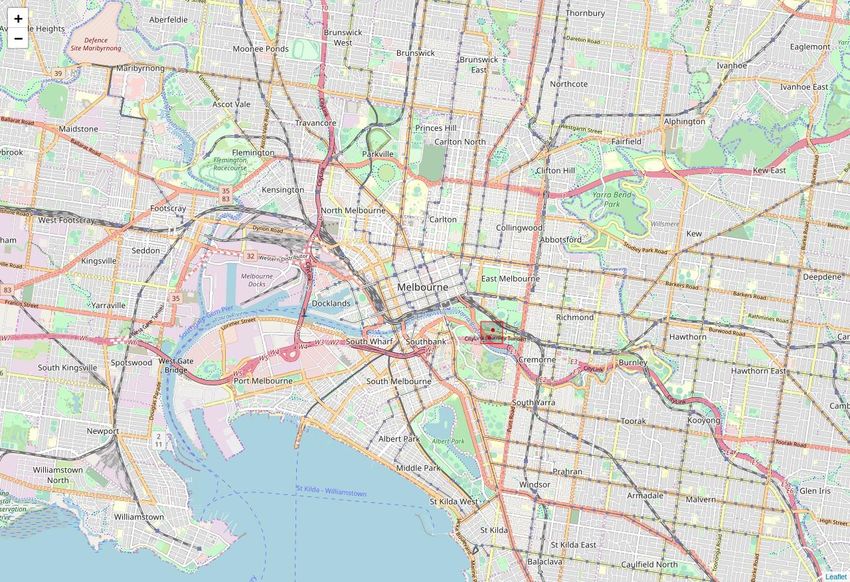
George et al.                                                                                           Page 5 of 29

                Table 1 High level notation

                     px   A social media post px
                     tx   Timestamp of post px
                     lx   Location of post px
                     fx   Features of post px
                     S    A data stream of posts as a set, S = {p1 , p2 , . . . , pn }
                     W    A window (e.g. of size m), W = {pn−m+1 , . . . , pn } ⊂ S
                     E    A set of posts E ⊆ W that represents a spatio-temporal event

                where each POI is a fixed size grid cell. Following this approach, we can control the
                number of POIs based on tweets distribution density. For instance, areas in city
                centre might have many POIs with small grid cells, while areas far from the city
                might have few POIs with large grid size. But, having fixed POIs limits the location
                of detected events to the chosen POIs only. In addition, the manually selected POIs
                has to be done for each geographical area of analysis.

                2.3 Differences with Earlier Works
                Our proposed method differs from these earlier works in the following ways. The
                existing works on general event detection aims to detect general events that are dis-
                cussed on social media without identifying the locality of these events. In contrast,
                our proposed method aims to detect location-specific events, which are localized
                events happening within a specific area. Furthermore, the supervised approaches
                to general event detection requires implicitly labelled events that may not general-
                ized well to unseen or new events, whereas our work do not require explicit event
                labels.

                3 Problem Statement
                In this section, we first introduce some basic notation and definitions used in
                our work, before formally defining the problem of spatio-temporal event detec-
                tion.

                3.1 Preliminaries
                Table 1 summarizes the key notations used in our work, which we elaborate
                next.

                Definition 1 (Social Media Post): In our work, we aim to utilize geo-tagged
                social media as an input to our location-based event detection algorithm. As such,
                each social media post p ∈ S forms the basic component of our algorithm. We
                represent each social media post as p = ht, l, f i, where each social media post p
                is associated with a timestamp t, location l and features f . The timestamp t and
                location l are straightforward representations of date/time and latitude/longitude
                coordinates but can be easily modified to other representations, e.g., unix timestamp
                and landmarks, instead of date/time and latitude/longitude coordinates. On the
                other hand, features f can represent multiple aspects of different types of social
                media, e.g., text in a tweet, user tags for a photo, etc.

                Definition 2 (Data Stream): Building upon Definition 1 (Social Media Post), we
                now have multiple social media posts arriving in a real-time data stream. Let S =
George et al.                                                                                                  Page 6 of 29

                {p1 , p2 , . . . , pn } denote the first n posts from the data stream, ordered temporally
                such that for pi and pj where i < j, ti ≤ tj . Thus, data stream S represents a series
                of social media posts ordered in the sequence they arrived in.

                Definition 3 (Current/Query Window): In the context of a Data Stream S =
                {p1 , p2 , . . . , pn }, we define a current/query window W = {pn−m+1 , . . . , pn−1 , pn },
                where W ⊆ S. This current/query window represents the current set of social media
                posts from post pn−m+1 to post pn . For generalizability and flexibility, the window
                size can be based on either a fixed number of posts, m > 0, or a fixed duration
                between posts pn−m+1 and post pn , i.e. tn − tn−m+1 . This current/query window
                allows a user to decide on the temporal resolution in which he/she wants to be able
                to detect an event.

                3.2 Formal Problem Definition
                The focus of our work is to develop an algorithm for detecting spatio-temporal
                events from streaming social media, based on a provided set of current social media
                posts, i.e., the query/current window. We define a spatio-temporal event as a set
                of social media posts that represents an increase in activity across a period of time
                within the same locality, based on the current/query window.

                Given a data stream of social media posts S = {p1 , p2 , . . . , pn } and a query window
                W = {pn−m+1 , pn−m+2 , . . . , pn } that represents currently observed social media
                posts, we want to identify a set of posts E ∈ W with the following goals:

                   • Spatial Proximity, e.g.
                                                 P P
                                                         dist(lx , ly ) should be significantly smaller
                                                 px ∈E py ∈E
                     than that for the same number of posts drawn uniformly at random from
                     W.

                   • Temporal Proximity, e.g.
                                              P
                                                 (ty −tx ) (for consecutive px and py ), should be
                                                  px ,py ∈E
                      significantly smaller than that for the same number of posts drawn uniformly
                      at random from W.

                   • Significance, |E| should be as large as possible while maintaining Spatial and
                     Temporal Proximity goals.

                Here dist(lx , ly ) is the geographical distance between posts px and py , while (tx −ty )
                is the time difference between consecutive posts px and py . In short, we are selecting
                a subset of social media posts that are representative of a spatio-temporal event,
                based on their spatial and temporal proximity.

                4 Proposed Algorithm
                In our work, we address spatial proximity by considering windows that are defined
                in terms of a region, and we address temporal proximity by considering a sliding
                window and assessing the change in the number of posts in a given region for two
                consecutive windows. Formally, we consider a number of sliding windows, Wi (Γj ),
                identified by an unbounded slide sequence number i = 1, 2, . . . and finite set of
                                                       S
                regions Γj , j = 1, 2, . . . , γ, where Γj = Γ. All of our sliding windows have a time
                duration of T and slide increment ∆T , with the head of the window being Ti , i.e.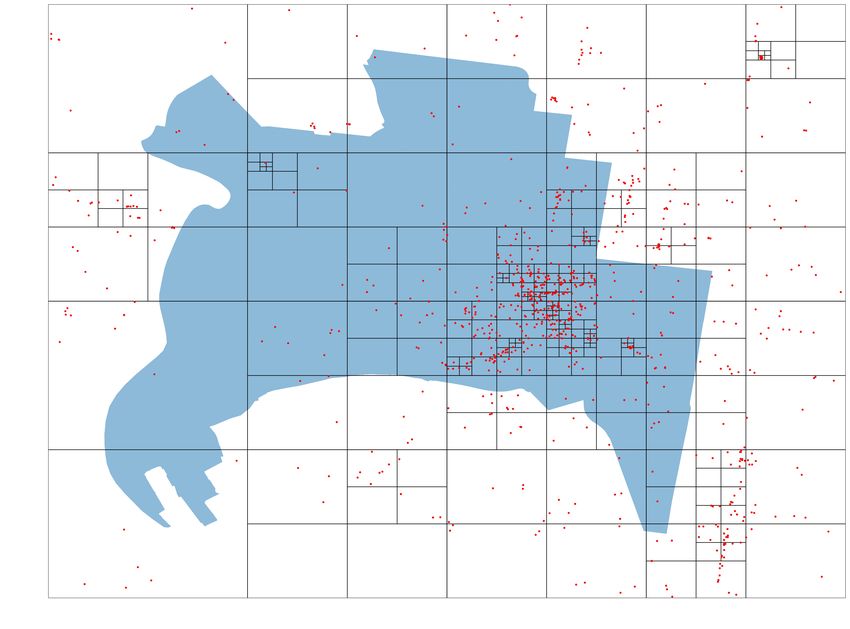
George et al.                                                                                                              Page 7 of 29

                every sliding window i covers time interval [Ti −T, Ti ). In this way, we define

                      Wi (Γj ) = Wij = {px | Ti − T ≤ tx < Ti , lx ∈ Γj , px ∈ S} .                                  (1)

                Each region serves as a spatial proximity bound for the posts that it contains, in
                the sense that we can consider the posts being within a given region as satisfying
                the spatial proximity goal from the problem definition. There are many ways that
                regions can be selected, e.g. they could be a uniform mesh based partition of the
                space, or each region could be associated with a POI in the space (e.g. a region
                around a park or building), etc. In our work, we consider a multi-scale region se-
                lection approach based on a quad-tree division of space; in this case regions are
                overlapping with some regions subsuming others. In previous work, we have also
                considered the POI region selection approach and we make comparisons between
                them in this paper.

                                Phase 0: Retrieve
                               Geo-tagged Tweets                             Phase 1: Build Quad-tree

                                                          Phase 2: Detect Events
                      Event detected on
                        Day 8 @ Area 1                       Current
                                                             Window                    Current   Event detected on
                                                                                       Window
                                               Previous                                          Day 21 @ Area 2
                                               Window                       Previous
                                                                            Window

                             Phase 3: Merge Events                              Phase 4: Prune Events
                    Events
                    merged                                                                                  Event
                                                                                                            pruned

                                                                        Event
                                                             Events    pruned
                                                             merged

                 Figure 1 Overview of our proposed Spatio-temporal Online Event Detection Algorithm.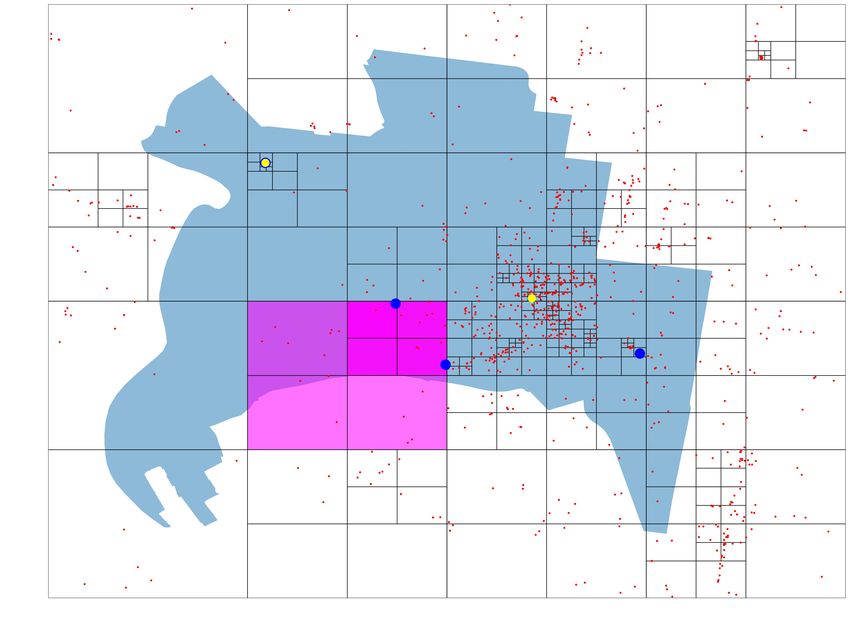
George et al.                                                                                               Page 8 of 29

                Table 2 Additional notation
                                                   S
                    Γj        region j where Γ = Γj contains all posts in S
                    Wij       the set of posts in the sliding window at interval i for region j
                    Cij       number of posts in the window slide increment interval i for region j
                    λij       estimate rate of posts at interval i for region j
                    Pij       Poisson signal at interval i for region j
                    τ1        Poisson signal threshold
                    Fij       event signal at interval i for region j
                    τ2        event detection threshold
                     α        event signal decay parameter
                  θduration   event duration threshold
                   θentity    minimum entities threshold
                    θarea     quad-tree node region area threshold
                   θcount     quad-tree node post count threshold

                In order to assess the change in the number of posts from one window to the next,
                we assume that the number of posts arriving in a given time interval has a Poisson
                distribution, and we thereby assign an estimate ∆T -arrival rate of posts for each
                region based on its sliding window:

                               |Wij |∆T
                      λij =             ,                                                             (2)
                                  T

                where |x| is the cardinality of set x. Finally, as the basis for event detection in each
                region, for each window Wij , we consider the observed number of posts in the slide
                increment interval [Ti , Ti + ∆T ),

                      Cij =         px | Ti ≤ tx < Ti + ∆T, lx ∈ Γj , px ∈ S ,

                and make use of the Poisson p.m.f.:

                                               λCij
                      P Cij ; λij = Pij = eλij

                                                     .                                                (3)
                                               Cij !

                If Pij is significantly low (below a threshold) then we consider the possibility that
                region j has exhibited an event and we consider the posts within the slide increment
                to potentially be comprising that event. The details of our approach, called Spatio-
                temporal Online Event Detection Algorithm (Algorithm 1), includes more aspects
                that are explained next, such as: (1) building a multiscale spatial resolution grid
                using the quad-tree method, (2) event detection using the Poisson model and sig-
                nal smoothing, (3) event merging and (4) event pruning. Generally, our algorithm
                maintains an unbounded set of detected events E found in the unbounded stream
                S. Figure 1 provides an overview of our algorithm and the detailed explanation for
                each phase is provided in the following subsections. As well, Table 2 provides an
                overview of the notation used in the algorithm.

                4.1 Phase 1: Build Quad-tree
                In this phase, we use the quad-tree method for spatial decomposition [35, 36].
                This method has been used in a variety of applications including image process-
                ing, computer graphics, geographic information systems and robotics [37, 38]. We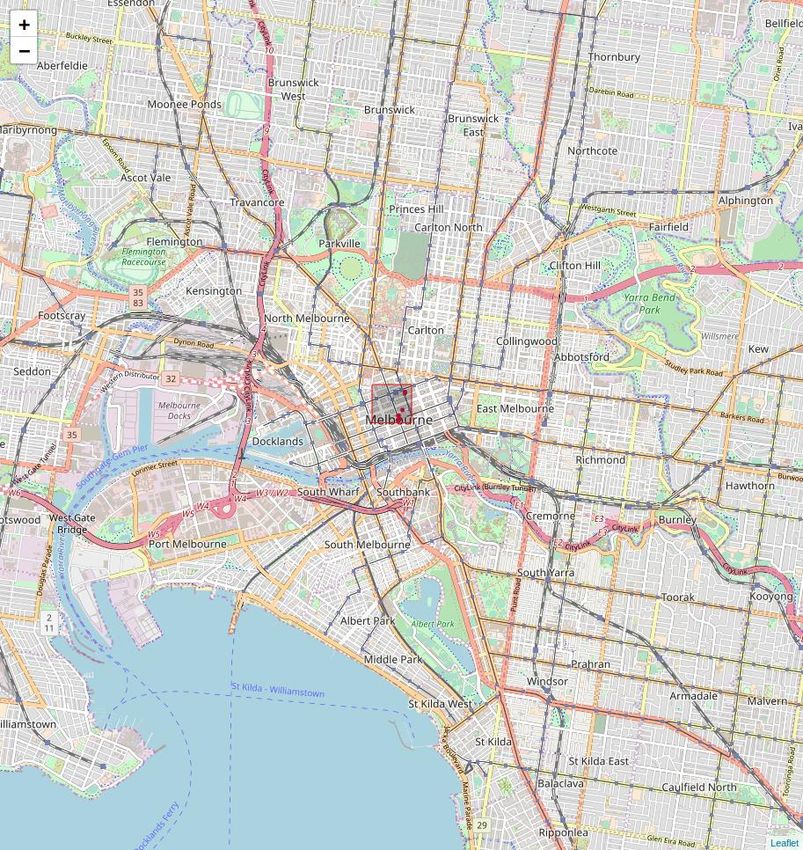
George et al.                                                                                                                             Page 9 of 29

                Algorithm 1 Spatio-temporal Online Event Detection Algorithm
                1:   Global constants (inputs): Γ,T ,∆T ,θarea ,θcount ,τ1 ,τ2 ,α,θduration ,θentity
                2:   Output: E
                3:   Initialise: i ← 1, E ← []
                4:   Repeat:
                5:       qT ree ← quadTree(i,Γ1 = Γ)                                                      . Phase 1: Build quad-tree
                6:       Ei ← eventDetection(i,qT ree)                                                      . Phase 2: Detect events
                7:       E ← eventMerge(E,Ei )                                                              . Phase 3: Merge events
                8:       E ← eventPrune(E)                                                                   . Phase 4: Prune events
                9:       i←i+1
                Phase 1: Build Quad-tree
                10: function quadTree(i,Γx )
                11:    N ← {(λix , Cix )}                                                  . This node is synonomous with region x
                12:    if |Wix | > θcount and
                                            n area of Γx ≥ θareaothen
                13:        Subdivide Γx into Γx1 , Γx2 , Γx3 , Γx4
                14:        N ← N ∪ quadTree(i,Γx1 )
                15:        N ← N ∪ quadTree(i,Γx2 )
                16:        N ← N ∪ quadTree(i,Γx3 )
                17:        N ← N ∪ quadTree(i,Γx4 )
                18:    return N
                19: end function
                Phase 2: Event Detection
                20: function eventDetection(i,qT ree)
                21:    E ← {}
                22:    for node (Cix , λix ) in qT ree do
                23:        Compute Pix using Eq. 3
                24:        Compute Fix using Eq. 4
                25:        if Fix ≥ τ2 then
                26:            e ← (Γix , Ti , Ti + ∆T, ∆T, Wix , Pix )
                27:                                                                         . region, start, end, period, posts, signal
                28:            E ← E ∪ {e}
                29:    return E
                30: end function
                Phase 3: Merge Events
                31: function eventMerge(E, Ei )
                32:    for event e = (rg, st, en, pe, po, si) ∈ Ei do
                33:        if e0 = (rg 0   0     0   0    0    0              0
                                      , st , en , pe , po , si ) ∈ E where rg = rg and
                                                                                            0
                                                                                         en = st then
                                                                                      0
                34:            e0 ← rg 0 , st0 , en0 + ∆T, pe0 + ∆T, po ∪ po0 , si+si
                                                                                  2
                35:                                                                             . Updates the existing event in E
                36:        else
                37:            E ← E ∪ {e}
                38:    return E
                39: end function
                Phase 4: Prune Events
                40: function eventPrune(E)
                41:    for event e = (rg, st, en, pe, po, si) ∈ E do
                42:        if pe < θduration then
                43:            E ← E/{e}                                                . The duration of the event is insufficient
                44:            Continue
                                0       0  0    0     0    0   0          0        0
                45:        if ∃e = (rg , st , en , pe , po , si ) ∈ E | si < si, rg ∩ rg 6= ∅ then
                46:            E ← E/{e}                                             . The event is subsumed by a stronger event
                47:            Continue
                48:        if |uniqueEntities(e)| < θentity then
                49:            E ← E/{e}                                               . The event is not semantically consistent
                50:            Continue
                51:    return E
                52: end function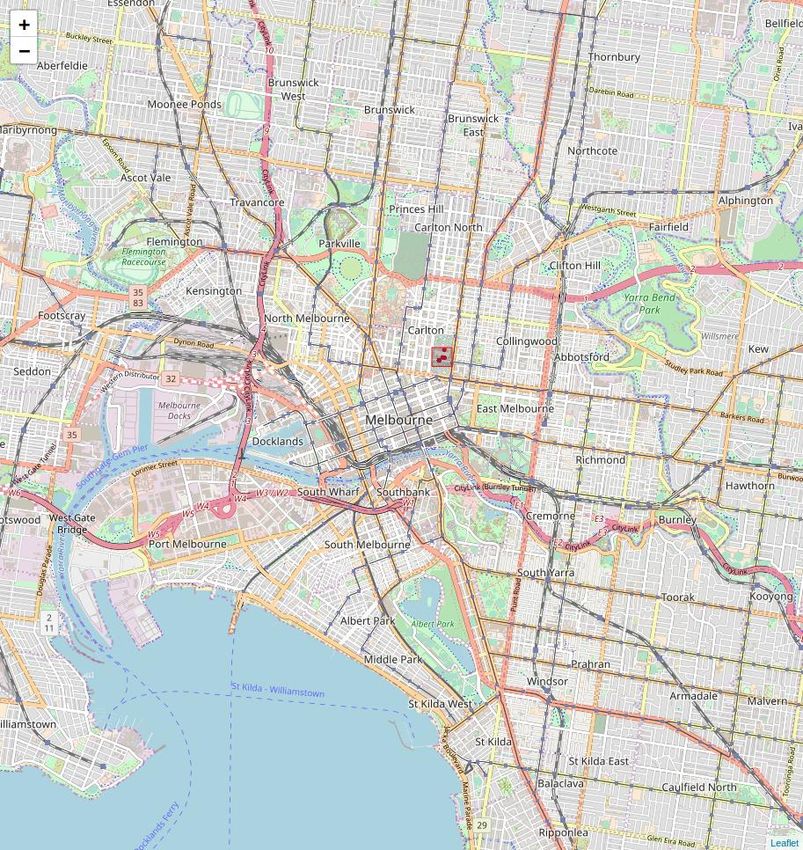
George et al. Page 10 of 29
construct a quad-tree at each time interval i. The quad-tree in two dimensional
space starts with a large rectangular region, in our work Γ1 = Γ, which represents
the root of the quad-tree. The root region Γ1 is subdivided into four equal sized
regions {Γ11 , Γ12 , Γ13 , Γ14 } and each subregion is recursively subdivided, i.e. cre-
ating {Γ111 , Γ112 , . . . }, and so on. Subdivision of a region x only occurs if both
|Wix | > θcount posts and the area of region x is at least θarea . These constraints
limit the minimum spatial resolution. As the quad-tree is constructed we also com-
pute λij and Cij for each node, including internal nodes; here node is synonymous
with region in that region j is node j.
4.2 Phase 2: Event Detection
For a sliding window interval i and all regions j (including those at internal nodes
of the quad-tree), we use the Poisson distribution [39, 40, 41] to measure how likely
the observed number of posts, Cij , is for the slide increment ∆T that immediately
follows the sliding window. The estimate arrival rate of posts is computed as in
Eq. 2 and the probability, Pij , of observing Cij posts in time ∆T is computed as in
Eq. 3. The more unlikely the observation, which may result from a significantly large
increase or decrease in posts from the mean, the more we consider the posts (or lack
thereof) to comprise an event. Therefore regions with Pij < τ1 , a constant threshold,
could be flagged as potential regions for events. To compensate for sparse and/or
incomplete data, where the stream of posts may not have a significantly strong
representation of social media posts, we “smooth” the Poisson signal by computing
an exponential decaying average event signal, Fij :
τ1 −Pij , if P < τ
τ1 ij 1
δij =
0, otherwise (4)
Fij = αFi−1,j + (1 − α)δij
where δij is the scaled Poisson signal, Fij and Fi−1,j are the event signal values for
node (region) j at the i and i − 1 intervals respectively, and 0 ≤ α ≤ 1 is a constant
decay parameter. Finally, if Fij ≥ τ2 , an event detection threshold, we flag the
posts, or more specifically the interval and region, as comprising an event.
4.3 Phase 3: Merge Events
Each event found in the previous Event Detection phase has a different spatial
resolution and a fixed temporal scale (∆T ). In this phase, we construct events with
multiscale temporal resolution using a merging method. Events at the same region
that occur at consecutive time intervals are merged. This gives an estimate for
the period of time during in which an event is highlighted rather than assuming a
predefined fixed duration (∆T ). For instance, if two events e1 and e2 occur in the
same region at time intervals i and i + 1 in order, then both events are combined
to one event with period of 2∆T . When merging we combine the posts and average
the signal strength for the merged event.
4.4 Phase 4: Prune Events
To further increase the precision of our event detection and to handle spatio-
temporal events that occur over a changing resolution we prune events after mergingGeorge et al. Page 11 of 29
them. First, we only select events with duration ≥ θduration to be included in the
final set of detected events. The idea is that the longer the event duration, the more
reliable and accurate it is. In other words, regions/nodes which are flagged for short
periods are most likely to be noise (i.e. false positives). Second, the fact that we
compute the signal for all quad-tree nodes (i.e. both internal and leaf nodes), leads
to the propagation of some flagged events over the different tree levels (i.e. multi
spatial resolution). So if an event is detected at the same time on different tree lev-
els, we only keep the node with the strongest signal. In other words, if overlapping
tree nodes (i.e. parent, child, grand child, and so on) are flagged as events from time
t1 to t2 , then we select the node (i.e. region) with the strongest signal to be the
spatial resolution of the final detected event. This gives us a set of unique events
which happened at different spatial and temporal resolutions. Third, we utilize the
entities in the social media posts to detect and eliminate spam or fake events. We
extract the set of unique entities (which may be keywords, mentions, hashtags, etc.,
depending on the type of social media post) across the posts in the event. If the
size of the set is less than θentity then we remove the event.
5 Experimental Design
In this section, we describe our datasets and give an overview of the evaluation
metrics and baseline algorithm used in our experimental methodology.
5.1 Dataset and Data Collection
To demonstrate the generalizability of our proposed algorithm, we perform our
experimental evaluation on two datasets based on Twitter and Flickr.
For our Twitter dataset, we performed a two-stage collection of tweets, similar
to [42]. We first used the Twitter REST API to retrieve all geo-tagged tweets posted
by users in Melbourne in 2017. As we focus on geo-tagged tweets, this collection
process resulted in 203, 519 geotagged tweets by 22, 264 different users.
For our Flickr dataset, we focused on geo-tagged photos posted in four large
cities, namely Melbourne, London, New York and Paris. These geo-tagged pho-
tos were extracted from the Yahoo! Flickr 100M Creative Commons (YFCC100M)
dataset [43, 44]. The YFCC100M dataset comprises 100M geo-tagged photos and
videos along with their meta-data such as latitude/longitude coordinates, date/time
taken, photo name, user description, assigned tags, etc.
5.2 Evaluation Methodology
In our experiments, we evaluate the various algorithms using the standard metrics
of precision and recall, and our proposed metric of strength index. Precision and
recall are defined based on the common definitions of true and false positives and
true and false negatives, commonly used in confusion matrix. In the context of our
study, they are defined as:
• True Positive (tp): Detecting an event when the event has occurred in real-life.
• False Positive (f p): Detecting an event when the event did not occur in real-
life.George et al. Page 12 of 29
• True Negative (tn): Not detecting an event when the event did not occur in
real-life.
• False Negative (f n): Not detecting an event when the event has occurred in
real-life.
5.2.1 Precision
We use precision to measure the ratio of correctly detected events (true positives)
to the total detected events, by using the formula in Eq. 5.
tp
Precision = (5)
tp + f p
where tp and f p are true and false positives respectively.
The absence of ground truth labels makes the task of computing precision very
challenging. As it is impractical to manually label the overly large number of events
in the dataset, we propose a semi-automated assessment methodology using Google
search results where each event is assigned 1 if it is a true event, 0 otherwise. To do
so, we first query Google using the top k entities as well as the date-time of each
detected event. We use Google query results to decide whether an event is True
or False, with 1 and 0 referring to true and false event, respectively. If we do not
get any useful information about the event from Google, then we manually look at
the posts of the event to decide if it is a personal/private event, spam or wrong
event.
5.2.2 Recall
Recall is also calculated using Eq. 6, which reflects the ability of the model to find
all actual events within a dataset. In the context of event detection, recall measures
the percentage of detected events with respect to important events/news appearing
on a real-world news headlines.
tp
Recall = (6)
tp + f n
where tp and f n are true positives and false negatives respectively.
Similar to precision, we perform a manual assessment for recall due to the absence
of ground truth events. This is done by using Google search engine to select the
most common events appearing on the news headlines for the days corresponding
to the analysis. This includes festivals, public holiday events and international per-
formances occurring in the area of analysis. Each event is represented by a list of
entities, which are used to manually decide whether an event is detected by our
method or not.George et al. Page 13 of 29
Table 3 Parameters used in the proposed method
Method Parameter = Value
θcount = 20
Quad-tree θarea = 0.001 sqkm
T = 3 days
∆T = 10 minutes
Poisson model signal threshold τ1 =0.01
event detection threshold τ2 =0.4
event signal decay coefficient α = 0.5
duration threshold θduration = 50 minutes
Event filtering
minimum top entities θentity = 2
5.2.3 Strength Index (SI)
To examine if the posts assigned to an event e = (region, start, end, period,
posts, signal) are relevant or not, we introduce a metric, which we refer to as the
event strength index (SI). SI is the fraction of the retrieved top entities to the
total count of event posts. We use SI as an indicator of how important/precise a
reported event is. For an event e with total number of posts C = |posts| and χi
being the i-th most frequent entity (could be hashtags and mentions for twitter or
image tags and description for Flickr), we calculate SI using the following formula:
Pk
i=1 Cχi
Strength Index (SI) = , (7)
C
for constant k > 0, where Cχi is the number of posts that contain χi . SI ranges
from 0 to k, where k is the number of top entities. We obtain a small value for SI
(
1), when the top entities do not match the context of the detected event or if
they are relevant but with a small number of occurrences. For example, a value of
0 for SI means that all posts for an event e are irrelevant, while a value of k means
that all event posts contain at least one occurrence of each top entity.
5.3 Baseline Algorithm
To show the effectiveness of the proposed method, we compare it with two baseline
event detection algorithms. The first baseline is based on POIs and the second
one uses clustering approach for real-time event detection. More details about each
baseline are provided in the following sections.
5.3.1 Location-based Event Detection using Points of Interests (POIs)
POIs have been frequently used in location-based recommendation [45, 46, 47] and
various types of event detection techniques based on POIs [48]. Building upon these
works, we develop a baseline using the similar idea of tagging geo-tagged social
media to POIs. Similar to these earlier works, we obtain a list of known and pop-
ular POIs for each city from their respective Wikipedia entries. In this baseline
algorithm, we utilize a spatial representation of tweets based on their proximity
(George et al. Page 14 of 29
Table 4 Parameter selection: Poisson signal threshold (τ1 )
τ1 value 0.01 0.005 0.0025 0.0013 0.0006 0.0003 0.0001
Phase Poisson signal
Signal thresholding 6846 4821 3546 2458 1884 1557 1288
Merging adjacent ∆T events 6144 3882 2748 1763 1268 992 761
Event duration D ≥ θduration 40 27 16 11 7 3 2
Filtering propagated events 21 17 11 8 5 1 1
Spam filtering 16 11 8 6 5 1 1
Phase Smoothing signal
Signal thresholding 3332 2462 1931 1573 1315 1060 927
Merging adjacent ∆T events 2292 1604 1188 923 726 519 424
Event duration D ≥ θduration 51 29 16 8 6 3 2
Filtering propagated events 29 22 11 6 5 2 1
Spam filtering 23 15 8 4 4 2 1
5.3.2 Incremental Clustering for Real-time Event Detection
Among the existing event detection techniques and algorithms discussed in the in-
troduction, we select the clustering based event detection approach proposed in [10]
for comparison with our approach. The reason is that it is very closely related to our
introduced problem. The approach detects significant clusters that are sufficiently
dense and large in streams of spatial events, with the advantage of tracking cluster
evolution over time.
Given a list of active data points (i.e. spatial events) that occur in the interval
[tc − ∆T, tc ], where tc is the current time and ∆T is a maximal temporal gap, the
algorithm finds the set of significant clusters by repeatedly extracting a set of event
circles and unions every time tick t. In which, an event circle C is a group of active
events that fits in a circle with maximal radius R. While a union is a set of event
circles that have at least K-overlapped events (i.e. K-connecting events). Following
this, the algorithm finds all significant clusters, where a significant event cluster
is a union that includes at least N spatial events, i.e. minimal cluster size. The
values for parameters t, ∆T , R, K, and N are user-specified. More details about
the algorithm can be found in [10].
6 Results
In this section, we evaluate the proposed method in four different aspects. Firstly, we
present a preliminary analysis of the proposed method (Section 6.1). Secondly, we
present a detailed comparative analysis with the baseline algorithm (Section 6.4.1).
Thirdly, using the tweets over a period of one-year we evaluate our algorithm based
on the precision, recall and strength index as statistical metrics (6.2). Finally, we
show a case study of event detection using Flickr image dataset (Section 6.3).
6.1 Preliminary Analysis
In this section, we use a subset of the collected tweets to evaluate the individ-
ual phases of the proposed method. We extract January-2017 Melbourne tweets
which contains 23,327 geotagged tweets for 5,427 users. First, quad-tree is used to
construct multiscale spatial grid. Then, events are detected using Poisson model.George et al. Page 15 of 29
Table 5 Sample detected events for different Poisson signal thresholds
Event time C Area Top hashtag/mentions
Events using smoothing method with τ1 = 0.00125
-S 01-18 10:10 -D 50 27 6.969 #funk, @choiproductions, #nofilterwtf,
@jeffreymayfield, #saxophone
-S 01-21 07:50 -D 70 20 0.435 #gostars, @mcg, #mcg, #bbl06, #mel-
bourne
-S 01-22 02:10 -D 70 18 0.109 #50th
-S 01-22 08:20 -D 60 15 0.109
-S 01-29 12:10 -D 60 72 1.741 #ausopen, #australianopen, #federer,
#rogerfederer, #champion
-S 01-29 12:10 -D 70 73 0.109 #ausopen, #australianopen, #federer,
#champion, #rogerfederer
Events using smoothing method with τ1 = 0.000625
-S 01-21 08:10 -D 50 14 0.435 #gostars, #mcg, @mcg, #bbl06, #mel-
bourne
-S 01-29 12:10 -D 70 73 0.109 #ausopen, #australianopen, #federer,
#champion, #rogerfederer
Events using Poisson signal with τ1 = 0.0003125
-S 01-29 12:10 -D 50 61 0.109 #ausopen, #australianopen, #federer,
#rogerfederer, #18
(a) (b) (c)
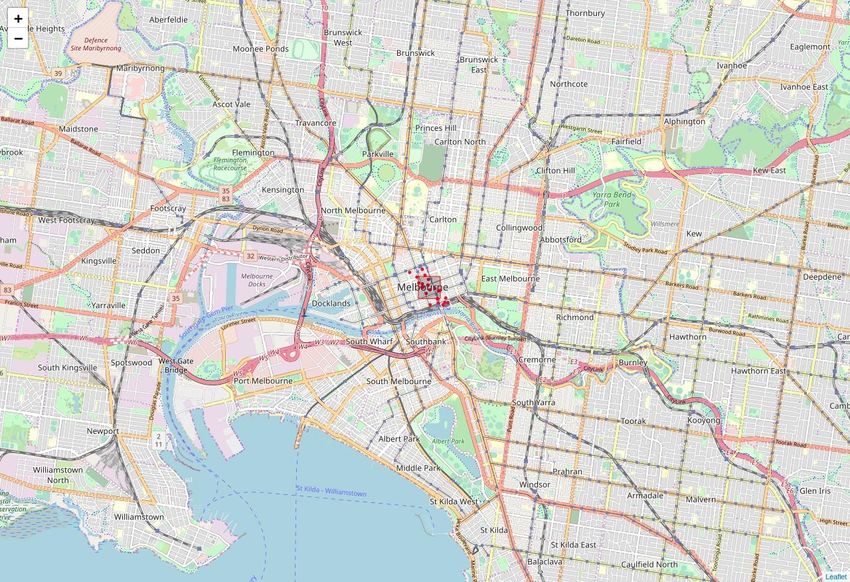
Figure 2 Event detection results at time-stamp t = 2017 − 01 − 15 7pm: (a) Constructed
quad-tree using tweets in the interval [t − T : t) where T = 3-days, (b) Flagged events with
Poisson signal, and (c) Distribution of Poisson signals for all nodes.
Following this, a smoothing function is applied for accurate estimation of event
duration. Finally, a false positives removal phase is performed to eliminate both
falsely highlighted events and spam events. Table 3 presents the different parame-
ters used in the proposed method. The parameters are chosen after several experi-
ments, to achieve the best performance. Figure 2 shows an example of the quad-tree
results.
The Poisson signal threshold τ1 has a strong impact on the results of our proposed
method, and so we explored this parameter and show in Table 4 the number of events
detected for variable values for τ1 at different phases. Combined with Table 5, it
is clear that reducing τ1 reduces the total number of detected events while keeping
the strongest events. For our case studies, we chose τ1 = 0.01 so we can get reliable
estimation of events in terms of both precision and recall.George et al. Page 16 of 29
Table 6 Event detection results for Flickr and Twitter
Case Study Twitter Flickr
City Melbourne Melbourne London New York Paris
Month-Year 2017 Jan-2013 Jan-2012 Jan-2013 Jan-2013
Number of users 22264 90 500 510 200
Number of posts: 203519 995 6691 6180 2778
Total 10-min intervals & nodes 15253260 230468 1283452 1294544 641228
Total flagged nodes 29520 726 4791 4757 1871
Merging adjacent nodes 25108 165 2706 2641 795
Duration filtering 299 19 140 145 49
Filtering propagated events 158 7 67 62 22
Filtering spam events 137 7 67 56 22
6.2 Case Study: Twitter Dataset
To evaluate the performance and reliability of the proposed method, we experiment
with the whole dataset for Melbourne in 2017. Figure 3 visualises some of the
detected events on the map. Each event has the start and end time, total tweets,
area and the top 5 hashtags/mentions. We use the top hashtags/mentions along
with the event time to manually evaluate the correctness of the event. Table 6,
column ”Twitter” shows the total number of flagged events after each phase of
the proposed method. In total, we detect 137 events after the removal of all false
positives.
Start: 01-28 End: 01-28 Start: 02-27 End: 02-27 Start: 03-10 End: 03-10 Start: 04-23 End: 04-23
09:40 10:40 00:00 01:00 13:50 14:40 06:00 06:50
Tweets count: Area (sqkm): Tweets count: Area (sqkm): Tweets count: Area (sqkm): Tweets count: Area (sqkm):
35 0.44 17 0.028 13 0.002 10 0.028
Top 5: #nickcave: Top 5: #greekandthe- Top 5: #purposetour: Top 5: #tvweeklogies:
17.1% city: 82.4% 46.2% 50 %
#australian- @serenawilli- #lovelonsdale: #kkfuntimes: #justinbieber: #melbourne: #redcarpet: @nazeem: 10%
open: 11.4% ams: 8.6% 76.5% 76.5% 30.8% 23.1% 20%
#sidneymyer- @australian- #kkrockchic: #mc: 17.6% #purposewor- #belieber: @rebeccavall- @hishandso-
musicbowl: open: 8.6% 64.7% ldtour: 15.4% 15.4% ance: 10% meself: 10%
8.6%
Start: 05-19 End: 05-19 Start: 06-25 End: 06-25 Start: 10-07 End: 10-07 Start: 11-14 End: 11-14
04:00 05:10 04:50 06:10 04:20 05:10 23:00 23:50
Tweets count: Area (sqkm): Tweets count: Area (sqkm): Tweets count: Area (sqkm): Tweets count: Area (sqkm):
29 0.11 34 7.042 9 1.761 28 0.44
Top 5: #photo: Top 5: #afl: 29.4% Top 5: #winx: 44.4% Top 5: #melbourne:
65.5% 28.6%
#gabs2017: @gabsfestival: #afltigersbl- #goblues: #gowinx: #melbs: #job: 21.4 % #hiring:
31% 13.8% ues: 14.7% 14.7% 11.1% 11.1% 21.4%
@tcbrewery: @illiards: #mcg: 11.8% #boundbyb- #spring: 22.2 #winxxi: #careerarc: #marriageeq-
3.4% 3.4% lue: 11.8% % 11.1% 17.9% uality: 14.3%
Figure 3 Sample detected events using Twitter Data in Melbourne, 2017George et al. Page 17 of 29
Table 7 Precision results: Melbourne detected events in 2017 using geotagged tweets (random
selection of 45 events)
Detected Events Results Manual Assessment
Top 5 hashtags/mentions: #
ID Date & Time C A SI ? Event Description
of tweets
#nickcave: 6, #australianopen:
-S 01-28 09:40 Serena Williams wins Australian
5 4, #23: 4, @serenawilliams: 3, 35 0.44 0.57 1
-E 01-28 10:40 Open final (Tennis)
@australianopen: 3
#greekandthecity: 13,
Thousands turn out to celebrate
-S 02-27 00:10 #lovelonsdale: 13, #kkfun-
9 18 0.44 2.94 1 Lonsdale St Festival’s 30th an-
-E 02-27 01:00 times: 13, #kkrockchic: 11,
niversary
#mc: 3
#adele: 10, #melbourne: 4,
-S 03-18 06:50 Adele adds new Melbourne show
12 #etihadstadium: 3, #adele2017: 14 0.44 1.43 1
-E 03-18 07:40 to 2017 Australian tour
2, #benandjase: 1
#worlds50best: 41, @the-
The 2017 awards ceremony for
-S 04-05 10:00 worlds50best: 28, @australia: 14,
22 94 0.03 1.11 1 the World’s 50 Best Restaurants
-E 04-05 12:20 #seeaustralia: 11, #restauran-
2017
taustralia: 10
* Melbourne Cricket Ground:
#anzacday: 15, #lestweforget: 8,
-S 04-25 04:00 AFL -round 5 - Essendon VS
26 @mcg: 8, #mcg: 6, #afldonspies: 44 0.01 0.95 1
-E 04-25 05:40 Collingwood. * ANZAC Day pub-
5
lic holiday
GABS 2017 global festival: sev-
@gabsfestival: 31, #photo: 26,
-S 05-21 04:20 enty five thousand attendees
30 #gabs2017: 13, @garage: 8, 36 0.03 2.22 1
-E 05-21 05:50 from across Australia and over-
@stockadebrewco: 2
seas
#dariusisbaptised: 7, #dariu-
-S 06-04 02:40
34 sisone: 6, #sentimentalsundays: 12 7.04 1.58 1 Private event: baptism
-E 06-04 03:30
4, @gozwift: 1, #ergo: 1
-S 06-09 09:20 #bravarg: 10, #mcg: 8, @mcg: Soccer game: Brazil VS Ar-
36 38 0.03 0.82 1
-E 06-09 11:00 5, #football: 5, #soccer: 3 gentina
Oz Comic-Con event: Showcas-
#cosplay: 11, #ozcomiccon: 10,
-S 07-01 07:00 ing all the latest studio acti-
37 #doctorwho: 2, #stormtrooper: 20 0.11 1.25 1
-E 07-01 08:00 vations, comics, anime, cosplay,
1, @missmelmacklin: 1
and video games
-S 07-15 04:00 @gold: 14, @stkildafc: 14, #hiik: St Kilda Football Club in support
38 15 0.11 2.8 1
-E 07-15 04:50 9, @fbi: 5 of Marriage Equality
#melbournelife: 10, #mel-
-S 08-13 23:30 bournecbd: 10, #melbournecen- National Gallery of Victoria:
39 10 0.44 3.7 1
-E 08-14 00:20 tral: 9, #hokusai: 7, #hokusia: Hokusai Exhibition
1
@shortstopmelb: 2, @bentoonzc:
-S 09-21 03:20 Not a valid event: General tweets
40 1, #sales: 1, #job: 1, #mel- 64 0.44 0.09 0
-E 09-21 04:20 ***
bourne: 1
C: Count, A: Area, ?: Event label
6.2.1 Precision and Strength Index Results
We select a random 45 events as the evaluation set. Table 7 reports the manual
evaluation results for sample selected events from the evaluation set. For each event,
the algorithm returns the results of the event start and end date-time, area/region
in sqkm, tweets count, top 5 hashtags/mentions with its occurrences. In total, 40
out of 45 are correct events according to the manual evaluation, with a precision
measure of 89%. False positives are highlighted in red in Table 7. The table shows
that both local and global events are detected using the proposed method (see the
”area” column in Table 7), concurrent events such as events # 26 and 45 (highlighted
in blue). The method also finds private events such as event #34 and opinion events
such as event #38 about marriage equality.George et al. Page 18 of 29
SI index is also reported for all events (see column ”SI” in Table 7). We obtain SI
with an average of 1.2 across the evaluation set. This is an indication that all tweets
for an event contain at least one of the relevant hashtags/mentions, which confirms
the accurate results of the proposed method.
6.2.2 Recall and Strength Index Results
We select 15 events to assess the recall with a total of 10 correctly detected events
according to the manual evaluation, with a recall measure of 66.7% and average
SI of 1.034. The reduction in recall is explainable since the social media does not
contain information about all actual events. This causes a certain increase in the
false negatives. Table 8 reports the date-time, top 5 entities, tweets count, event
area and SI for sample selected events from the evaluation set. In the table, the
false negatives are highlighted in blue.
Table 8 Recall results: Melbourne common events occurred in 2017
# Event Description Date-time Entity: occurrences * Area SI
#melbourne: 3, #queenvictoriamar-
The Night Market; -S 01-18 10:10
1 ket: 2, #glutenfree: 1, #nofilter: 2, 35 28.181 0.258
Wed 6-9pm -E 01-18 11:00
@hunde: 1
#melbourne: 4, #davidhockney: 1,
Moomba Festival; 10- -S 03-12 01:30 #shrineofremembrancemelbourne: 1,
2 16 7.04 0.498
13 Mar -E 03-12 01:50 #ladiesinblack: 1, @moombafestival:
1
#music: 4, #livemusic: 4, #mel-
Patti Smith performs; -S 04-16 13:20
5 bourne: 4, #horses: 3, #pattismith: 8 0.028 2.25
Apr 16 -E 04-16 14:00
3
-S 01-26 05:40 #art: 6, @ngv: 5, #ipad: 5, @aus-
6 Australia Day; Jan 26 20 1.76 1.3
-E 01-26 06:10 tralianopen: 5, #inspiration: 5
7 Labour Day; Mar 13 Not Detected
-S 04-17 04:00
9 Easter Sunday; Apr 16 #brunch: 1, #eastersunday: 1 4 7.04 0.5
-E 04-17 04:20
-S 04-25 04:00 #anzacday: 15, #lestweforget: 8,
10 ANZAC Day; Apr 25 44 0.007 0.96
-E 04-25 05:40 @mcg: 8, #mcg: 6, #afldonspies: 5
Queen’s Birthday; Jun
11 Not Detected
12
#melbournecup: 5, #foodlover: 1,
-S 11-07 06:40
13 Melbourne Cup; Nov 7 #burger: 1, #foodie: 1, #melbourne: 11 1.76 1.183
-E 11-07 07:10
5
#boxingdaytest: 6, #beatengland: 5,
-S 12-26 02:00
15 Boxing Day; Dec 26 #mcg: 4, #ashes2017: 3, #kneip- 10 0.007 2.1
-E 12-26 02:40
ping: 3
6.3 Case Study: Flickr Dataset
In this section, we present our second case study for event detection using the Flickr
dataset introduced in Section 5.1. The dataset was further reduced by keeping only
geotagged images for January-2013 for Melbourne and New York, while for London
and Paris we selected data for January 2012. The chosen years have largest number
of photos taken in January. We evaluated the proposed event detection method using
the set of images collected for each city. In our experiments, instead of extractingGeorge et al. Page 19 of 29
top k hashtags/mentions as in the twitter case study, we use the title, user tags
and description attributes for each image to extract the most frequent entities of
an event. Table 6, column ”Flickr” reports the results each individual phase of the
proposed method using the Flick dataset for each city.
Start: 01-20 22:50 End: 01-21 00:20 Start: 01-25 14:50 End: 01-25 16:50
Images count: 40 Area (sqkm): 4.089 Images count: 82 Area (sqkm): 1.023
Top 5: danny: 7% Top 5: museum: 19.6%
rock: 6.9% ben: 6.9% science: 10.3% gallery: 9.9%
bowes: 3.9 % bush: 3.6 % art: 9.8% london: 9.8%
SI = 0.283 SI = 0.594
Event: An evening with Danny & Ben from Thun- Event: Howler performing at Rough Trade East,
der, London-England, 20 January,2012 Brick Lane, London on 25-January 2012
(a)
Start: 01-09 11:00 End: 01-09 11:50 Start: 01-28 13:40 End: 01-28 16:20
Images count: 16 Area (sqkm): 0.108 Images count: 82 Area (sqkm): 1.723
Top 5: workshop: 12.5% Top 5: tedxconcorde: 19.4%
arduino: 12.5% ensad: 12.5% paris: 15.1% tedx: 9.7%
day: 6.2 % lab: 6.2 % 3a: 8% france: 5.5%
SI = 0.499 SI = 0.577
Event: Arduino workshop, day one, Paris-France, 9 Event: TEDx Concorde event in Paris, January 28,
January, 2012 2012 - Theme La Diversite
(b)
Figure 4 Sample event detection results using Flickr images, January-2012 in: (a) London, (b)
Paris
Figure 4 shows a sample of detected events in London and Paris, January-2012 using
the Flickr dataset. We manually evaluate the detected events by using Google and
looking at the tags, description and title of images in an event. The figure includes
the description of each event as well as the computed SI index. Similarly, we were
able to identify and verify various detected events in Melbourne and New York for
January-2013. These results demonstrate the effectiveness of the proposed method
for event detection in different social media.George et al. Page 20 of 29
6.4 Comparative Analysis of Baseline Algorithms
6.4.1 POI-based Event Detection
We use the January-2017 Melbourne geotagged tweets dataset to run this exper-
iment. We selected 242 POIs (100m x 100m) in Melbourne where most of events
occur. We apply the proposed event detection algorithm on the POIs instead of the
the multiscale grid generated by quad-tree method. Every ∆T (i.e. 10-min), we flag
all POIs with smoothed signal less than the threshold (τ2 ).
Table 9 Melbourne detected events in 28-January 2017 using each of POI and Quad-tree methods
Top 5 hashtags/mentions (hashtag/mention : % of oc-
# Time-Duration Count Area
currences)
POI events
#ausopen: 37.5, @australianopen: 25, #williamssisters:
1 -S 08:30 -D 40 16 0.01
18.8, @serenawilliams: 12.5, #melbourne: 12.5
#nickcave: 80, #sidneymyermusicbowl: 60, #livemusic:
2 -S 10:00 -D 20 5 0.01
20, #melbourne: 20
#ausopen: 50, #womensfinal: 33.3, #rodlaverarena:
3 -S 11:10 -D 40 12 0.01
33.3, #ausralianopen: 25, #serena: 25
Quad-tree events
#ausopen: 33.3, #williamssisters: 23.8, @aus-
1 -S 08:30 -D 40 tralianopen: 23.8, @venuseswilliams: 14.3, @sere- 21 0.052
nawilliams: 14.3
#ausopen: 50, #williamssisters: 25, @australianopen: 25,
2 -S 08:40 -D 30 12 0.003
#melbourne: 16.7, #grandslam: 8.3
#nickcave: 80, #sidneymyermusicbowl: 60, #livemusic:
3 -S 10:00 -D 20 5 0.013
20, #melbourne: 20
#nickcave: 20.8, @serenawilliams: 12.5, #23: 16.7,
4 -S 10:00 -D 40 24 0.834
#australianopen: 12.5, #sidneymyermusicbowl: 12.5
#nickcave: 13.2, @serenawilliams: 10.5, #sidneymyer-
5 -S 10:00 -D 50 38 13.347
musicbowl: 7.9, #23: 10.5, #australianopen: 7.9
@australianopen: 28.6, #serenavsvenus: 14.3, #23: 28.6,
6 -S 10:20 -D 20 7 0.003
#venus: 14.3, #williamssisters: 14.3
#ausopen: 54.5, #womensfinal: 36.4, #rodlaverarena:
7 -S 11:10 -D 30 11 0.003
36.4, #ausralianopen: 27.3, #serena: 27.3
#melbourne: 100, #hiring: 53.8, #job: 53.8,
8 -S 20:50 -D 20 13 0.052
#bourkestreet: 46.2, #careerarc: 46.2
Table 9 reports the details of the detected events on 28/01/2017 using each of the
proposed and baseline methods. The results show that our approach is able to detect
all events that were identified by the baseline method, along with additional events
with different spatial scales that the baseline method was unable to detect. Also, the
conducted experiments show that POI-based method detects events with shorter
duration than the quad-tree based method. The reason is that POI grid cells are
small (100m x 100m).
6.4.2 Incremental Clustering for Event Detection
We implemented the full algorithm in Python and experimented using the geotagged
tweets dataset for Melbourne in 2017. We run the algorithm using the following
parameters: time tick t = 10min, R = 0.25km, ∆T = 3hrs, K = 2, and N = 5. TheGeorge et al. Page 21 of 29
Start: 01-14 08:20 End: 01-14 11:10 Start: 02-24 5:50 End: 02-24 8:40
Tweets count: 11 SI: 1.636 Tweets count: 7 SI: 1.571
Top 5: #tennis: 5 Top 5: #melbwc17: 4
#ausopen: 5 #australianopen: 4 #gymnasticsworldcup: #polskiprogram: 2
3
#sport:2 #melbourne: 2 @streetsmithmelb: 1 #melbourne: 1
Start: 04-23 5:20 End: 04-23 8:00 Start: 05-05 06:00 End: 21-20 0:10
Tweets count: 14 SI: 0.786 Tweets count: 6 SI: 0.833
Top 5: @mcg: 5 Top 5: @golfclearanceau: 1
@hawthornfc: 3 #alwayshawthorn: 1 #allstarcomics: 1 #melbourne: 1
#wow: 1 #strongasone: 1 #temellijewellery: #fcbd : 1
Start: 07-23 04:20 End: 07-23 7:10 Start: 12-30 23:20 End: 12-31 2:10
Tweets count: 7 SI: 0.857 Tweets count: 28 SI: 0.536
Top 5: #peterpan: 2 Top 5: #melbourne: 8
#wheninmelbourne: 1 #street: 1 #job: 3 #culturaltart: 2
#pirates:1 #twerk: 1 #money: 1 @acmi: 1
Figure 5 Clustering based event detection results using Twitter Data in Melbourne, 2017
values of the first two parameters are chosen to be close to the values used in our
approach for fair comparison. While the values of the other parameters are chosen
to be the same as the ones used in the paper [10].George et al. Page 22 of 29
For each time tick, i.e. 10min, we record the set of significant unions (i.e. clusters). In
total, we obtained 154546 significant events in Melbourne 2017. To avoid detecting
same event many times through different time ticks, we group the set of detected
events by their union ID. Then we keep only the event with the highest number of
tweets for each union ID. This grouping strategy has decreased the total number of
significant events to 3994, since it removes all redundant events. Figure 5 visualises
some of the detected events on the map. Each event has the start and end time,
total tweets, SI index and the top 5 hashtags/mentions.
For quantitative comparison with our approach, we compute precision and recall
for the implemented algorithm. Similar to the evaluation of our approach, we use
the top hashtags/mentions along with the event time to manually evaluate the
correctness of the event.
Precision Evaluation. We select a random 20 events as the evaluation set. Table
10 shows the manual evaluation results for all events. For each event, we calculate
the the event start and end date-time by using the date-time of all tweets assigned
to each cluster. We also report area/region in sqkm, tweets count, top 5 hash-
tags/mentions with its occurrences, event description and SI index for all events.
In total, 9 out of 20 are correct events according to the manual evaluation, with a
precision measure of 45%. It is clear that the precision is very low compared to our
results. The reason is that using small values for k and N resulted in large number
of detected events, where the majority of these events are just noise. This can be
improved by increasing the values of k, and N which will result in smaller number
of detected events and accordingly less false positives.
Recall Evaluation. We use the same 15 common events used for recall assessment
in our approach. We obtained a total of 13 correctly detected events, according to
the manual evaluation, with a recall measure of 86.7% which is higher than the recall
measure of our approach. The reason is that the parameters used in this experiment
result in large number of true negatives and false positives. Parameters should be
tuned to balance the trade off between recall and precision. Table 11 reports the
date-time, top 5 hashtags/mentions with its occurrences, tweets count, event area
and SI for all events. The false negatives are highlighted in blue in the table.
Parameters Effect. A different values for each of ∆T , K, and N have been used
to their their effect on the total number of detected events as well as precision and
recall measures. In total we ran 21 experiments, each has different set of parameters.
For each experiment, we record the total number of significant unions/events and
the detected events, as shown in Table 12. From the table, the smallest number
of events in Melbourne 2017 is detected using the parameters: ∆T = 30minutes,
K = 10, and N = 15, with a total of 59 events (highlighted in red in the table).
While the largest number of events is detected using the parameters: ∆T = 3hrs,
K = 2, and N = 5, with a total of 154546 events (highlighted in blue in the table).
This shows the great impact of parameter selection on the final detected events.
Figure 6 also visualises the effect of the temporal gap parameter ∆T on the total
detected events.
We also compute the precision and recall using the parameters set that yields the
smallest number of detected events, i.e. 59 events, The used parameters are: ∆T =You can also read